Godawari Power - Any Trackers?

Interest rates are being hiked because of high inflation.
High inflation is because of high commodity prices.
2002-07- both commodity prices and interest rates went up in US and India- and there was no recession. I don’t think normal people can forecast recessions and growth periods of the future. A recession has come every 7-8 yrs anyways, even covid 2020 was a big recession globally. Infact, it seems Indian economy is still down vs pre-covid levels, so technically, we are in a recession since covid started.

Also, history tells otherwise as in the pic below-

Anyways, I am around a 50 yr old man.
And, over these 50 years, I have seen prices of everything doubling every 10 years at the least.
This includes basic items like bread, school fees, tomato prices, price of a bucket, land prices, construction cost, glass prices, parking price, almost everything.
Indian rupee keeps falling to new lows every few years. Even prices for hiring a driver or a maid have gone up 5x over last 20 years.

I am pretty sure that prices of almost everything will again double in next 10 years in India- does not matter what China does, recession comes or not, BJP comes or Congress comes. INR will cross 100 in few yrs, or a decade may be. That alone (fall in INR) will increase steel prices by 25% in India.

Despite prices going up, majority of steel companies will make wafer thin margins even 10 yrs from now, because it is a commodity business. You have to buy raw material at market price and sell finished good at market price. So, profit percentage is low for most of the companies.
This export duty will kill many small steel mills that have low margins and many have already stopped production example KIOCL.
Fundamentally, GPIL is way different from rest of the steel sector. (FMCG buys raw material at market prices, and sells finished goods at own price- GPIL is FMCG in a reverse way- raw material is own price- but finished good is market price- and thus the margins are way higher than most of the listed companies in Indian markets.)

17 Likes

in your excel sheet, you have taken expenses to be 20% higher than FY 22 expenses.
GPIL major expense is old royalty rates, which it pays to state govt- this will be lower by 20% as the sale price is also lower.
Also, freight and logistic expense also likely to be lower- as exports will not be there.
(if sale price of pellet has gone down, the cost will also go down- hence, effect of fall in profits will be less stark than what market thinks)

Hence, you can revise the expenses part and make atleast the same as last year.
Also, billet and wire rod prices etc have risen in the meanwhile and likely to rise further.

Meanwhile stock is near 1x EV/EBITDA now for FY 24 earnings! That’s almost as cheap as it was ever in this history!

6 Likes

Yeah, I was a bit unclear there - is there a minimum royalty based on quantity mined ? is the royalty fixed on IBM rates or “fixed x amount” based on quantity. Let me also check the ARs if there’s a formula mentioned, remember reading somewhere that the extraction cost itself incl royalties is ~Rs.3000/ton.

2 Likes

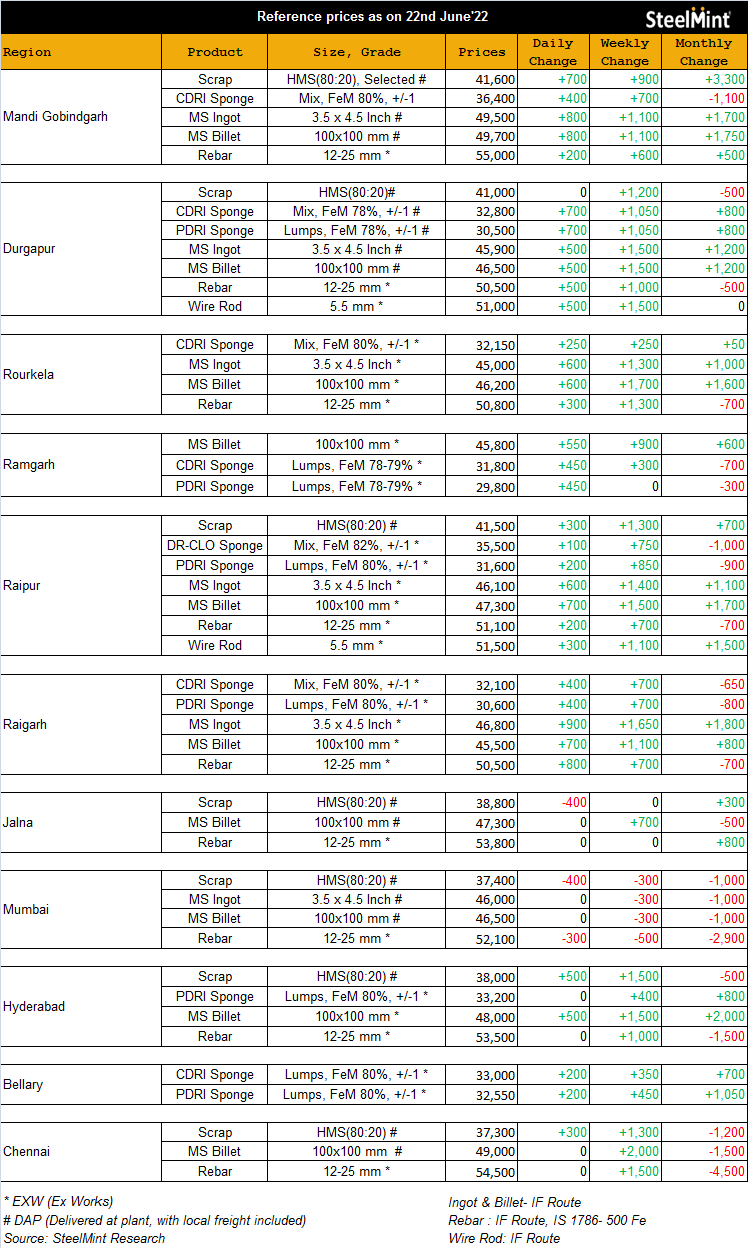
Again massive surge in today’s semi-steel prices.
Prices are now same or higher than Q4 prices for GPIL
This will compensate fall in pellet prices big time (plus addition of solar plants, high grade pellets etc).
I don’t see any fall in EBITDA at these levels!

4 Likes

I’m still amazed at this business, if gpil continues to prove to the market that their earnings are sustainable, it might be an absolutely unprecedented re-rating. Watching the thesis develop will quite possibly be the most interesting thesis for fy23. Sitting on the sidelines.

Disc - not invested. I don’t understand the business very well.

4 Likes

Chinese real estate accounts for about 250 million tons of steel consumption per annum. Over the next 18 months, this should fall by about 50 percent - it takes about 18 months to complete a project from sales to delivery in china.

@Kumar_manas your thoughts on steel price impact due to this?

very good news. Expect a big stimulus from Chinese govt then.
In China, things work opposite- good news means Govt will reduce stimulus- bad news means govt will increase stimulus.

3 Likes

This is what I was talking about-

  1. Operating at full capacity means mills will be incurring losses to the tune of ₹1,000-2,000/tonne at current selling prices of ₹30,000–32,0000 per tonne (ex of Raipur).

  2. Many mills in these two States are also mulling closures for annual maintenance.

There will be huge shortage sooner or later.
You can’t really manipulate markets and bring down the prices just like that.

The company has announced 4x increase in mining capacity in latest quarterly results. This sets a pretty high growth rate for next 7-8 years.
This should have ideally increased valuations and stock price, but reverse has happened.
Markets are strange!

6 Likes

This is a very important chart.

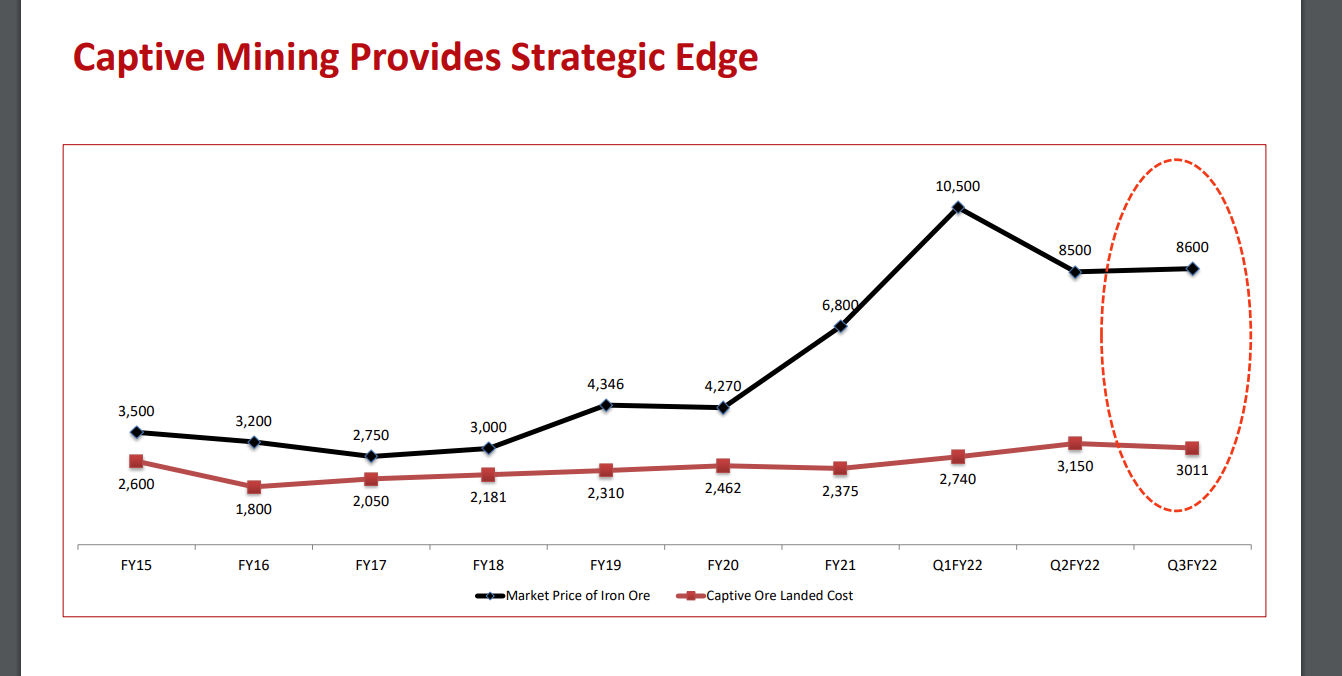
Basically, the royalty and hence, cost of even captive iron ore changes with the market price.
Currently, the price of pellet has fallen from Rs. 11000 to Rs. 8500 (high grade included)- a fall of 22%. This is 122 crore quarterly revenue gone.
At the same time cost per tonne of own iron will also come down by around Rs. 600-700 per tonne.

This implies- quarterly revenue loss of Rs. 122 crore.
And quarterly cost savings of Rs. 50-60 crores (as this applies for whole business including captive pellets which are used for sponge iron and wire rod- whose prices are at Q4 levels only)
Net loss of duty impact- Rs. 60 crores.
This Rs. 60 crore will be made up by additional savings from solar power plants, ferro alloy business and additional 20% increase in sponge iron capacity.

Hence, it looks like negligible impact for GPIL despite pellet prices falling down. (as 900 crore quarterly revenue from sponge iron, billet, wire rod is not impacted- prices are same as Q4 levels, while lower price of iron ore will increase margins for this revenue)

Please let me know if these calculations look correct?

6 Likes

Think @Rakesh_Arora had shared a useful working model to estimate sustainable EBITDA on this thread previously, would be good to get a refresh basis recent internal CAPEX and external changes. Possible to share an updated model with your latest thoughts Rakeshji?

1 Like

Very interesting news-

The miner has raised the base price for lump by up to INR 1,150/t and that for fines by up to INR 800/t as against the base prices fixed for the auction scheduled for 17 June.

Iron ore is a monopoly/duopoly market with bulk of iron ore coming from govt owned miners.
NMDC had cut iron ore prices due to pressure from the central govt.
But, even these miners need to pay ever increasing salaries and also need some money for developing new mines.
I guess Odisha mining corp is not under pressure from central govt and hence is increasing prices.

If this happens- this will be very negative for most pellet companies- as iron ore price will increase and pellet prices may stay low- 90% of pellet cos may shutdown as they have to buy iron ore from markets.

6 Likes

These are the weighted average prices from last auction (just before export duty announcements) in May https://omcltd.in/Portals/0/PDF/Price%20for%20website%20-19.05.2022.pdf
Looks like poor off-take in May auction:
https://www.newindianexpress.com/states/odisha/2022/may/29/omcs-iron-ore-pricing-behind-poor-bidding-2459344.html

1 Like

this article also mentions this-

KNIA members alleged that amid poor market demand and diminishing product price, price hike of iron ore is only creating a crisis scenario in the dependent industries. Many plants at Kalinga Nagar have already closed down given the challenges faced by iron and steel sector in the State.

Thousands of contractual staffers have been retrenched and livelihood of other workers including truck drivers, helpers etc is also at stake, they claimed.

1 Like

I see. Sorry for the confusion.

It is always around the current levels

No, I made a mistake. I was talking about the Metals Index. The Steel prices have been in a steady up trend:

Here is the historical monthly price

Date Price Open High Low Volume Chg%
Jun 2022 46,600.00 47,050.00 49,440.00 46,300.00 0.03K -2.92%
May 2022 48,000.00 56,900.00 57,000.00 46,690.00 0.94K -16.84%
Apr 2022 57,720.00 58,650.00 63,100.00 54,000.00 2.03K -0.19%
Mar 2022 57,830.00 52,500.00 62,000.00 52,500.00 3.65K 12.93%
Feb 2022 51,210.00 47,500.00 51,600.00 47,500.00 0.32K 7.81%
Jan 2022 47,500.00 44,200.00 47,500.00 43,280.00 0.43K 7.83%
Dec 2021 44,050.00 44,200.00 44,700.00 41,990.00 1.05K -0.41%
Nov 2021 44,230.00 47,200.00 47,400.00 42,800.00 1.32K -6.29%
Oct 2021 47,200.00 46,900.00 49,000.00 45,200.00 1.21K 2.36%
Sep 2021 46,110.00 44,500.00 46,800.00 44,000.00 1.57K 3.92%
Aug 2021 44,370.00 45,400.00 46,790.00 42,660.00 1.88K -1.16%
Jul 2021 44,890.00 42,550.00 45,080.00 40,330.00 2.96K 5.30%
Jun 2021 42,630.00 44,520.00 46,650.00 42,400.00 2.87K -4.50%
May 2021 44,640.00 44,120.00 47,390.00 43,430.00 2.35K 1.99%
Apr 2021 43,770.00 41,330.00 45,500.00 41,110.00 1.80K 5.75%
Mar 2021 41,390.00 38,900.00 41,520.00 38,470.00 5.41K 7.09%
Feb 2021 38,650.00 36,050.00 40,100.00 35,550.00 5.96K 7.27%
Jan 2021 36,030.00 38,400.00 38,450.00 35,860.00 5.57K 26.42%
Jul 2017 28,500.00 28,500.00 28,500.00 28,500.00 0 -2.43%
Jun 2017 29,210.00 29,210.00 29,210.00 29,210.00 0 2.10%
May 2017 28,610.00 28,610.00 28,610.00 28,610.00 0 -6.26%
Apr 2017 30,520.00 30,520.00 30,520.00 30,520.00 0 0.86%
Mar 2017 30,260.00 30,260.00 30,260.00 30,260.00 0 6.18%
Feb 2017 28,500.00 28,500.00 28,500.00 28,500.00 0 5.95%
Jan 2017 26,900.00 26,900.00 26,900.00 26,900.00 0 -3.96%
Dec 2016 28,010.00 28,010.00 28,010.00 28,010.00 0 8.57%
Nov 2016 25,800.00 25,800.00 25,800.00 25,800.00 0 6.04%
Oct 2016 24,330.00 24,330.00 24,330.00 24,330.00 0 -3.83%
Sep 2016 25,300.00 25,300.00 25,300.00 25,300.00 0 8.17%
Aug 2016 23,390.00 23,390.00 23,390.00 23,390.00 0 2.95%
Jul 2016 22,720.00 22,720.00 22,720.00 22,720.00 0 -5.73%
Jun 2016 24,100.00 24,100.00 24,100.00 24,100.00 0 -3.21%
May 2016 24,900.00 24,900.00 24,900.00 24,900.00 0 -3.90%
Apr 2016 25,910.00 25,910.00 25,910.00 25,910.00 0 -0.80%
Mar 2016 26,120.00 26,120.00 26,120.00 26,120.00 0 -0.68%
Feb 2016 26,300.00 26,300.00 26,300.00 26,300.00 0 11.91%
Jan 2016 23,500.00 23,500.00 23,500.00 23,500.00 0 -9.30%
Dec 2015 25,910.00 25,910.00 25,910.00 25,910.00 0 16.82%
Nov 2015 22,180.00 22,180.00 22,180.00 22,180.00 0 -6.81%
Oct 2015 23,800.00 23,800.00 23,800.00 23,800.00 0 -9.19%
Sep 2015 26,210.00 26,210.00 26,210.00 26,210.00 0 -5.07%
Aug 2015 27,610.00 27,610.00 27,610.00 27,610.00 0 6.93%
Jul 2015 25,820.00 25,820.00 25,820.00 25,820.00 0 -10.44%
Jun 2015 28,830.00 28,830.00 28,830.00 28,830.00 0 -3.38%
May 2015 29,840.00 29,840.00 29,840.00 29,840.00 0 -0.33%
Apr 2015 29,940.00 29,940.00 29,940.00 29,940.00 0 -3.88%
Mar 2015 31,150.00 31,150.00 31,150.00 31,150.00 0 -1.74%
Feb 2015 31,700.00 31,700.00 31,700.00 31,700.00 0 2.76%
Jan 2015 30,850.00 30,850.00 30,850.00 30,850.00 0 -4.67%
Dec 2014 32,360.00 32,360.00 32,360.00 32,360.00 0 -0.92%
Nov 2014 32,660.00 32,660.00 32,660.00 32,660.00 0 -0.91%
Oct 2014 32,960.00 32,960.00 32,960.00 32,960.00 0 -2.40%
Sep 2014 33,770.00 33,770.00 33,770.00 33,770.00 0 0.45%
Aug 2014 33,620.00 33,620.00 33,620.00 33,620.00 0 -4.41%
Jul 2014 35,170.00 35,170.00 35,170.00 35,170.00 0 -3.80%
Jun 2014 36,560.00 36,560.00 36,560.00 36,560.00 0 -0.35%
May 2014 36,690.00 36,690.00 36,690.00 36,690.00 0 2.26%
Apr 2014 35,880.00 35,880.00 35,880.00 35,880.00 0 3.82%
Mar 2014 34,560.00 34,560.00 34,560.00 34,560.00 0 -2.04%
Feb 2014 35,280.00 34,000.00 34,700.00 34,000.00 0.03K 4.47%
Jan 2014 33,770.00 34,040.00 34,040.00 32,150.00 0.16K 1.11%
Dec 2013 33,400.00 32,410.00 35,470.00 32,400.00 0.45K 2.55%
Nov 2013 32,570.00 32,000.00 32,640.00 32,000.00 0.82K 1.27%
Oct 2013 32,160.00 32,160.00 32,160.00 32,160.00 0 -1.95%
Sep 2013 32,800.00 32,800.00 32,800.00 32,800.00 0 2.18%
Aug 2013 32,100.00 32,100.00 32,100.00 32,100.00 0 2.92%
Jul 2013 31,190.00 31,190.00 31,190.00 31,190.00 0 -3.68%
Jun 2013 32,380.00 33,400.00 33,400.00 33,400.00 0.02K -0.67%
May 2013 32,600.00 32,600.00 32,700.00 30,720.00 0.03K -0.15%
Apr 2013 32,650.00 32,540.00 32,800.00 31,900.00 0.17K 0.52%
Mar 2013 32,480.00 31,800.00 33,000.00 30,750.00 0.50K 2.17%
Feb 2013 31,790.00 31,900.00 32,600.00 31,310.00 1.53K -0.41%
Jan 2013 31,920.00 34,350.00 34,450.00 31,500.00 4.07K -5.37%
Dec 2012 33,730.00 35,200.00 35,200.00 32,550.00 2.03K 1.23%
Aug 2012 33,320.00 30,100.00 33,340.00 29,380.00 18.17K 10.62%
Jul 2012 30,120.00 32,500.00 33,500.00 29,350.00 68.77K -7.24%
Jun 2012 32,470.00 33,380.00 33,700.00 32,000.00 64.55K -2.70%
May 2012 33,370.00 34,120.00 34,270.00 32,550.00 83.24K -2.14%
Apr 2012 34,100.00 34,620.00 34,920.00 33,610.00 77.82K -1.42%
Mar 2012 34,590.00 34,200.00 35,480.00 33,700.00 163.57K 1.29%
Feb 2012 34,150.00 32,360.00 34,260.00 31,250.00 130.69K 5.21%
Jan 2012 32,460.00 32,920.00 34,380.00 31,660.00 135.20K -1.31%
Dec 2011 32,890.00 31,450.00 32,960.00 31,250.00 121.01K 4.38%
Nov 2011 31,510.00 32,090.00 33,190.00 31,080.00 172.76K -1.78%
Oct 2011 32,080.00 29,610.00 32,710.00 26,970.00 131.44K 8.16%
Sep 2011 29,660.00 29,810.00 30,200.00 28,940.00 118.87K -0.50%
Aug 2011 29,810.00 30,860.00 31,180.00 28,910.00 164.51K -3.03%
Jul 2011 30,740.00 30,200.00 30,900.00 29,170.00 219.61K 1.69%
Jun 2011 30,230.00 29,190.00 31,670.00 29,150.00 291.40K 3.60%
May 2011 29,180.00 28,550.00 29,300.00 28,410.00 193.26K 2.10%
Apr 2011 28,580.00 28,500.00 28,850.00 27,800.00 211.96K 0.46%
Mar 2011 28,450.00 27,240.00 29,090.00 26,830.00 352.05K 4.37%
Feb 2011 27,260.00 28,560.00 28,920.00 25,660.00 491.68K -4.69%
Jan 2011 28,600.00 27,140.00 29,530.00 26,750.00 667.29K 5.34%
Dec 2010 27,150.00 24,820.00 27,300.00 24,670.00 330.03K 9.34%
Nov 2010 24,830.00 24,800.00 25,100.00 23,720.00 176.44K 0.12%
Oct 2010 24,800.00 25,480.00 25,920.00 24,310.00 263.07K -2.67%
Sep 2010 25,480.00 24,750.00 25,720.00 24,480.00 340.25K 3.16%
Aug 2010 24,700.00 24,460.00 24,880.00 23,650.00 324.91K 0.82%
Jul 2010 24,500.00 23,940.00 24,500.00 22,830.00 308.48K 2.13%
Jun 2010 23,990.00 24,070.00 24,420.00 22,710.00 430.09K -0.42%
May 2010 24,090.00 25,580.00 26,240.00 24,010.00 457.79K -5.42%
Apr 2010 25,470.00 29,390.00 29,650.00 25,310.00 634.92K -13.01%
Mar 2010 29,280.00 24,750.00 29,450.00 24,740.00 416.15K 18.49%
Feb 2010 24,710.00 24,790.00 25,180.00 23,460.00 223.56K -0.12%
Jan 2010 24,740.00 26,840.00 27,960.00 24,170.00 328.39K -7.24%
Dec 2009 26,670.00 21,200.00 27,520.00 21,170.00 246.88K 25.98%
Nov 2009 21,170.00 21,490.00 21,500.00 20,100.00 58.03K -1.31%
Oct 2009 21,450.00 22,830.00 22,840.00 21,000.00 71.74K -6.00%
Sep 2009 22,820.00 23,350.00 23,750.00 22,220.00 69.31K -2.23%
Aug 2009 23,340.00 20,940.00 23,350.00 20,760.00 93.99K 12.05%
Jul 2009 20,830.00 20,850.00 21,310.00 19,120.00 78.69K -0.19%
1 Like

From Jun 2012 to Jun 2022 the CAGR is 4.35%

However, I cant find data from 2000.

Last decade was a lost decade for commodities, and even then the CAGR was 4.4% in prices terms.
Also, this CAGR Is after the export duties are imposed and prices have come down.
There was deflation/zero interest rates in most countries in last 10 years.

We need to have 20 year CAGR for better idea.

2 Likes

Again price surge today, with prices same as Q4 levels, which is almost the highest in the history for quarterly semi-steel prices.

Can anyone explain why prices are high despite best attempt of price manipulation by the FM (export duty), rate hikes, recession, market crash etc etc?

6 Likes