
Average per car revenue from BMW/Merc is approximately 8 lakhs, if you go to annual report, they mention somewhere in one line.![]()
![]()
1 Like
That is a positive in my opinion
Can you please share this post with a screenshot from annual report ?
It will be more helpful for all the members.
Adding …
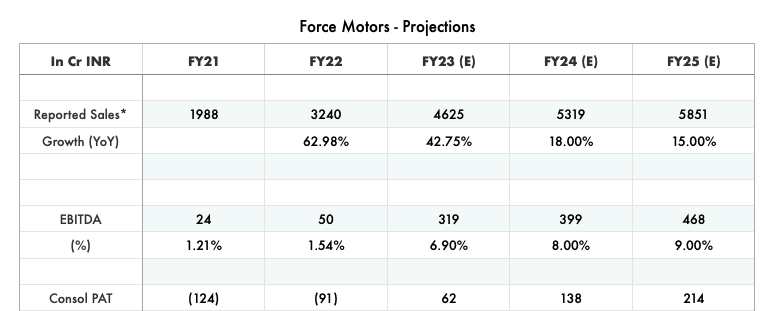
Revenue potential : (FY-24 estimates)
OEM + Engine business : Current sales run-rate is > 1300 Cr with average ebitda margins of 8-9%, extrapolating it without considering any growth, yearly standalone numbers will look like :
Sales of 5200 Cr with EBITDA of 416-468 Cr
Dep + Interest at 300 Cr
PBT at 116-168 Cr
Current market cap is 1694 Cr & interest cost will come down with cash flows coming in and capex also commercialising.
Considering debt coming down to 500 Cr at the end of FY-24 (conservatively) - the company is available at 4-5x EV/EBITDA with Sales & EBITDA being at all time highs.
Joint Venture with MTU : Since Force is having 51% stake in the JV - Sales are not included in the financial statements and they get the JV share directly in PBT. In FY-22, they did sales of ~78 Cr, EBITDA loss of ~20 Cr and net loss of ~33 Cr - This JV is expected to achieve revenues of over 300-400 Cr in medium term (source - credit rating). Assuming that they do revenue of 400 Cr in FY24 (while peak sales potential can be 2x of it) and with increased localisation of RM content - ebitda margins of 8% (similar to their existing business) then we can expect bottomline to break-even and in FY-25 the JV can become profitable. (Please note that these are just assumption & might go wrong)

So even without considering the JV business which can turn profitable and achieve ebitda margins of over 14% once RM localisation takes place - the company is available at below 1x book value.
Links :
Force MTU credit rating report : India Ratings and Research: Most Respected Credit Rating and Research Agency India
Force MTU audited statements : https://www.forcemotors.com/themes/frontend/docs/share-holder-info/annual-report/Force_MTU_Power_Systems_Pvt_Ltd.pdf
Force Motors credit rating report : Rating Rationale
6 Likes
Giving a Capex Intensive Company an EV/EBITDA multiple isn’t right in my opinion.
What matters at the end of the day is Free Cash Flow to Investors, yes you might have few years with low re-investments but you’re going to have to reinvest in the Machinery & R&D eventually which is why Depreciation accounting is done.
If I take company’s Deployed Capital ex Cash & Investments from Sep Balance Sheet ~ 2500 Cr. For company to meet their Cost of Capital their EBIT(1-T) should be > 350 Cr. EBITDA has to be 700 Cr and Sales > 7500 Cr. This is more than 40% jump in their extrapolated sales.
Company has capitalised on R&D investments which is why Book Value is high. I love when Companies capitalise on R&D instead of taking it directly to P&L because you can gauge the true returns on Deployed Capital. Yes there could be some value for Investors emerging now but would like to know your reasons of thinking it Value Buy basis BV.
Inviting Contra views on this.
Found this while studying- https://www.mtu-solutions.com/seai/en/pressreleases/2022/milestone-towards-net-zero--mtu-gensets-from-rolls-royce-approve.html
Good read. They even have a paper on this but haven’t gone through that yet.
1 Like
If we look at the capex incurred, it has increased significantly only during the last few years as the company has invested on newer platforms/tech.

Not arguing that it isn’t a capex intensive business but at the end of day, the company will also look at how efficiently have they utilised those assets in which they have invested before doing another capex. I may go wrong but my bet is on the huge operating leverage expected to play out.
Agree on this point and if we look at H1 FY-23 numbers - they generated free cash flows of 125 Cr but we will have to see whether these numbers will sustain (if there are no further plans of large capex then they should)

Posting some old articles where the company/management mentioned about capex plans :
- Investment of over 1000 Cr was lined up for two models - Urbania (which is launched in Q3) and Traveller Electric variant (should be launched in FY24 hopefully)
- Capacity enhancement by 35000 units (CY22 sales were at 24.3k units - so I feel they won’t incur this big capex very soon)
Urbania is a luxury-yet-affordable van and the company will be focusing on export markets with this model - margins might be superior than that of domestic in exports.


Intangibles on the balance sheet accounted in FY22 were only 16.39% of total gross block - that doesn’t make that big a difference imo. Book value has increased primarily because of the capital investment in T-1N platform and Gurkha.
I am not considering it a value buy just on the basis of a single metric - I have mentioned many triggers which I feel can re-rate it once numbers start coming.
1 Like
My two cents - be cautious. On the face of it, there are good triggers. But this management is not one that cares for minority shareholders. Poor disclosures, no analyst calls, unexpected other expenses that dramatically reduce profits. The company’s promoters may do well, but based on past history, chances of minority shareholders benefitting are remote.
Disclosure - Invested myself (regrettably).
1 Like
Agree on this that they’re sitting on operating leverage play out but my point is on Return on Capital.
Would like to know your growth numbers and the subsequent Returns basis Margin Improvement and Sales growth and the bear and bull case and see if they optimistically are able to achieve their Cost of Capital few years out and if they can sustain it.
There seems to be a one off related Non Financial Liabilities and Other Non Financial Assets to the extent of ~ 100 Cr in the 125 Cr number.
In agreement and love the vehicle niche in market and price but somehow my model can’t come to a scenario where they break their Cost of Capital.
I am holding this stock for long now, sold in between however bought back again, Moat is very strong here, if India will achieve 5 T GDP by 2029-30 than BMW/Merc volumes will at triple from current levels. current market cap to sales is 3.5 which is dirt cheap.
I have problem with corporate governance, other expenses are always in sync with topline, sometime i feel to complain SEBI for a forensic audit.
On a positive note, they have large facility acquired from MAN trucks, stock is cheap, future is bright and lot of uncertainties.
Major Capex is over now, need to wait capex to turn to cash flow.
4 Likes
I agree on this point - initial return on capital will be low but as they ramp up & depreciation is also fully charged - incremental RoC should improve (this being a long term phenomenon - if they don’t any major capex in next couple of years)
My estimates are that Force (at consol level) can at least cross the last peak PAT (of 180 Cr in FY17) by FY25 (base case) - still return ratios (RoCE to be specific) at very optimistic case can cross double digit levels.
FY23 EBITDA can very well be the highest ever in the history for the company and sequential improvement should be there in FY24.
I am still not able to figure out incremental return ratios (as further capex plans are not known) and revenue potential of new launches such as Urbania, Gurkha & Citiline is anyone’s guess. I feel this is where the risk is and if they can sweat the assets efficiently - rewards can be big (as compared to the risk we are taking at current valuations).
Margin expansion is needed to achieve that and with Urbania targeting export markets & company has already been consulting with KPMG & E&Y for cost controlling measures since last 2-3 years - overall margins should improve (but can’t say whether they will improve to double digit or not).
In past, the peak RoCE which the company did was of 18% in FY-16 but later on it dipped as CV cycle also reversed and the company kept on doing capex. Hopefully they will be able to cross this as JV becomes profitable and they scale their operations.
All being said - the company seriously need to review its marketing strategies. They have superior products but lack in marketing - hopefully they will work on it.
As far as return ratios are concerned - I feel most of the OEMs (in CVs and some in PVs) have seen contraction and last peak in most of them was during 2016-18 period.
D - Invested & definitely watching closely and aware of these risks - margin of safety is very high at current valuations.
6 Likes
Decent Q4 performance. Improvement in both margins as well as topline along with one time exception income of Rs 308 Cr.
The Company seems to be a turn around candidate.
Disclosure : Initiated tracking position.
1 Like
https://twitter.com/TATAZambiaLtd/status/1663161930234617856/photo/1
Tata selling Force motor vehicles in Zambia.
1 Like
Excellent improvement on Month on Month basis confirming turn around…
April :
Production
Sl. Type of Production No. of units
1 Small Commercial Vehicles (SCV) & Light Commercial Vehicles (LCV) 2,017
2 Utility Vehicles (UV), Sports Utility Vehicles (SUV) & Tractors 304
Total 2,321
2) Sales Domestic
Sl. Type of Production No. of units
1 Small Commercial Vehicles (SCV) & Light Commercial Vehicles (LCV) 1,662
2 Utility Vehicles (UV), Sports Utility Vehicles (SUV) & Tractors 214
Total 1,876
3) Sales Exports
Sl. Type of Production No. of units
1 Small Commercial Vehicles (SCV) & Light Commercial Vehicles (LCV) 164
2 Utility Vehicles (UV), Sports Utility Vehicles (SUV) & Tractors 2
Total 166
May 23
- Production
Sl. Type of Production No. of units
1 Small Commercial Vehicles (SCV) & Light Commercial Vehicles (LCV) 2,350 /////(April : 2017)
2 Utility Vehicles (UV), Sports Utility Vehicles (SUV) & Tractors 478//// (April : 304)
Total 2,828 (April : 2321) - Sales Domestic
Sl. Type of Production No. of units
1 Small Commercial Vehicles (SCV) & Light Commercial Vehicles (LCV) 1,846 ///(April : 1662)
2 Utility Vehicles (UV), Sports Utility Vehicles (SUV) & Tractors 308 //(April 214)
Total 2,154 ////( April :1876) - Sales Exports
Sl. Type of Production No. of units
1 Small Commercial Vehicles (SCV) & Light Commercial Vehicles (LCV) 491 /////(April : 164)
2 Utility Vehicles (UV), Sports Utility Vehicles (SUV) & Tractors 0
Total 491 /////(April :166)

4 Likes
Thanks for the comparison. I had posted about the company on another thread. Buying the pessimism: Trying to catch the bottom - #5 by Lavanya_Tomar
I hope it adds some value
1 Like
Comparison between 2017 and now
| 2017 | As on date | |
|---|---|---|
| DEBT | 200 | 955 |
| FIXED ASSET INCLUDING CWIP | 1130 | 2250 |
| SALES | 3400 | 6000 |
| EBIDTA MARGIN | 9% | 8% |
| WORKING CAPITAL DAYS | 53 | 20 |
| MCAP | 5800 | 2800 |
*Quarterly sales conservatively annualised based on improved monthly performance data
Developments after 2017 :
Gurkha, Urbania, Commissioning of 1000 Cr CAPEX, Tie up with Rolls Royce & Dominant position maintained by Force Traveller
3 Likes
Turnaround is clearly visible from Q4 results & MoM numbers now !!
May month sales for Force are at 8-years high - June has seen MoM growth in 5 out of last 7 years, giving us early signs that Q1 FY24 can be even better.
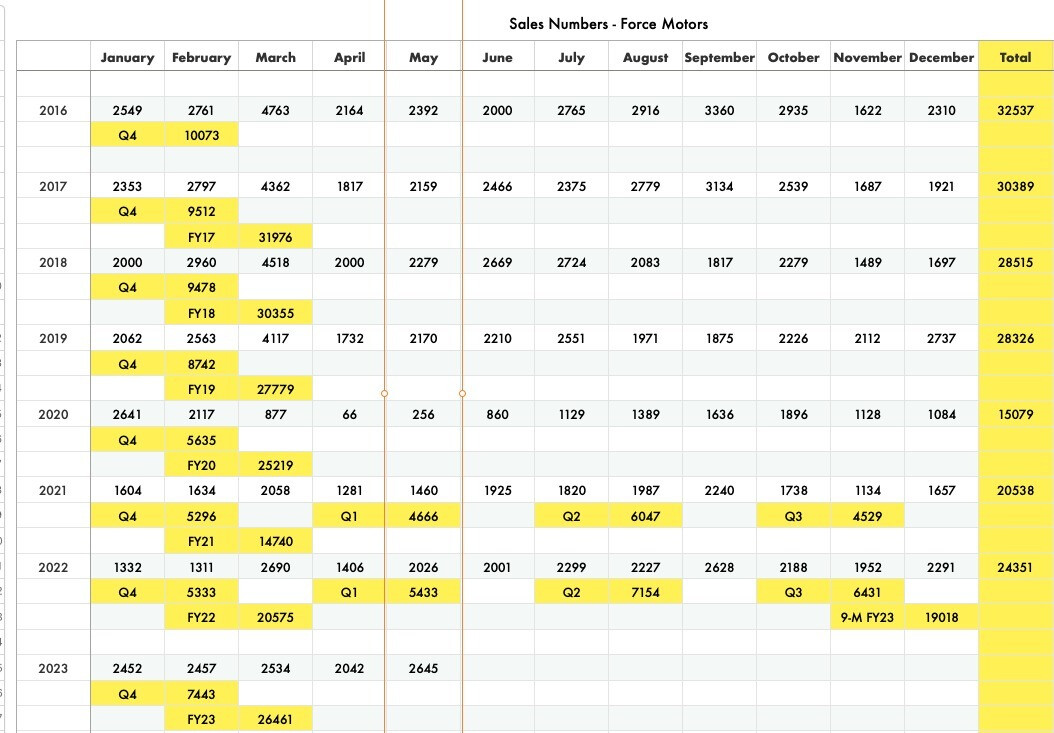
If we look at production data of last 2 months, it seems that operating leverage has kicked in as they have entered into international market (follow their linkedin page for more info).
Launch of Traveller Electric (based on Urbania platform) can further accelerate the pace of turnaround & operating leverage as major capex was on T-1N platform (Urbania & T-1N Electric).
FY23 EBITDA came in-line to my estimates & further improvement should be tracked closely - which can help in rerating.
Disclosure : Invested & waiting for dip ![]()
9 Likes
Major kick for Operating margin improvement is net realization on traveller business. As urbania share in traveller business will grow, margins will improve further. Urbania cost just double the normal traveller.
2 Likes

HIGH TECHNOLOGY AGGREGATE BUSINESS
Force Motors produces high performance and premium quality engines and axles for Mercedes Benz India and BMW-India.
Till date, Force Motors has supplied over 150,000 engines and over 140,000 axles for Mercedes Benz India. Over the years the portfolio has grown to include the front and rear axles, 4 cylinder gasoline and diesel engines, 6 cylinder V-type gasoline and diesel engines, powering the complete range of Cars and SUVs made by Mercedes Benz India. In 2015, BMW assigned Force Motors to produce and test the engines for all cars and SUVs to be made in India. Force Motors set up a dedicated state of the art facility in Chennai close to the BMW factory to produce and supply engines for their 3, 5, 7, GT series cars and X1, X3, X5, X7 series SUVs made in India. Till date Force Motors has supplied over 70,000 engines to BMW.
MANUFACTURING
The famous Mercedes OM-616 engine made under license has been further developed with Force Motors’ own R & D to meet the current emission norms in the domestic as well as international markets.
This association helped to develop a large and modern range of Common Rail Direct injection, turbocharged intercooled automotive and agricultural tractor engines. The critical components such as the complex cylinder blocks and high precision cylinder heads etc. are made in Force Motors’ own foundry. These are machined using elaborate and modern mass production methods - both transfer lines and Computer Numerical Controlled (CNC) flexible machining systems. Mercedes’s standard precision and durability is built into these reliable and modern engines.
1 Like
From where we can get monthly sales data for Auto Companies.
Sales/Production data for June 2023
Production
Sl. Type of Production No. of units
1 Small Commercial Vehicles (SCV) & Light Commercial Vehicles (LCV) 1,909 (May 2017)
2 Utility Vehicles (UV), Sports Utility Vehicles (SUV) & Tractors 485 (May 304)
Total 2,394 (May 2321)
Sales Domestic
Sl. Type of Production No. of units
1 Small Commercial Vehicles (SCV) & Light Commercial Vehicles (LCV) 1,783 (May 1846)
2 Utility Vehicles (UV), Sports Utility Vehicles (SUV) & Tractors 648 (May 308)
Total 2,431 (May 2154)
3) Sales Exports
Sl. Type of Production No. of units
1 Small Commercial Vehicles (SCV) & Light Commercial Vehicles (LCV) 435 (May 491)
2 Utility Vehicles (UV), Sports Utility Vehicles (SUV) & Tractors 5
Total 440 (May 491)
Total Sales : 2871 (May 2645)
Monthly growth 226 (8%)
Impressive sales growth of more than 100% in Utility Vehicles (UV), Sports Utility Vehicles (SUV) & Tractor segment. Overall momentum is sustaining.
9 Likes