Let's start capturing FII and DII buy/sell activities on a regular basis, here.
Here's a graphic that is telling!
The foreign investors are busy investing in India (see Table below) and have purchased USD 12.9 billion worth of Indian stocks since the start of the year. Domestic mutual funds have sold USD 3.4 billion in the same timeframe!
2003-2010 FII/DII activity Summary
Period
Net foreign Activity (US$ m)
Net Local Fund Activity (US$ m)
Total (US$ m)
Change in BSE-30 TRI in that Period (% USD)
CY 2003
6,628
88
6,716
86.3%
CY 2004
8,669
-253
8,416
23.1%
CY 2005
10,707
3,049
13,756
42.2%
CY 2006
8,106
3,413
11,519
53.3%
CY 2007
17,655
3,222
20,877
68.5%
CY 2008
-11,974
2,501
-9,473
-60.7%
CY 2009
17,458
-1,132
16,326
89.7%
Cumulative
57,249
10,888
68,137
528.1%
August 2010
2,514
-682
1,832
-0.7%
YTD 2010
12,945
-3,402
9,543
3.0%
May 5, 2010 Greek Day
-310
4
-306
-1.7%
Source: Equitymaster, Sebi.gov.in
But the point is that the money flows of the Foreign Institutional Investor (FII) will determine where share prices head in the near term. The Indian money is on the sidelines.
I am glad someone pointed this out…markets are scaling new highs without any fundamental changes…most stocks are getting overvalued…with Q2 results round the corner, most companies are likely to beat expectations with a lot of favorable signals, this will probably create yet another spike…
Here is the FII fund-flow for Oct till Oct 11. Will be interesting to see the quantum of flows on Oct 12 and 13th might have seen the highest flows in the month?
Yes. Will be good to see today 13 Oct FII buy/sell data. Interestingly domestic mutual funds continue to be consistent sellers in this market. I found the following data from SEBI website
Thanks for the link and the domestic MF data. Exploring that link I landed up at the daily updated (incl Oct 13th!) FII buy/sell data by SEBI. here goes
If we look at this data, FIIs made a net purchase of only ~Rs. 700 Cr today on 13th Oct. Today’s is the lowest net purchase figure in Oct 2010. And yet, the markets have risen by almost 500 points today!
Does this mean domestic mutual funds are finally getting into the act??
I found out that the SEBI data is based on previous days transactions. The custodians submit the FII transaction data of 13 Oct to SEBI a day later on the 14th, but SEBI for some strange reason tags the data as of the day of submission.
So effectively what you see as 14th Oct data is for 13th Oct. This explains the 500 points rise on 13th -as FIIS bought net Rs. 3100 crores that day (not 700 Cr which pertained to Oct 12th). Teh equitymaster table below makes it clear.
My big question is where exactly in the world are these smart money investors going to get returns that beat India’s in the near to medium term? To say that China has issues (tech, mortgage boycotts, inane zero Covid policies) would be an understatement. The US and EU region are not doing so well. Japan has its share of struggles too.
The first mistake that these FIIs make is bucketing all emerging markets (not including China) together. So whether it’s India, Brazil or the Philippines, a slight crisis in the world, or a taper tantrum makes them want to dump all their EM assets and “fly to safety.”
Their plan was, as I understand it, was to sell ₹ assets, and park their money in T-bills or something similar. Then when the ₹ depreciates a good 10-20%, they would come back in and make big purchases at a huge discount.
I firmly believe that this expected depreciation will not materialize this time around. India is the only major economy in the world that is a bright spot right now. The currency has not depreciated as much as it has in the past during periods of global volatility, and domestic investors have acted as a huge stabilizing force in the equity markets.
If we want to know the FII/DII allocation trend for a particular stock, how frequently can we get that data?
Means, do we get that data only once per quarter or, is their any way we can know it on a monthly basis?
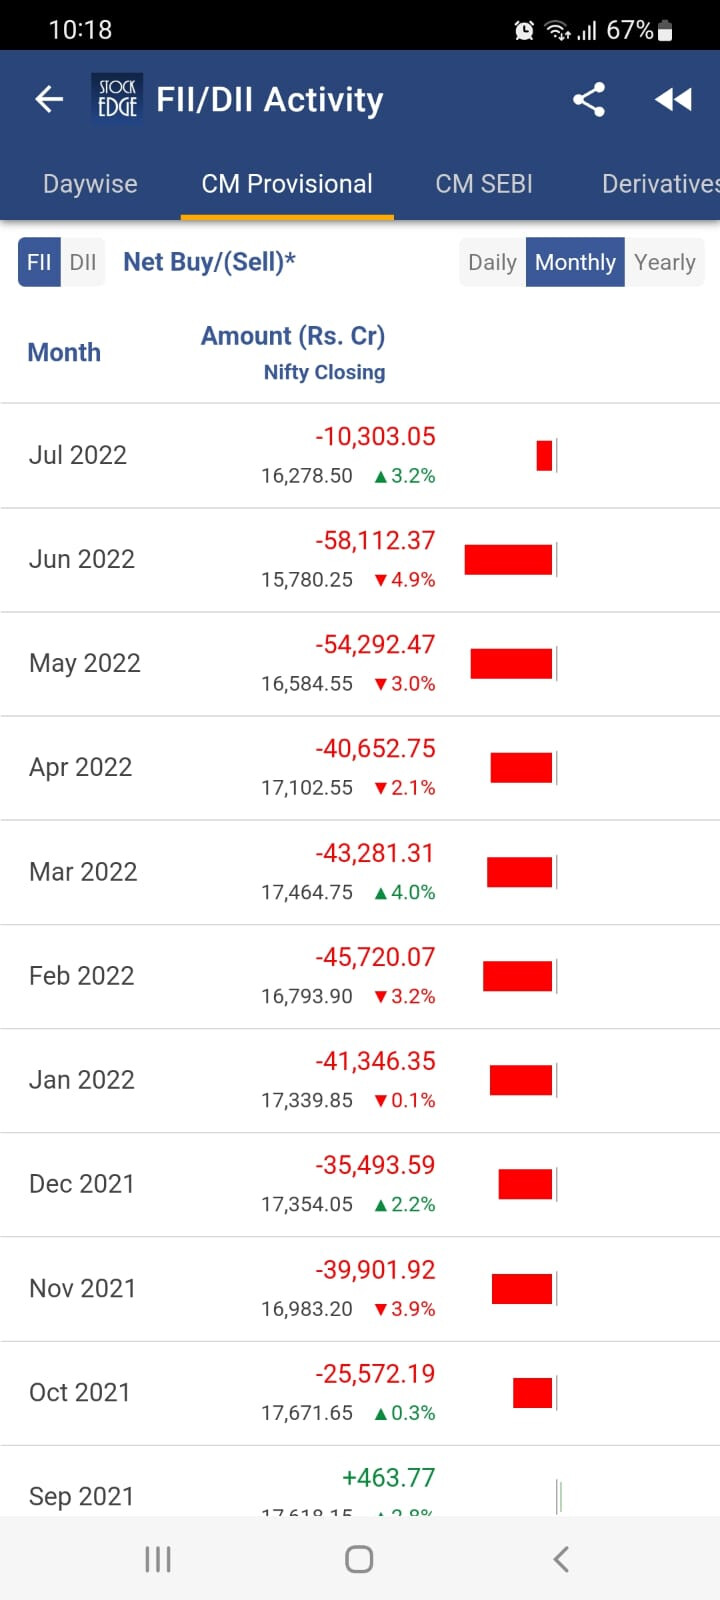
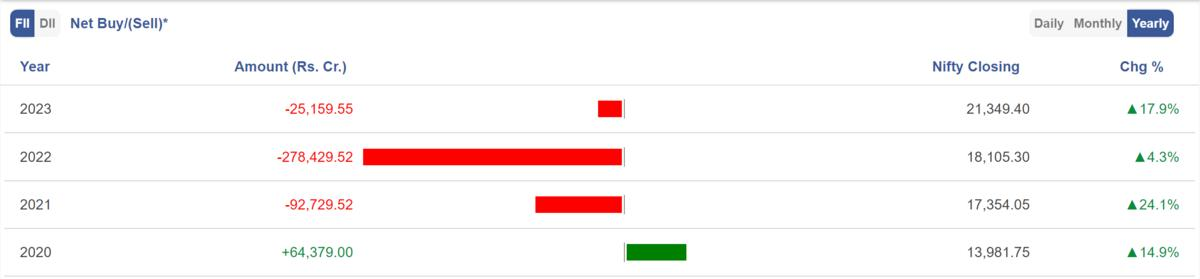
FII definitely has no control over the Indian Stock Markets now. (FII sold in CY 2021-2022 still Nifty went from 14k to 18k & in CY2023 still FII are net sellers)
The money that was taken out in CY 2021-2022-2023 will that all come back in 2024???
What if the 64K Crore they invested in Indian markets in 2020, turned into 3L crore, and now they were just booking profits in 2022-2023.
Also if you see the returns of 2022, it is only 4.2% which is less than FD returns. So yes they definitely do have control on the Indian market.
DII is mostly Mutual funds, Insurance companies and NPS, which have to deploy the funds in Equity segment and has no other option than “Invest in India”.