Everest Kanto Cylinders Ltd. (EKC) is India’s largest manufacturer of high pressure gas cylinders with a market share in excess of 50%. It manufacturers all types of cylinders – CNG, Industrial, Jumbo & Composite - & has a capacity of One million cylinders annually with fungible production lines of more than 200 SKU’s across different ranges. It has global scale plants in located in India, UAE & the USA.
With the Govt.'s thrust on cleaner fuel to help mitigate environmental concerns, CNG is being aggressively promoted by rapidly expanding its network in different states. The current CNG infrastructure is present only in a few states including Delhi & Maharashtra. This is likely to increase to about 10 states in the foreseeable future, before ultimately covering the entire country. With proven & accepted CNG technology, once the CNG infrastructure is in pace, the demand growth for cylinders is more than likely to explode. Leading gas infrastructure Co.’s are laying out aggressive expansion of CNG pumps & OEMs are expanding its offerings of CNG fueled vehicles to its customers. EKC is currently operating at 90% capacity in India & to meet this demand, it is going in for a brown field expansion at both its plants in Tarapur & Kandla at a capex of 35 crs that will enable the Co. to increase capacity by about 40% (400,000 cylinders).
EKC has been actively reducing debt over the last many quarters after divesting its subsidiaries in China & Thailand. It hopes to become debt free by next year. Its subsidiaries running plants in Dubai & the US are also showing decent growth & are already contributing to the numbers. The Co. is planning to set up a plant in Hungry to cater to the burgeoning European demand.
The business is in a sweet spot, as is visible in the numbers over the last few quarters. For the half year ended September ’21, the consolidated Sales have come in at 756 crs with PAT of about 139 crs, after providing for taxes of 60 crs (@30%). EKC should comfortably do profits of about 280 crs for the full year. The current price of about Rs. 150, makes the market cap under 1700 crs making valuations rather attractive. EKC is extremely efficient in utilising its resources. What makes the story even more compelling are the return ratios. For the full year 21-22, its RoCE is likely to be in excess of 40%! Clearly it’s a story waiting to be re-discovered!
September Qtr
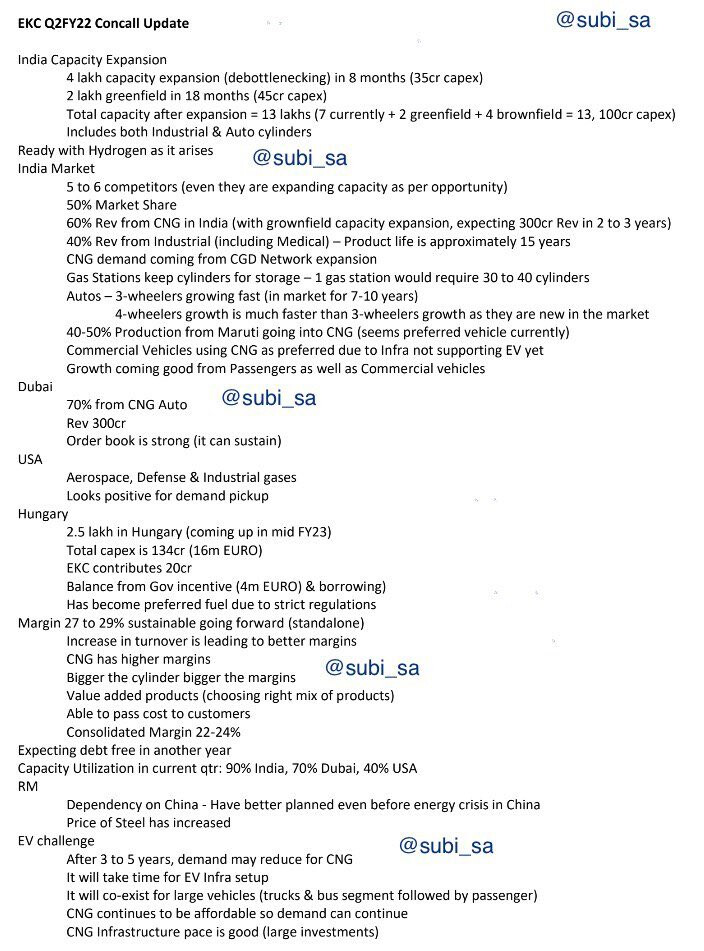
Investor Presentation post Q2
Concerns: It’s a story waiting to be re-discovered. Therein lies a concern. Most investors are aware of EKC & it is not an unknown Co. with a somewhat chequered past. This perhaps also explains the current valuations. Companies too learn from experience! Ultimately, the numbers will determine the market cap.
On June 14, 2018 a news item appeared on CNBC TV18 quoting “Lenders move towards conducting forensic audit into books of Everest Kanto after allegations of fraud/siphoning of fund levelled by Ex-CFO, whistle-blower”.
Queried by the exchange, EKC responded that it had not received any communication from any lender with respect to forensic audit. It is relevant to note that more than three years have passed since the news item & the Co. has been in recovery mode in this period with no action taken by any regulatory authorities like SEBI or the stock exchanges.
Annual Report for 20-21
10 year numbers (Taken from Screener.in), for those statistically interested.
Consolidated Figures in Rs. Crores / View Standalone
GEOGRAPHICAL SEGMENTS
| Mar 2010 | Mar 2011 | Mar 2012 | Mar 2013 | Mar 2014 | Mar 2015 | Mar 2016 | Mar 2017 | Mar 2018 | Mar 2019 | Mar 2020 | Mar 2021 | TTM | |
|---|---|---|---|---|---|---|---|---|---|---|---|---|---|
| Sales + | 650 | 779 | 677 | 543 | 491 | 472 | 506 | 564 | 539 | 702 | 761 | 949 | 1,288 |
| Expenses + | 591 | 639 | 605 | 571 | 510 | 466 | 500 | 512 | 463 | 623 | 667 | 784 | 999 |
| Operating Profit | 59 | 141 | 72 | -28 | -19 | 6 | 6 | 52 | 76 | 79 | 93 | 165 | 288 |
| OPM % | 9% | 18% | 11% | -5% | -4% | 1% | 1% | 9% | 14% | 11% | 12% | 17% | 22% |
| Other Income | 60 | 9 | 8 | 16 | 7 | 25 | -2 | 107 | 21 | 0 | 1 | 45 | 49 |
| Interest | 14 | 11 | 21 | 41 | 58 | 60 | 55 | 47 | 36 | 38 | 38 | 28 | 17 |
| Depreciation | 57 | 64 | 67 | 70 | 68 | 71 | 72 | 34 | 32 | 30 | 43 | 35 | 35 |
| Profit before tax | 48 | 75 | -8 | -123 | -138 | -98 | -123 | 78 | 28 | 12 | 12 | 146 | 285 |
| Tax % | 13% | 6% | 155% | -7% | -0% | 1% | -1% | 0% | 16% | -405% | 83% | 38% | |
| Net Profit | 42 | 71 | 4 | -132 | -138 | -98 | -124 | 78 | 23 | 59 | 3 | 90 | 195 |
| EPS in Rs | 4.10 | 6.58 | 0.40 | -12.30 | -12.89 | -9.12 | -11.06 | 6.98 | 2.08 | 5.23 | 0.27 | 8.02 | 17.38 |
| Dividend Payout % | 29% | 23% | 62% | -2% | 0% | 0% | 0% | 0% | 0% | 0% | 0% | 4% |
Disc: Invested