What is the cost difference that they are getting thru local outsourcing than imports from Taiwan.
P.S- The company needs to improve their disclosures and investor services
What is the cost difference that they are getting thru local outsourcing than imports from Taiwan.
P.S- The company needs to improve their disclosures and investor services
I feel, we need to find a China Free Company, that even Chinese companies can’t come into. Might be compare Havells and Polycab. No Chinese companies can come into their way.
As it’s said:
Data is the New Oil.
If its true, then the companies which enter into this segment early, will benefit the most.
D-Link seems to be doing the same.
Prepared some notes, have a look.
D-Link India Ltd.docx (5.9 MB)
PnL Statement: (last 9 years)
· Low sales growth except for 2019/22/23
· Low OPM except for 2023/24
· Other income high from 2020
· Low NPM except for 2023/24
· High capex 2020/23
· Low growth of Net Fixed Assets
· Fluctuating receivable days
· Fluctuating Inventory Turnover
· Low RoE except for 2023/24
· Low RoCE except for 2023/24
· High Dividend payout
Highly Competitive Indian Market. Jio, Airtel & others providing their own router.
The revenue & profitability improvement in the year2023 is because of the below factor. Although when we see the year2024 revenue/profitability, there is not much further improvement or progress.
Looks like a highly commoditized market with low profitability margins.
Positive-
D-Link (India) Limited is strongly focusing on local products as part of its ‘Make in India’ initiative. “Make in India,” and localization of products are two important initiatives of the Indian government that are closely linked. D-Link (India) has been granted exclusive rights/ license by the parent company to use the D-Link trademark for such
locally manufactured products. The Company had made strategic decisions on manufacturing certain products locally through third-party or contract manufacturing with its own brand names, under its own proprietary designs, quality control and supervision.
The Company has made noteworthy progress in this direction and has entered into arrangements with local manufacturers.
Great work. The notes were really helpful. Wanted to know does they able to gain some orders from data center companies in India?
Dlink Q2 Numbers
Rev at 336cr vs 308cr,
Q1 at 346cr PBT at 35cr vs 31cr,
Q1 at 35cr PAT at 27cr vs 24cr
OCF at 5cr vs 42cr
Here’s the data organized into a table format for clarity:
| Quarterly Results | Sep 2021 | Dec 2021 | Mar 2022 | Jun 2022 | Sep 2022 | Dec 2022 | Mar 2023 | Jun 2023 | Sep 2023 | Dec 2023 | Mar 2024 | Jun 2024 | Sep 2024 |
|---|---|---|---|---|---|---|---|---|---|---|---|---|---|
| Standalone Figures in Rs. Crores | View Consolidated | ||||||||||||
| Revenue | 241 | 235 | 269 | 293 | 291 | 278 | 309 | 298 | 306 | 292 | 332 | 344 | 335 |
| Net Revenue | 225 | 223 | 254 | 272 | 261 | 242 | 283 | 271 | 276 | 263 | 301 | 316 | 303 |
| Operating Profit | 16 | 11 | 15 | 21 | 30 | 35 | 26 | 27 | 30 | 28 | 31 | 28 | 33 |
| OPM % | 7% | 5% | 6% | 7% | 10% | 13% | 9% | 9% | 10% | 10% | 9% | 8% | 10% |
| Other Income | 1 | 2 | 2 | 1 | 1 | 2 | 3 | 3 | 3 | 3 | 4 | 5 | 4 |
| Interest | 0 | 0 | 0 | 0 | 0 | 0 | 1 | 0 | 0 | 0 | 0 | 0 | 0 |
| Depreciation | 1 | 1 | 1 | 1 | 1 | 1 | 1 | 1 | 2 | 2 | 2 | 2 | 2 |
| Profit before tax | 16 | 12 | 16 | 21 | 30 | 36 | 27 | 28 | 31 | 30 | 33 | 31 | 35 |
| Tax % | 26% | 26% | 26% | 26% | 25% | 25% | 27% | 25% | 26% | 26% | 25% | 26% | 24% |
| Net Profit | 12 | 9 | 12 | 16 | 22 | 27 | 20 | 21 | 23 | 22 | 25 | 23 | 26 |
| EPS in Rs | 3.37 | 2.48 | 3.28 | 4.40 | 6.24 | 7.56 | 5.56 | 5.84 | 6.52 | 6.28 | 6.93 | 6.57 | 7.43 |
Is there a potential upside for Dlink here ?
Dlink has nothing to do with data centre business
Hi I am trying to figure out if they will see any additional revenue because of data center tailwind, the market is certainly not pricing in any high growth for them. Can you give your reasons as to why you feel they are not in data center business ? Any scuttlebutt or industry insight will be highly appreciated

@theequitymindset In 2024 AGM, CEO said they don’t have all the products to cater for the data centre market. They have just few cabling products, may be some switches I guess.
They said we are a Home & SMB focused company.
I will attach 2023 & 2024’s AGM notes.
D link India AGM notes.pdf (126.1 KB)
If anybody knows the issue btw D link India & Smart link (Earlier part of D link India) during 2008, please share it here.
Hi Shankar,
Did you get a chance to attend the AGM this year.
Thanks
Anyone has any idea why DLINK is not getting higher valuations ?
At CMP of 430, Mkt cap is 1500 odd Cr and Dividends of approx 20-23rs yearly make it a 5% yield stock.
I agree growth has been a bit slow but profits seem to be consolidating. Co has a good business model which can scale up without capex (basically distribution). I know valuations are low since there isnt a lot of value addition but there are great cash flows and also, structured cabling and routers are an integral part of Data Center supply chain.
Overall, considering the Pros and Cons, I am surprised why DLINK is trading at these levels.
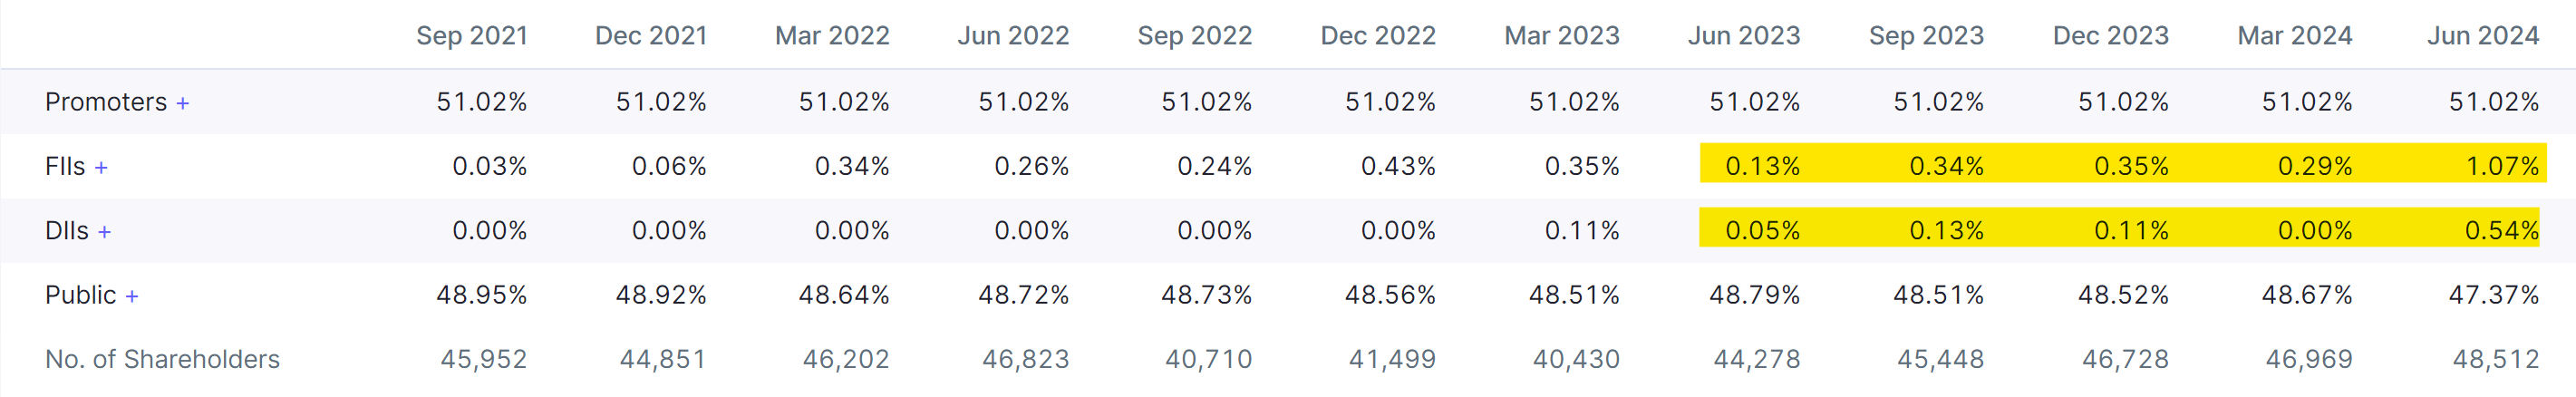
One of the reasons might be because Mukesh Lulla (Director) is dumping shares and maybe wants a total exit. He held 7% + and now 5.7%. Seems like all this will need to be absorbed if markets wants to re rate this.
@y21 i have been researching the company after coming across it in a screener.
On the face of it company looks good(dividend yield is like icing on the cake) but given the nature of the business(mostly trading), with still a lot of imports from parent (forex volatility what with the rupee depreciating), royalty payment to parent company and possibility of tech obsolescence this will always trade within a lower range. Only rerating will be via significant earnings growth over long-term trendline.
I was going through parent company and saw it’s been making losses for multiple years in an environment were network demand has been booming.
I tried contacting the investor relations team to try and get a breakup of their sales across products but didn’t get any response(seems to be a sad trend among many companies ![]() )
)
Also Mr Lulla has resigned from the company as per Q2 results disclosure.
They have increased share of local products via third party suppliers using their branding which is good to de-risk supply chain and forex issues.
The main issue is there is no moat in this business and brand name can only take you so far. Also lots of other companies are getting into the field given the new opportunities leading to possible price wars and margin pressure.
Would like to hear counter-views from those who are already invested or tracking this
They have recently been more active on social media and you can track some intresting interviews on their YouTube channel here: https://youtube.com/@dlinknews?si=sC3V03zSyRVv3ocb
Disclosure: No invested but tracking
D-Link is mostly into passive products ( structured cables & switches), which is a commoditised product. Though they have a good market share in this due to their old distribution network of Cisco during 2000, new players like TP link who were actively into router are entering this market.
Also, US Networking players like Netgear are setting up their own manufacturing plants in India which might pressurize the margins of DLink India.
High commoditised product concentration cannot be good in the long term. Their new product addition like security cameras have not meaningfully scaled up.
D-Link have a good government contracts like Rastriya Chemicals & Fertilizers and Bhabha Atomic Research Centre buy passive products such as cabling and switches, citing lesser cost. Many have been long-term clients for 10–15 years, making switching less likely. Large projects such as Mumbai Metro, Delhi Metro, and Bangalore Metro also use some of the D-Link passive products.
Last 10 year strory : Gained Enterprise market, lost consumer market to players like TPLink, Direct service providers like Jio, Airtel
In 2018, 10-15% of revenue came from Enterprise now it reached 30%, registering around 30% CAGR.”
Further 10-15% correction can be a good entry & one can expect a decent 13-14% CAGR including dividends
DISCLAIMER: Worked on the company, but not invested