
For cyclicals, the bet is on mean reversion. So plotting a fundamental variable which is mean reverting in nature solves the problem (in most cases). Here is the P/B value charts for NALCO and Sobha over the last 10 years.
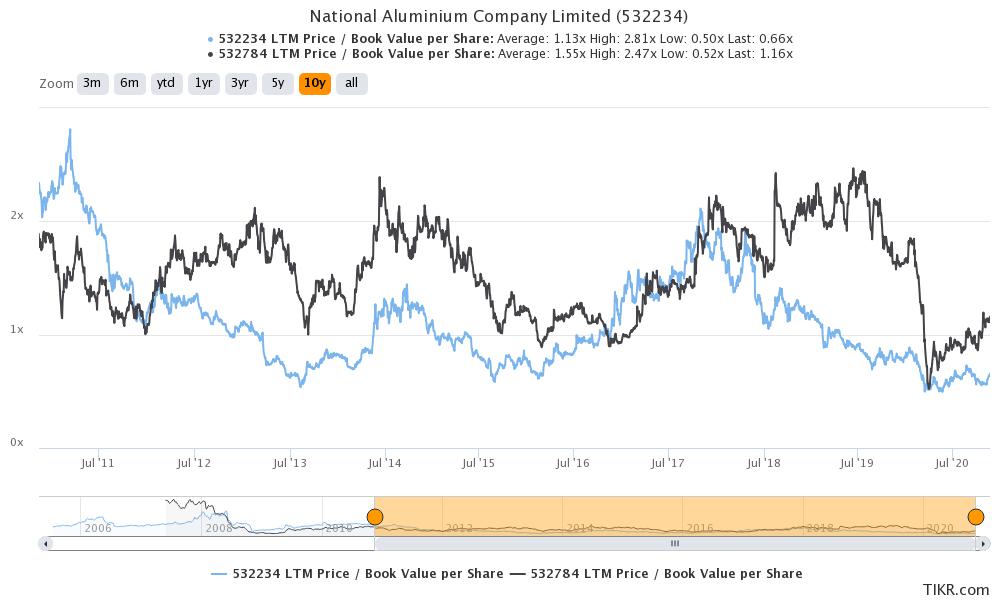
For nalco, a clear buy is ~0.6x P/B and sell is ~2x P/B. For Sobha, buy is below 1x P/B and sell is at 2x P/B. The length between this valuation gap determines the IRR. What I mean is if it takes 5-years to go from 1x to 2x, IRR is 15% from re-rating + growth in book value. If the same takes 10-years, then IRR is 7% from re-rating + growth in book value. No real rocket science in buy/sell decisions. The only thing that matters is if the company has the balance sheet strength to survive the downtrend, everything else like length of cycle, amplitude, etc. is mostly luck.
NOTE: WHAT WE ARE DOING HERE IS FITTING OLD DATA AND EXPECTING FUTURE TO TURN OUT LIKE THE PAST WHICH CAN LEAD TO OVERFITTING!
Over long periods of time, valuations are very cyclical, here are the lower and upper P/B bounds for Markel over the last 3.5 decades.

I can provide these kinds of charts for a lot of companies (Berkshire, Schlumberger, etc.) which have operations since the last 3-4 decades. The basic summary is if we zoom out and plot some fundamental variable (which is mean-reverting) over long periods of time, valuation work is done. This is what old value folks like Tweedy Browne have been doing for the last 5-decades.