
Mr. Viswanathan Subramanyan, Vice
President, Information Technology, a
SMP of the company, has resigned due
to personal reasons.
3 Likes
august ppt presentation 2023
3 Likes
Very strong guidance. Company targeting for 40-50% growth in revenues in FY24 with stable margins. Increase in revenues targeted through new product launches and higher market share from current products.
2 Likes
provided there is a good cash flow and no increases in trade receivables
3 Likes
Seems something amiss here. Q1 24 was just 13 %. I don’t think Q2 is going to be any different looking at their Q1 Conference call. Some uptick expected in Q3 and Q4. But 40 % in FY 24 seems almost unpractical. They were reluctant to give any guidance during conference call.
I don’t think this guidance was there in investor presentation when published in August 23.
Any body knows more about it?. Likely to get cleared in Q2 con call.
1 Like
I think that’s only for the subsidiary caplin steriles and not the entire company.
3 Likes
Promising result by Caplin Point for the quarter ended
September 30,2023
https://www.bseindia.com/xml-data/corpfiling/AttachLive/e4d4a653-51f8-4c57-861b-9fb79c97da26.pdf
Year 2023-2025 will be interesting as Caplin Point has allocated an overall Capex budget of approximately ₹600-650 Crores for the investment projects (most of which are nearing completion) to expand existing capacities, widen its product portfolio and backward integrate the majority of the products. All of the planned Capex is funded through internal accruals only.
6 Likes
Strong statement on presentation :
Commenting on the performance, Mr. C.C. Paarthipan, Chairman said:
“We have multiple levers of high quality and consistent growth at Caplin, with the major one being our growth in existing markets in Latin America. This is evidenced by the fact that Q2 FY24 revenue of Rs.430 Cr and PAT of Rs.116 Cr are higher than the FY17 full year revenue (Rs.412 Cr) and PAT (Rs.96 Cr) respectively. Our US business also continues this pattern, as our H1FY24 revenue is higher than
our FY22 full year revenue. With our sharp focus towards enhancing our presence in the larger markets such as US, Mexico and Chile, we expect the next few years to be crucial and exciting for the company.Our initiatives into backward integration (API) and forward integration (front end presence) will adequately support the company’s prospects for top and bottom line growth, with stable cashflows.
We remain steadfast in our commitment to driving sustainable growth with benchmark cashflows and robust bottom line.
8 Likes
Still the working capital cycle keeps on worsening due to rise in inventory and receivables. Although none of the receivables have been mentioned as doubtful as of yet, but we need to keep track and find the reason behind this if they are rising at such a high pace
4 Likes
They have addressed this issue on concall. Yes, Receivable is increasing from 97 days to 103 days, but Gross margin is increasing by 5%, which is reflated on margin side also.
Q3 and Capex development, to be watching carefully.
3 Likes
Still, in the first half of the year itself the receivables have gone up by 65 crores, whereas the inventory went up by 49 crores.
1 Like
Capex budget: 600 cr
To be completed by Q4 FY 25. That is March 25.
By Jan 2026 everything is operationalized.
Total net block = 300 (before) + 600 = 900 Cr
Latest net fixed asset turns = 5.25
Total revenue generated by Jan 2026= 900*5.25= 4725 cr ( current 1500 cr).( 3.15x~3x)
Net margin latest = 25%
Net profit Jan 2026= 1181 Cr. (Current= 400 Cr)( 2.9x~3x)
CAGR for 4 (conservative estimate) yrs after tripled profits= 114/4 = 28.5 % CAGR approx
Is this a fair way to estimate future revenue & earnings potential? If it does work out then, would it be fair to also estimate that the share price will at least triple if things go as planned and PE remains stable or improves?
2 Likes
Another good quarter from the co, sales grew by 14% and EPS by 25%. They are in heavy investment mode, which will continue for the next few quarters. Concall notes below.
FY24Q2
- Large reduction in purchase of traded goods leading to better gross margins. However, guides for lower gross margins going forward
- Profit share for Caplin Steriles: 30% with 70% coming from product supplies. Made 12.5 cr. EBITDA in H1 as they are expensing out all R&D and filing expenses. Core business has same margins as standalone (if R&D/filing expenses are removed)
- LATAM revenue breakup: Wholesalers 55%, Direct to Retail 25%, Institutional 20%
- Mexico expansion: want to replicate LATAM model where they sell via smaller distributors. Meaningful scaleup will require atleast 2 years and 100 products
- Tied up with third party manufacturers (2 Indian + 1 Chinese) for supplying penicillin and cephalosporin range of products in Mexico
- Plan to launch 15 own-label products in US in next 1 year
- Niche products in USA: filed 3 Ready-To-Use Bag products, filing Suspension Injectables, Emulsion Injectables, Emulsion Ophthalmic and Plastic Vial injections
- Injectable facility will cater to non-US market as well, filing completed for multiple products
- Planned capex: 600-650 cr. (more than half has already been spent)
- High speed vial filling line commercialized (will be replacing other line as the new Bosch line is 2-2.5x faster)
Disclosure: Invested (position size here, no transactions in last-30 days)
10 Likes
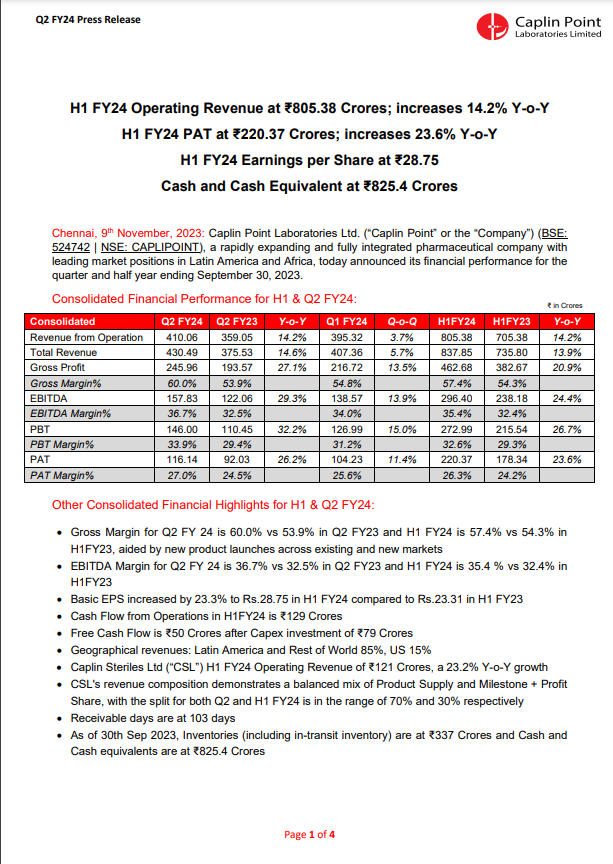
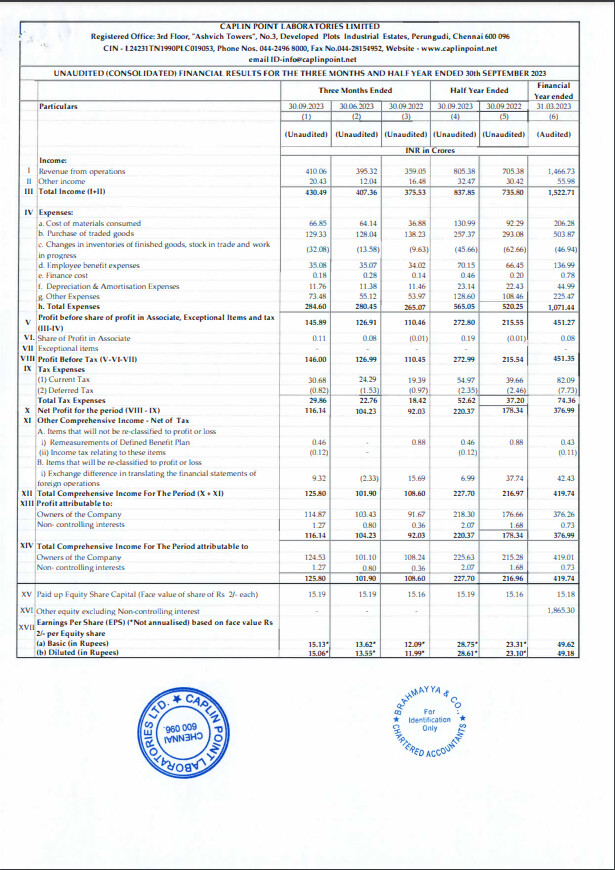


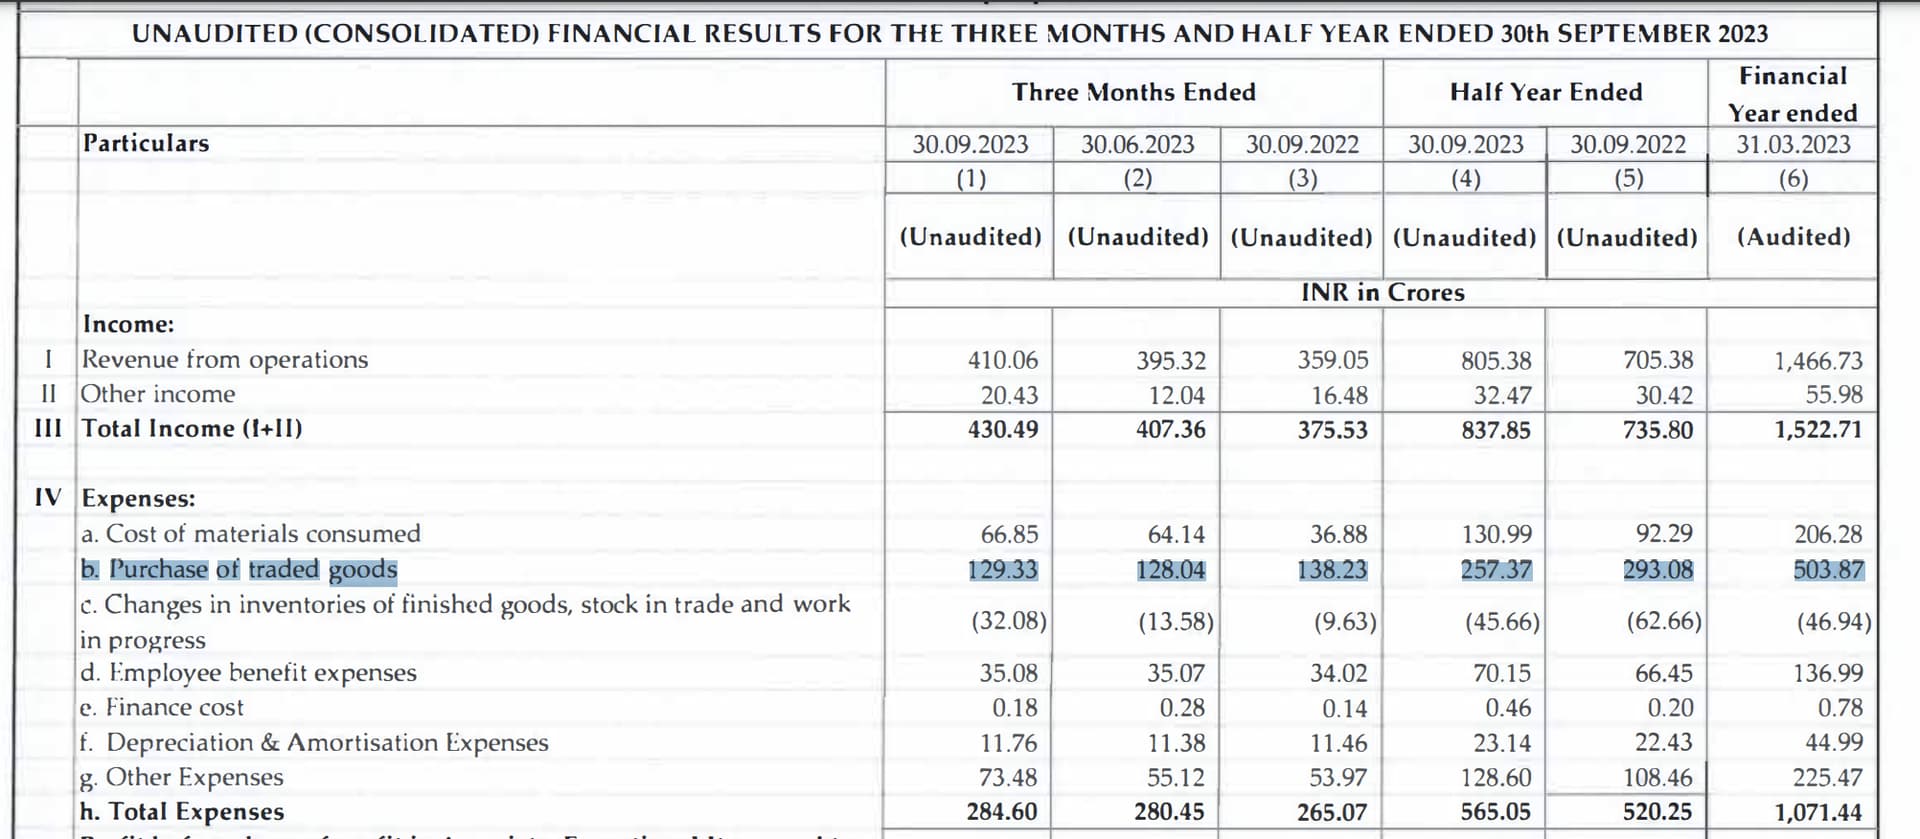
Financial Performance (H1 FY24):
- Operating Revenue: The operating revenue for H1 FY24 reached ₹805.38 Crores, showing a substantial increase of 14.2% compared to the same period last year.
- Profit After Tax (PAT): The PAT for H1 FY24 stood at ₹220.37 Crores, demonstrating a notable year-on-year increase of 23.6%.
- Earnings per Share: The company achieved Earnings per Share (EPS) of ₹28.75.
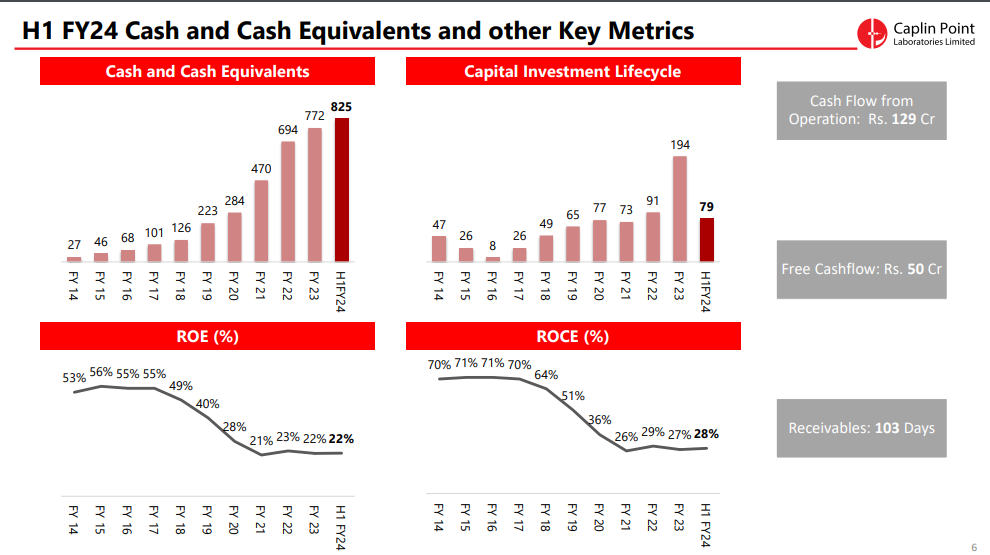
- Cash and Cash Equivalents: Caplin Point maintained a strong financial position with ₹825.4 Crores in cash and cash equivalents.
Financial Highlights (H1 & Q2 FY24):
- Gross Margin: The gross margin improved to 60.0% in Q2 FY24 compared to 53.9% in Q2 FY23. For H1 FY24, the gross margin was 57.4%, up from 54.3% in H1 FY23. This improvement was attributed to new product launches across existing and new markets.
- EBITDA Margin: EBITDA margin increased to 36.7% in Q2 FY24 from 32.5% in Q2 FY23. For H1 FY24, it was 35.4%, up from 32.4% in H1 FY23.
- Basic EPS: The Basic EPS increased by 23.3% to ₹28.75 in H1 FY24 compared to ₹23.31 in H1 FY23.
- Cash Flow: The company reported ₹129 Crores in cash flow from operations for H1 FY24.
- Free Cash Flow: After capital expenditure (Capex) investments of ₹79 Crores, the free cash flow was ₹50 Crores.
- Revenue Segments: Latin America and Rest of the World contributed to 85% of the geographical revenues, while the US accounted for 15%.
- Caplin Steriles Ltd (CSL): CSL achieved an operating revenue of ₹121 Crores in H1 FY24, representing a substantial 23.2% year-on-year growth.
- Receivable Days: The company reported receivable days at 103 days.
- Inventories: As of September 30, 2023, the company’s inventories, including in-transit inventory, were at ₹337 Crores.
Business Highlights (H1 & Q2 FY24):
- Emerging Markets: Caplin Point’s unique end-to-end business model in Latin America continues to drive consistent growth in both top-line and bottom-line results. The company’s expansion into branded generics and new product launches in various markets have been key drivers of growth.
- Supply Expansion: The company has started to supply major orders for specialty products in Latin America, serviced using contract manufacturing organizations (CMOs). It plans to transition to its high-potency manufacturing site in the near future.
- API Development: Caplin Point has successfully developed over 80 active pharmaceutical ingredients (APIs) at research and development (R&D) scale, ready for scaling up once the API units become operational.
- Third-Party Manufacturers: The company has partnered with existing and new third-party manufacturers with regulatory approvals to penetrate the key Mexico market, particularly in areas like Penicillin and Cephalosporin range of products.
- US & Regulated Markets: Caplin Steriles USA Inc. was established in Hamilton, New Jersey, and is in the process of obtaining licensing for all 50 states. The company plans to launch over 15 own-label products in the US within the first 12 months of incorporation.
- Product Expansion: The company commercialized its high-speed vial filling line, which is expected to boost revenues in the coming quarters. Caplin Point has filed various niche products with the FDA, including Ready-To-Use Bag products and Emulsion injections. It has further products planned for the coming months, including Suspension Injectables, Emulsion Injectables, Emulsion Ophthalmic, and Plastic Vial injections.
5 Likes
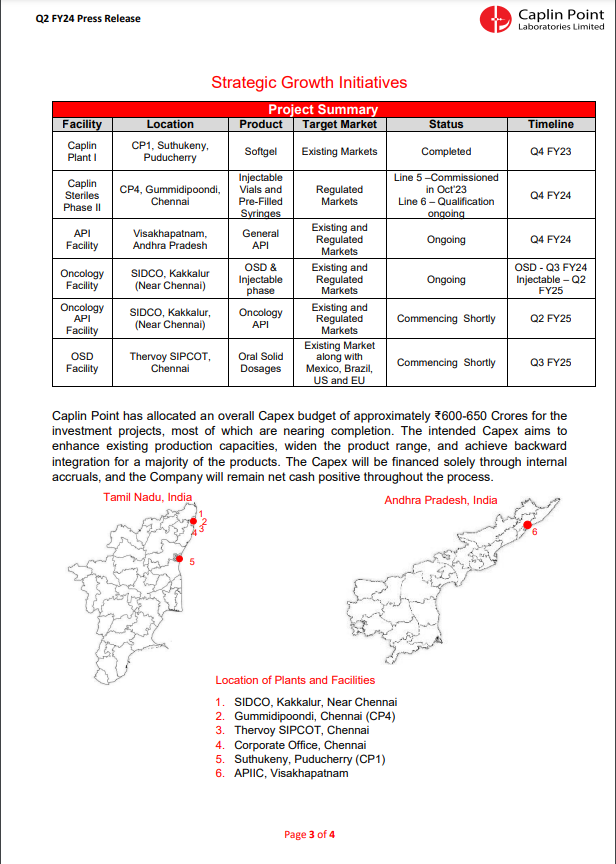

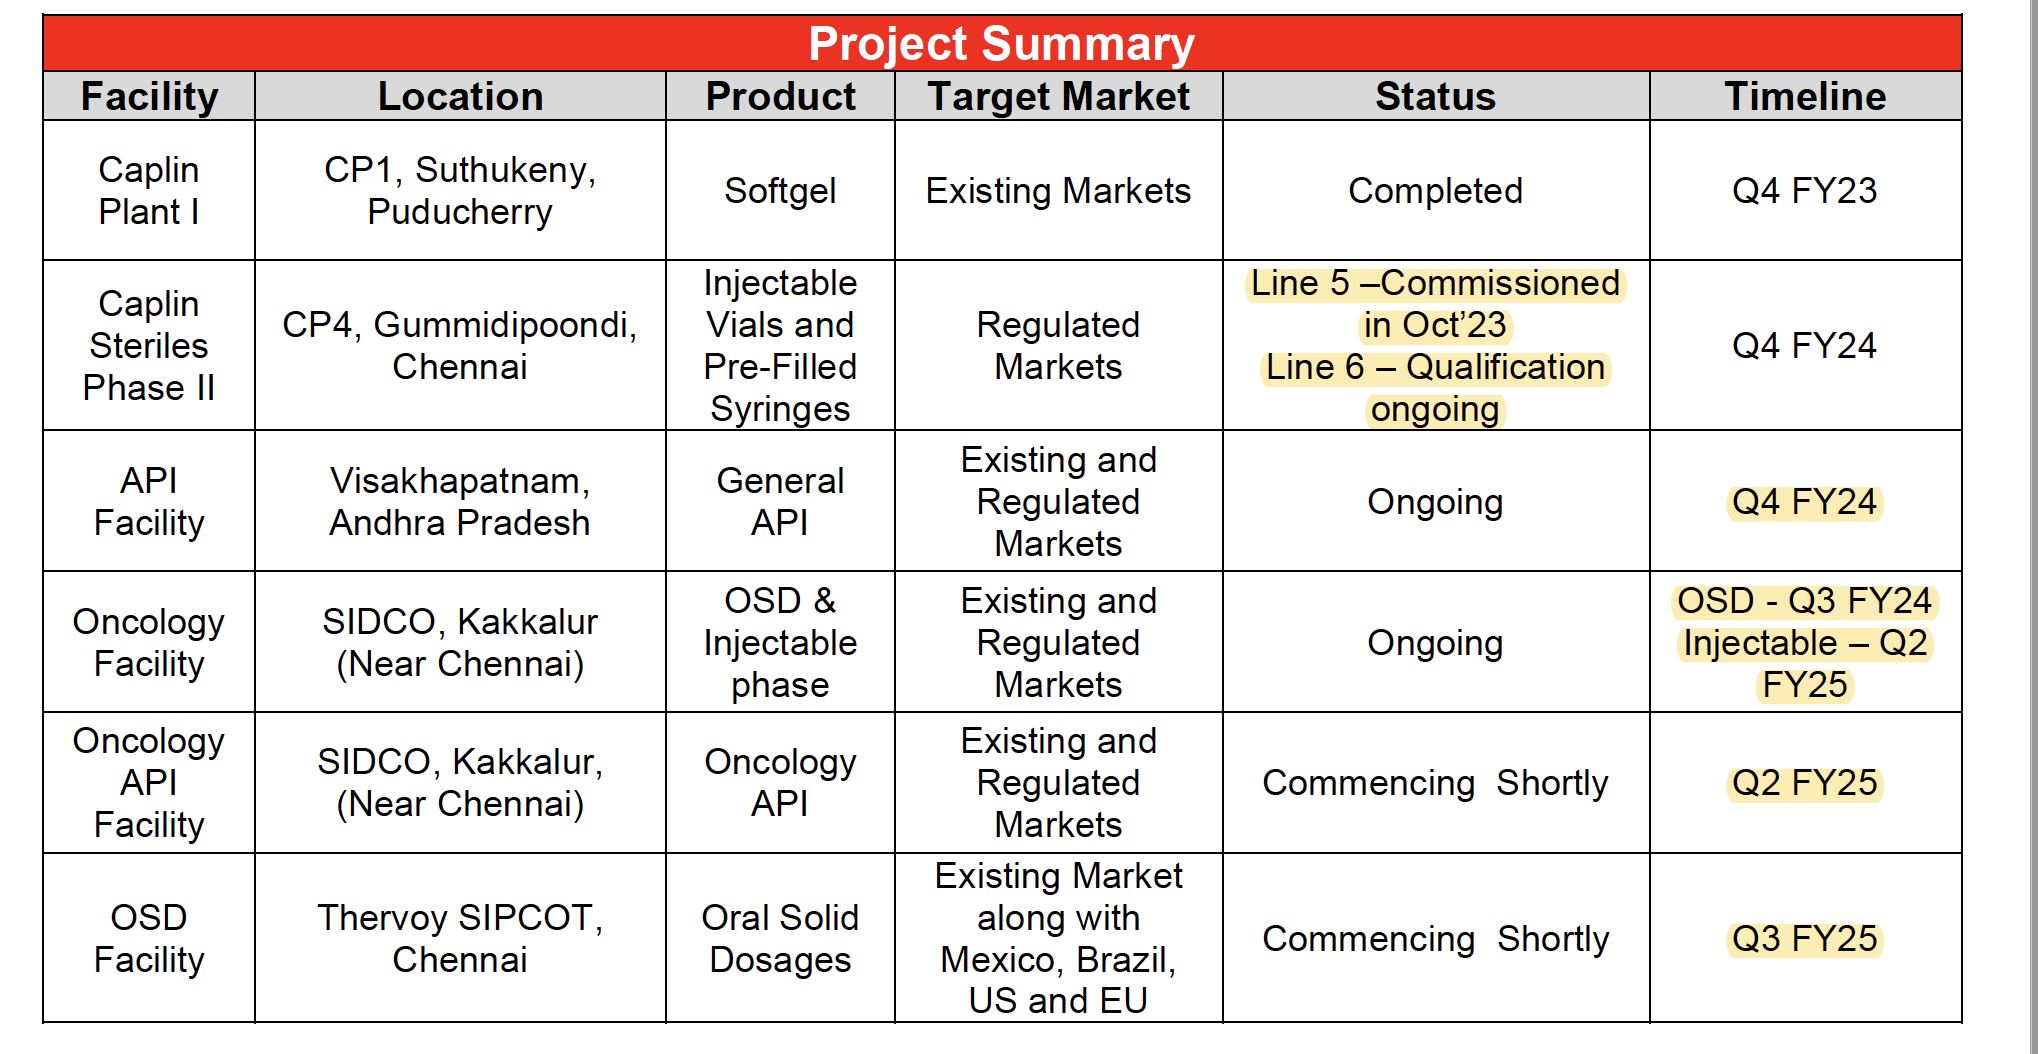
1. Caplin Plant I (CP1) Strategic Growth Initiatives:
- Location: Suthukeny, Puducherry
- Product: Softgel
- Target Market: Existing Markets
- Status: Completed in Q4 FY23
2. Caplin Steriles Phase II (CP4):
- Location: Gummidipoondi, Chennai
- Products: Injectable Vials and Pre-Filled Syringes
- Target Market: Regulated Markets
- Status: Line 5 commissioned in Oct '23; Line 6 qualification ongoing
- Timeline: Line 6 expected to be qualified by Q4 FY24
3. API Facility:
- Location: Visakhapatnam, Andhra Pradesh
- Products: General API
- Target Market: Existing and Regulated Markets
- Status: Ongoing
- Timeline: Expected to be completed by Q4 FY24
4. Oncology Facility:
- Location: SIDCO, Kakkalur (Near Chennai)
- Products: OSD & Injectable
- Target Market: Existing and Regulated Markets
- Status: Ongoing
- Timeline: OSD production is expected to start in Q3 FY24, and Injectable production is anticipated in Q2 FY25
5. Oncology API Facility:
- Location: SIDCO, Kakkalur, Near Chennai
- Product: Oncology API
- Target Market: Existing and Regulated Markets
- Status: Commencing shortly
- Timeline: Expected to start in Q2 FY25
6. OSD Facility:
- Location: Thervoy SIPCOT, Chennai
- Product: Oral Solid Dosages
- Target Market: Existing Market, including Mexico, Brazil, US, and EU
- Status: Commencing shortly
- Timeline: Expected to start in Q3 FY25
Caplin Point has allocated a total Capex budget of approximately ₹600-650 Crores for these investment projects. These initiatives aim to enhance production capacities, expand the product range, and achieve backward integration for various products. Importantly, the company plans to fund the Capex through internal accruals, ensuring that it maintains a net positive cash position throughout the process.
The locations of these plants and facilities are distributed across Tamil Nadu and Andhra Pradesh, India, demonstrating Caplin Point’s commitment to meeting market demands and expanding its operational footprint.
9 Likes
Seems within the limits when it comes to Pharma/Healthcare companies, which are around 110 ~ 120 days. I think however good results are, some of us tend to find holes and in many times when holes are not there also ![]()
The stock just touched 10,000cr market cap today. I still remember “the big debate” a few years ago when many were simply adamant that this company will vanish because they couldn’t understand the fundamentals or the business. Anyway, next few years seems even more crucial for them given the amount of Capex they’re putting together. Good thing is, they’re doing it with internal accruals rather than take on debt. Would be interesting to see the ramp up once everything is completed.
13 Likes
Couldn’t agree with you more. Sometimes investors obsess over whats not there more than what is. Sometimes overanalysis leads to paralysis. Its often best to keep things simple.
The simplest proofs of Caplin’s business are:
- The fact that they have never taken on any substantial debt and have still managed scale up on reserves and assets from internal accruals
- Governmeent’s export data which is pretty grannular
If it walks like a duck, and if it quacks like a duck, its probably a duck.
14 Likes
I am not trying to find holes here. I know it’s commendable how the company is growing and that combined with margins expanding makes it a great stock available at good valuation. But I can’t just ignore what I see and not try to understand the reason behind it.
To elaborate, look at the stand-alone financial statement. The sales for the first half were 379 crores while the receivables increased by 140 crores (from 88 to 228). Now I know that company is doing some B2G business which even the management said was the reason for the rise in receivables. But if almost half of your sales are on credit, that certainly calls for the explanation regarding when will the company actually receive payments for these. Because what I see that the receivables number both at standalone and consolidated basis has been increasing.
If anyone knows more about what might be the reason for this, please feel free to clear the doubt. I am just trying to understand every aspect of it as that is what helps you build the conviction required for a meaningful capital allocation.
4 Likes
Always compare with respect to sales and see the historical ratio of AR/sales for the company. Also, dig for reasons w.r.t. the business model. You can also compare the ratio with other pharma firms operating more or less in the same geography, molecule/segment and business model.
2 Likes
Yes, the management gave couple of reasons for both receivables and inventory days. They have answered this in the concall at length. Please refer the below video. The CFO/EBIDTA ratio is still better than most pharma companies.

Disc : Invested at lower levels and biased.
Note: Skip to 21:00 to hear the question and answer
5 Likes