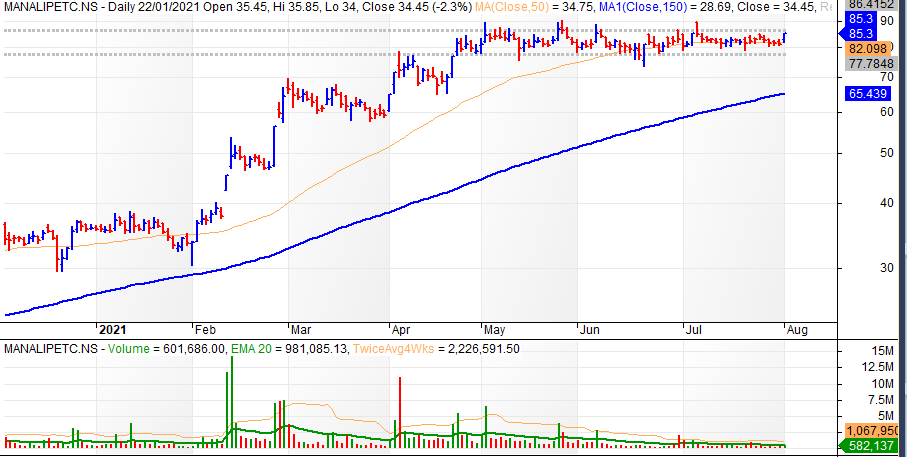
Manali Petro
Upper circuit today, if not for upper circuit, it probably would have broken through that resistance although volume is still relatively low, I would have liked to see it break with good volume but on upper circuit probably difficult. If it did uc on low volume it means that there is not much supply left…
Some things in its favour:
Capacity being doubled by March 2022
Propylene Glycol Rose 9.34% as per this site in July in what was already rising
Manali petro I believe are the sole manufactureres of Propylene in India and last 2 quarter results have been spectucalar
This quarter might do better although current capacity is fully utilised, better price realisation
Daily volume is very thin
Results are expected on 10th august
There will be around 6 months wait for the new capacity to come onboard and with current capacity used up and rising prices, revenue likely to double in 6 months…
Charts without any description or explanation are not allowed & will be deleted. Repeating the same will be treated as violation of rules & would attract strict disciplinary actions.
I have been going through this thread from the start. Arround demonitization time. Demonetization spike was simply the best disapproval of ‘technicals work’ theories. I went through some first 15 posts. Almost every technical analysis failed. Gave up. So dear readers, don’t blindly go by what is being posted here as ‘technical analysis in bull market works’. Please do your own diligence.
Disc: I lost money on pure technicals during demonitization
I think you are looking at it the wrong way, buddy. Even the best technical setup has a certain chance of failure. Any quantitative method that we use to invest needs a probabilistic mindset, not a binary thinking. Before investing, one needs to set a point where one will have to cut the losses and get out. Otherwise, a small loss will turn into a big one.
Secondly, success or failure of a method can be determined only in a large sample size. Suppose a breakout investing strategy has a success probability has a hit ratio of 70%. That does not mean that if I buy three breakouts, two would turn out into winners. It is equally probable that I may lose money on all three.
Thirdly, position sizing and risk management as well as exit strategy are far more important that our entry point. Though unfortunately, that is not much discussed here.
Lastly, shock events like demonetization, Covid 19, 2008 Lehman crisis etc regularly crop up once in every few years. We need to be psychologically prepared for that. It’s just part of the game.
One of the member has been suspended for 2 weeks for not heeding to moderators advice. Any chart without proper explanation is going to attract strict disciplinery actions.
Whether we use fundamental or technical analysis, there is no sure thing. Both involve (buy/sell/position sizing) decision making under uncertainity.
Pure fundamental/value investing takes a view that the market is irrational (Mr Market) and values self assessment of a company over what market is pricing it.
The problem with this approach is that often there are unknown unknowns and information asymmetries not captured in our analysis of a company which can suprise on the downside.Often, assumptions are made about future prospects of the company whose success/failure can alter the assessment of value of a company drastically.
Also, it is not possible to be an expert in many industries. Hence one is limited in the set of company one can invest in.
Even if one is correct in one’s analysis, there is opportunity cost in locking up capital in a company which is not recognized yet by the market
Technical analysis gives great importance to price action. We wont be able to catch the bottom/top of a stock’s long term move, but the idea is to capture the meat of the trend.ATH are a method to identify new trends emerging in stocks/sectors. Breakouts from long bases with volatility contraction help to identify a low risk/high success probability entry into a stock. The disadvantage of this approach is that we may miss out on a large trend in a company/sector if we are too focussed on capturing short term price movements.
Technical analysis allows one to be nimble with respect to market conditions. For outlier events like demonetization, covid etc, stan weinstein’s stage analysis
would have helped to identify change in long term trend and allowed one to exit with minimal loss.
Fundamental analysis helps one estimate the magnitude and duration of a stock’s uptrend so that one can position size accordingly.
At the end of the day, any investing/trading system one employs must have a positive expectancy. In other words we need to make significantly more profits to cover for losses is the ideas that fail.
Personally, being a novice investor (since 2014) experimenting with different approaches, I have had better returns with Technofunda approach than with the value investing approach. Some of the resources that I found useful were:
Mark minervini’s Think and Trade Like a Champion and Trade Your Way to Financial Freedom from Van Thorp for nuts and bolts of a trading system - risk management, position sizing, entry/exit rules etc.
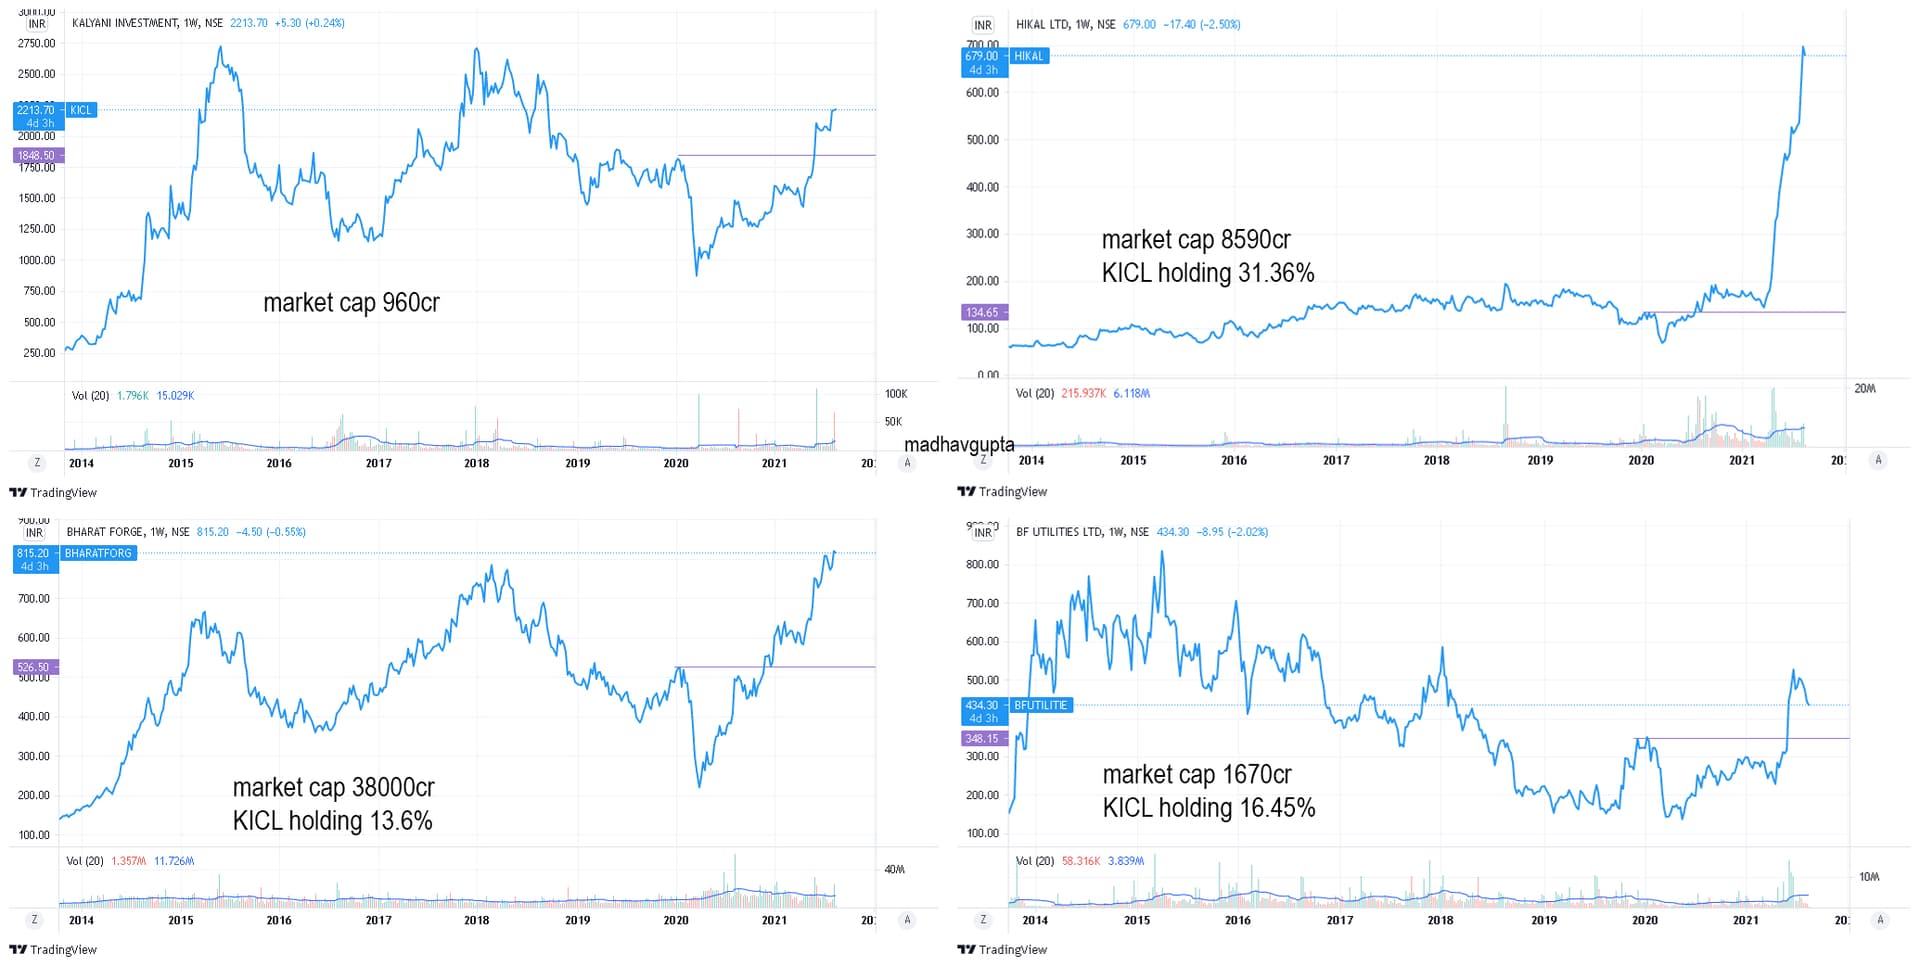
It is a holding company like so many others. We know that it is common for holding companies to trade at steep discounts. Here, through charts, I am trying to show that KICL has a lot of catching up to do as compared to its investments/subsidiaries companies. The black horizontal line in each chart is the pre-covid level for these companies. Along the charts I have given Current Market Cap of these companies.
If anything, I expect KICL to reach atleast its previous high made in 2018, as Bharat Forge and Hikal are already above those prices. This is a longer term bet.
Disclosure/Disclaimer: I am not a SEBI registered advisor. I am invested in KICL near cmp.
Update on previous post (chart # 5 - Himat Singka) - what a ride, 200 to 270 within few days.
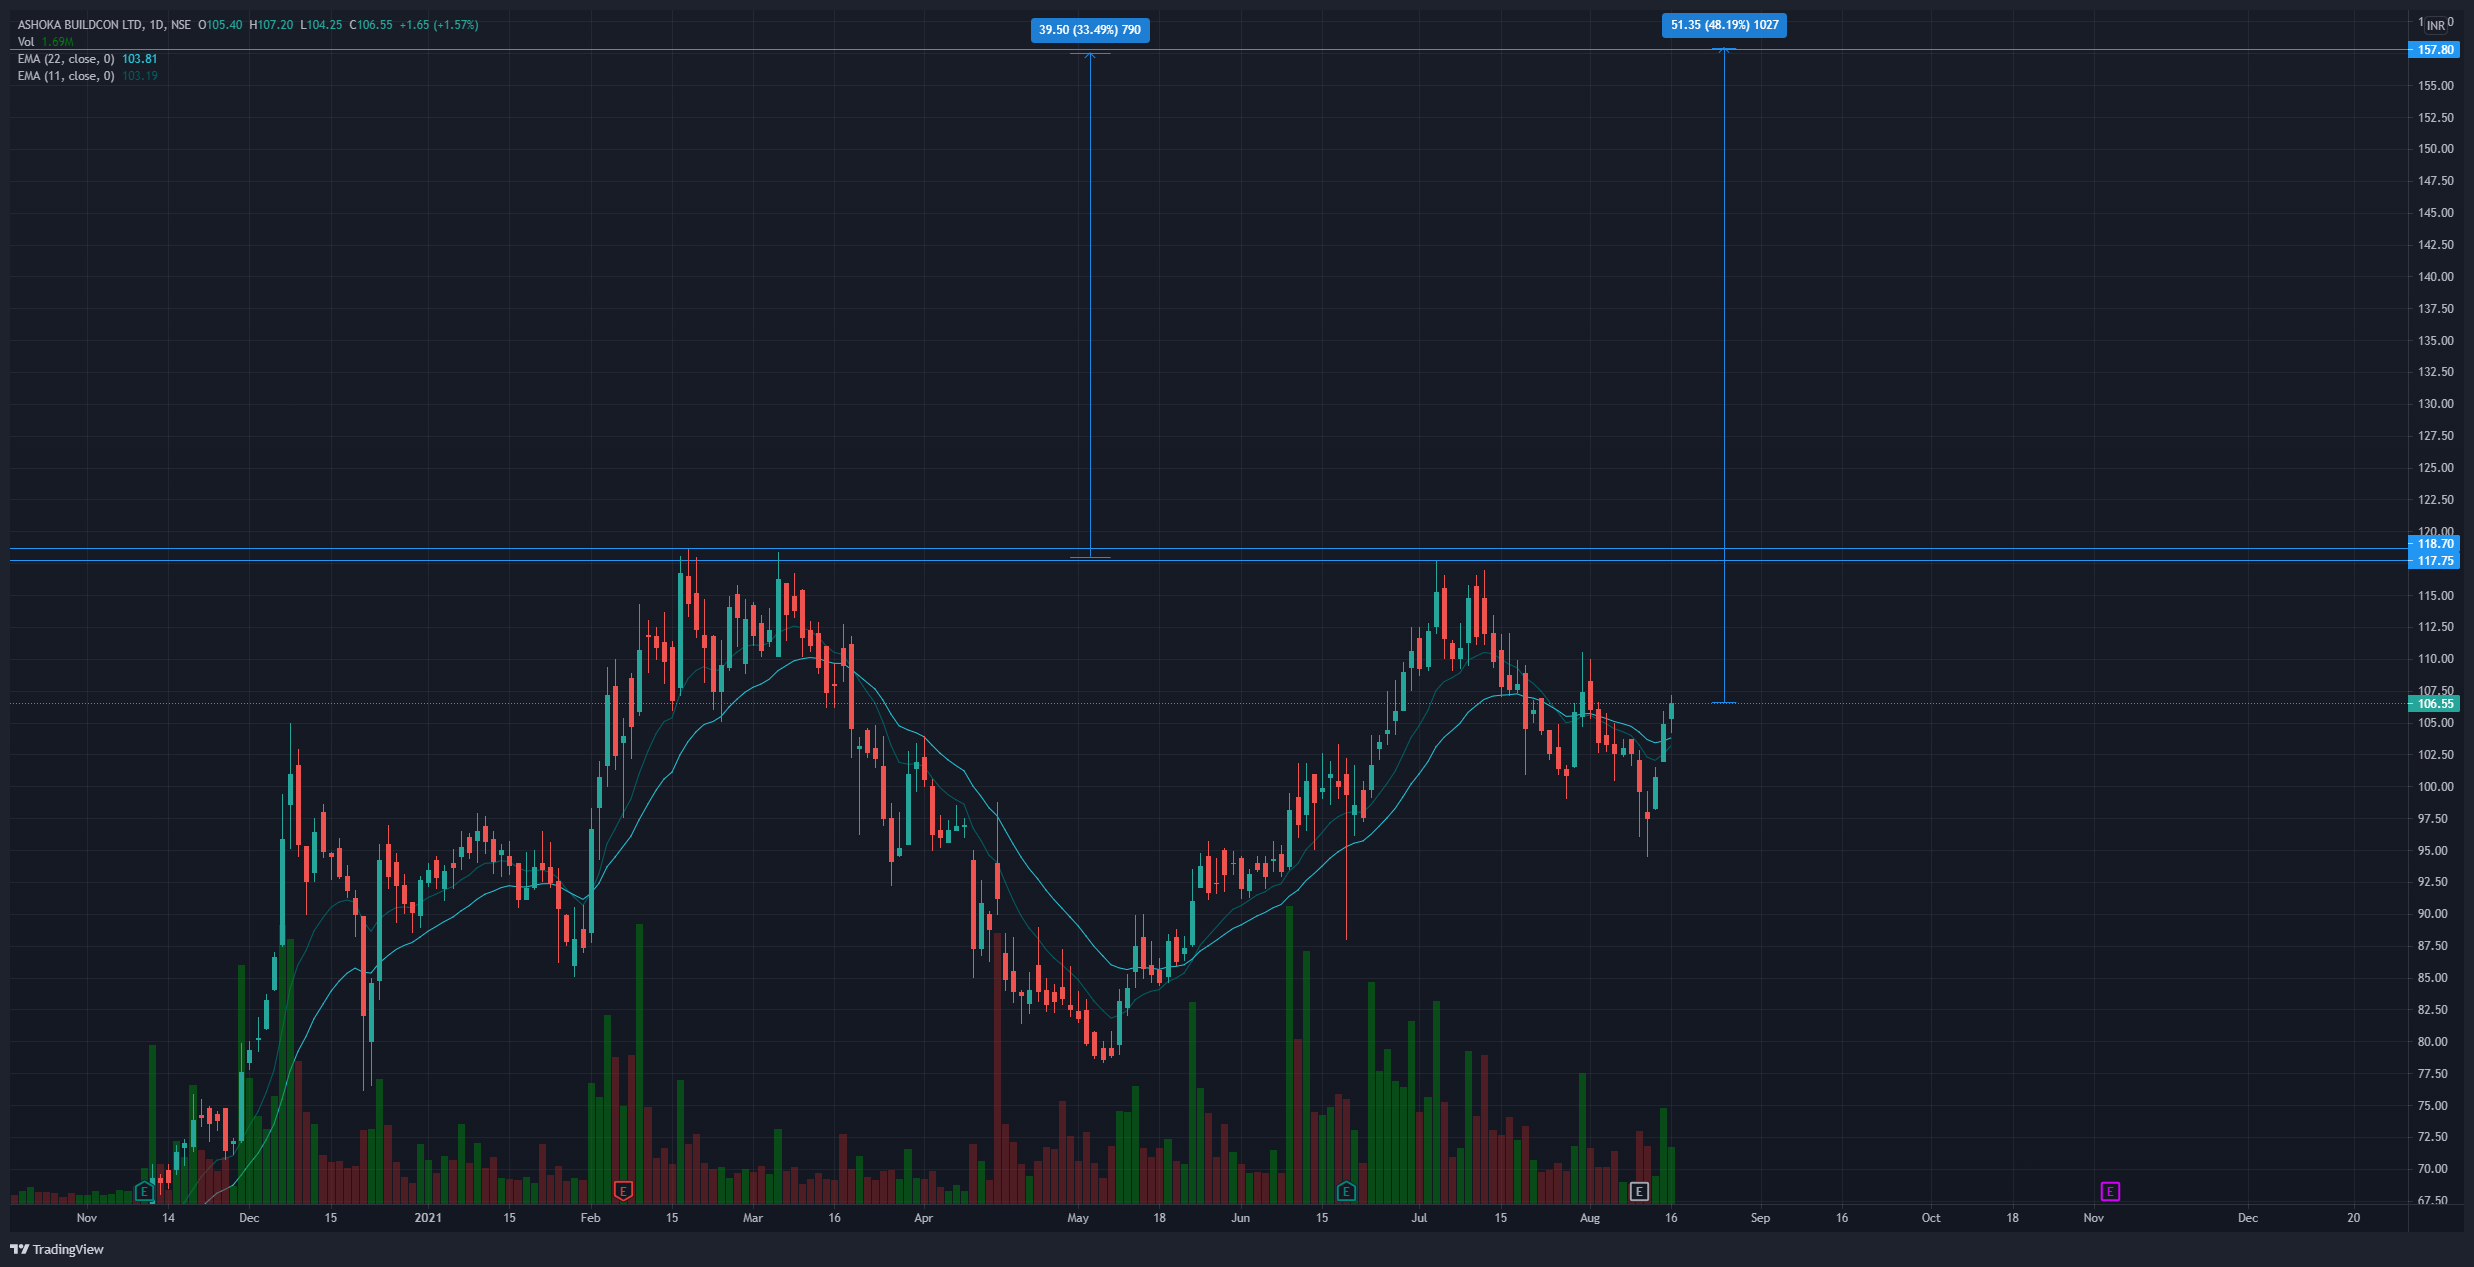
It is in the midst of forming a cup with handle pattern (to be completed @ 117 levels) which would give it a target of ~155-160 based on the cup depth.
The Fundamentals:
Ashoka buildcon is an infrastructure company that is mainly involved in the development of roads and buildings. It currently trades at a P/E of 7.7. The recent quarterly results have been better than expected and the order book inflow is healthy (Rs 30 Bn in last quarter, total order book at Rs. 105 Bn), EBITDA margins maintained. Management has guided a revenue growth of 25% in FY 22. And the expectations of closing an outstanding SBI-Macquarie deal this FY would act as a major trigger. On the valuation side of things, taking ~20% topline growth @ FY23 P/E of 8 and subtracting the SBI - Macquarie payable puts this at ~Rs 190 per share.
Disc: I am not a SEBI registered advisor. I have invested recently in Ashoka buildcon.
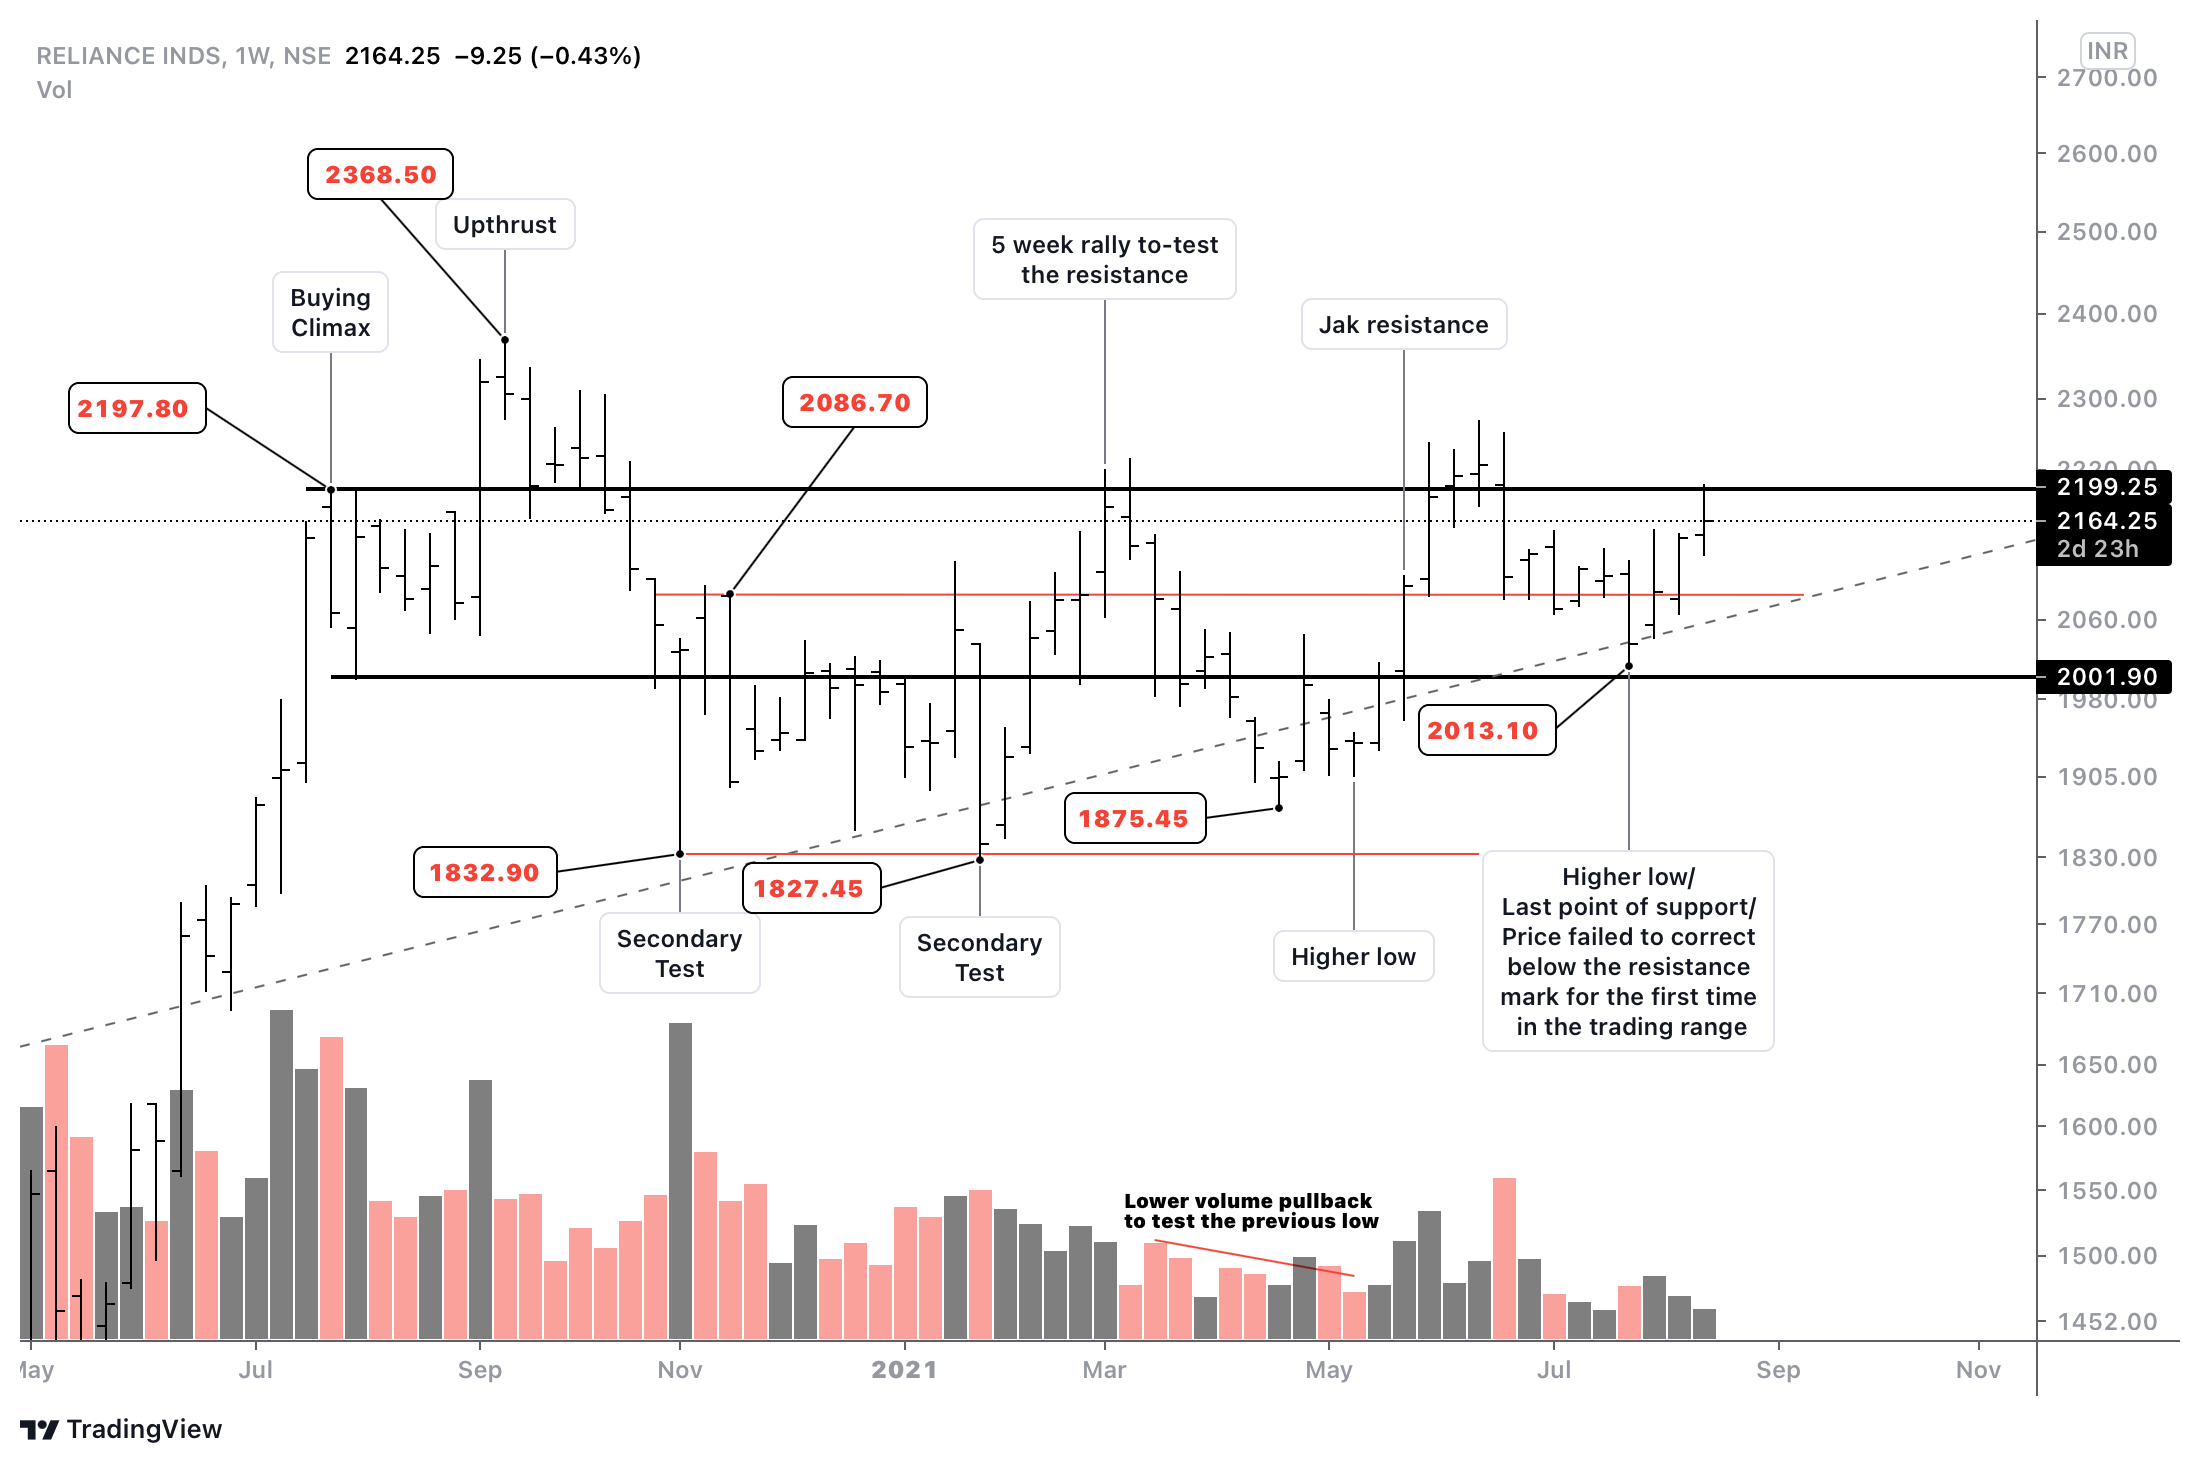
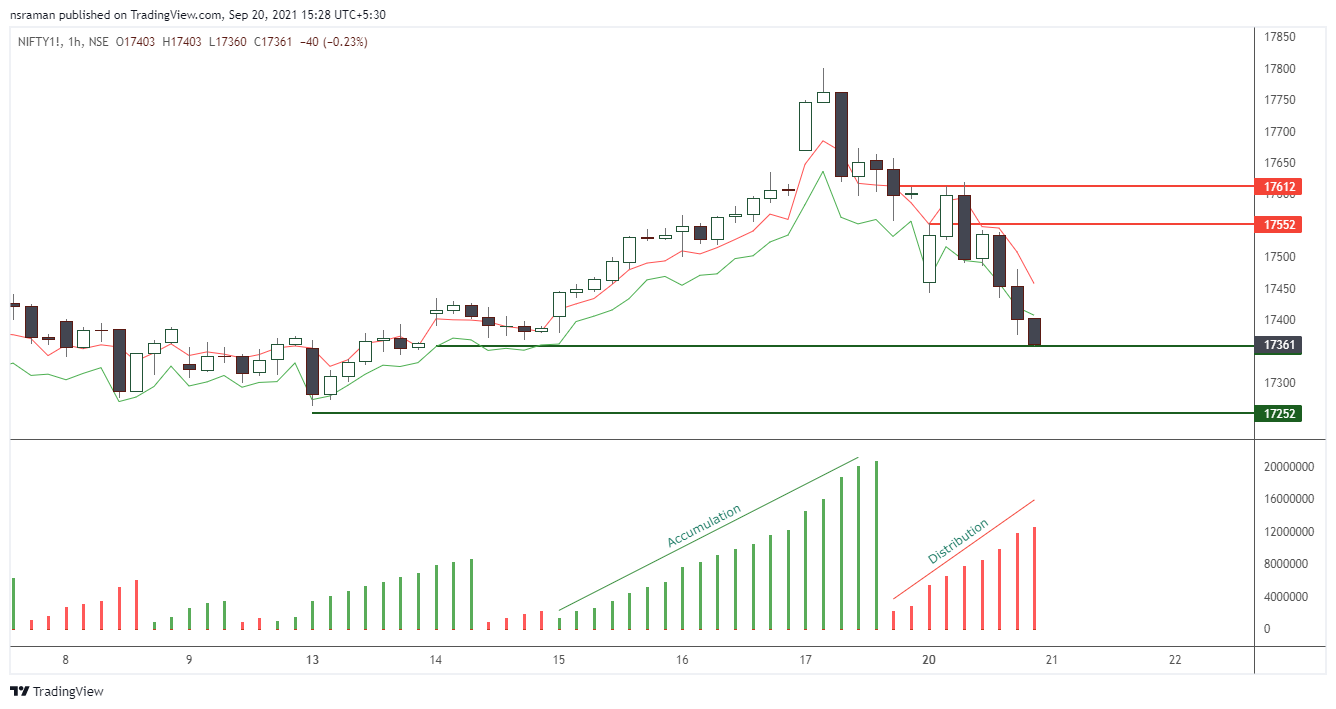
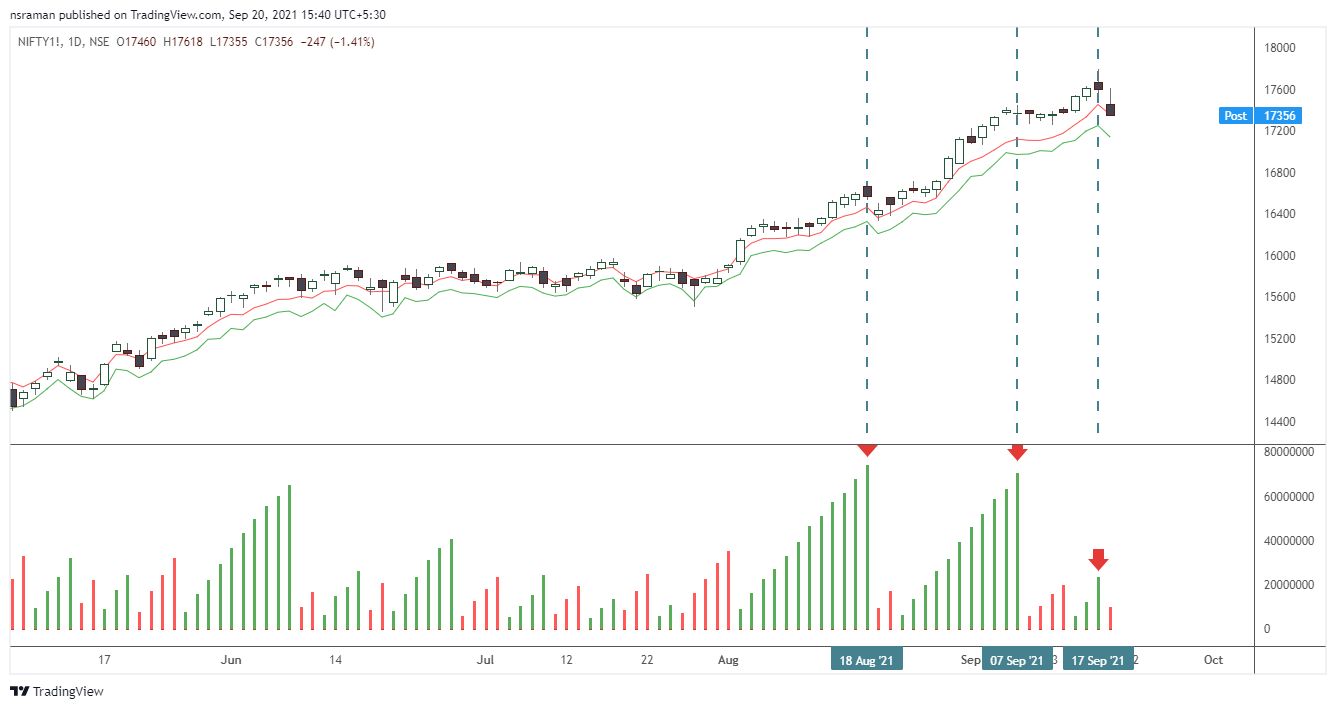
After reaching a trend climax 2020 july followed by a unsustainable upthrust a month later reliance has been a laggard in every structured portfolio whether investors or mutual funds.
If we carefully observe the price structure- the trading range- the action shows multiple tests of supply- the 2nd secondary test at 1827.45 limit started off a buying spree which thrusted the price back to the resistance of the trading range formed by the buying climax at 2197.80.The action followed down to another test of supply april-may2021 failing to make a new low. The selling was exhausted at a higher price level 1875.45 followed by another buying wave in may.
The next test formed a significant higher low at 2013.10 ( precisely 10% higher than the lowes early in the trading range). An interesting point to note- a resistance at 2086 was formed in November and the action found difficult to sustain above it until 8 months later 2021june.
The repeated supply test not able to go lower than the preceding one- higher low formation- is a classical phenomenon of supply absorption. The 2 rallies we saw so far climaxing at the resistance were backed by good demand bars- indicating the scrip is being bought into strong hands. Finally the general volume inside the trading range has shown a steady decline indicating lesser volatility and lesser exchange of hands. The decline in volume notably started since the buying waves commenced in February after the 2nd secondary test.
The past 2 weeks of action has not shown significant pick up of demand although this week the price has opened above the highs of the previous two. The scrip might be consolidating withtin the trading range for sometime more but this feels like a last point of support building up in the trading range.
Once the base formation is complete reliance can take nifty to higher levels.
With most of the scrips in my portfolio approaching lesser upward potential after the current run up, a higher allocation on large caps like reliance certainly should help with better risk management in my portfolio.
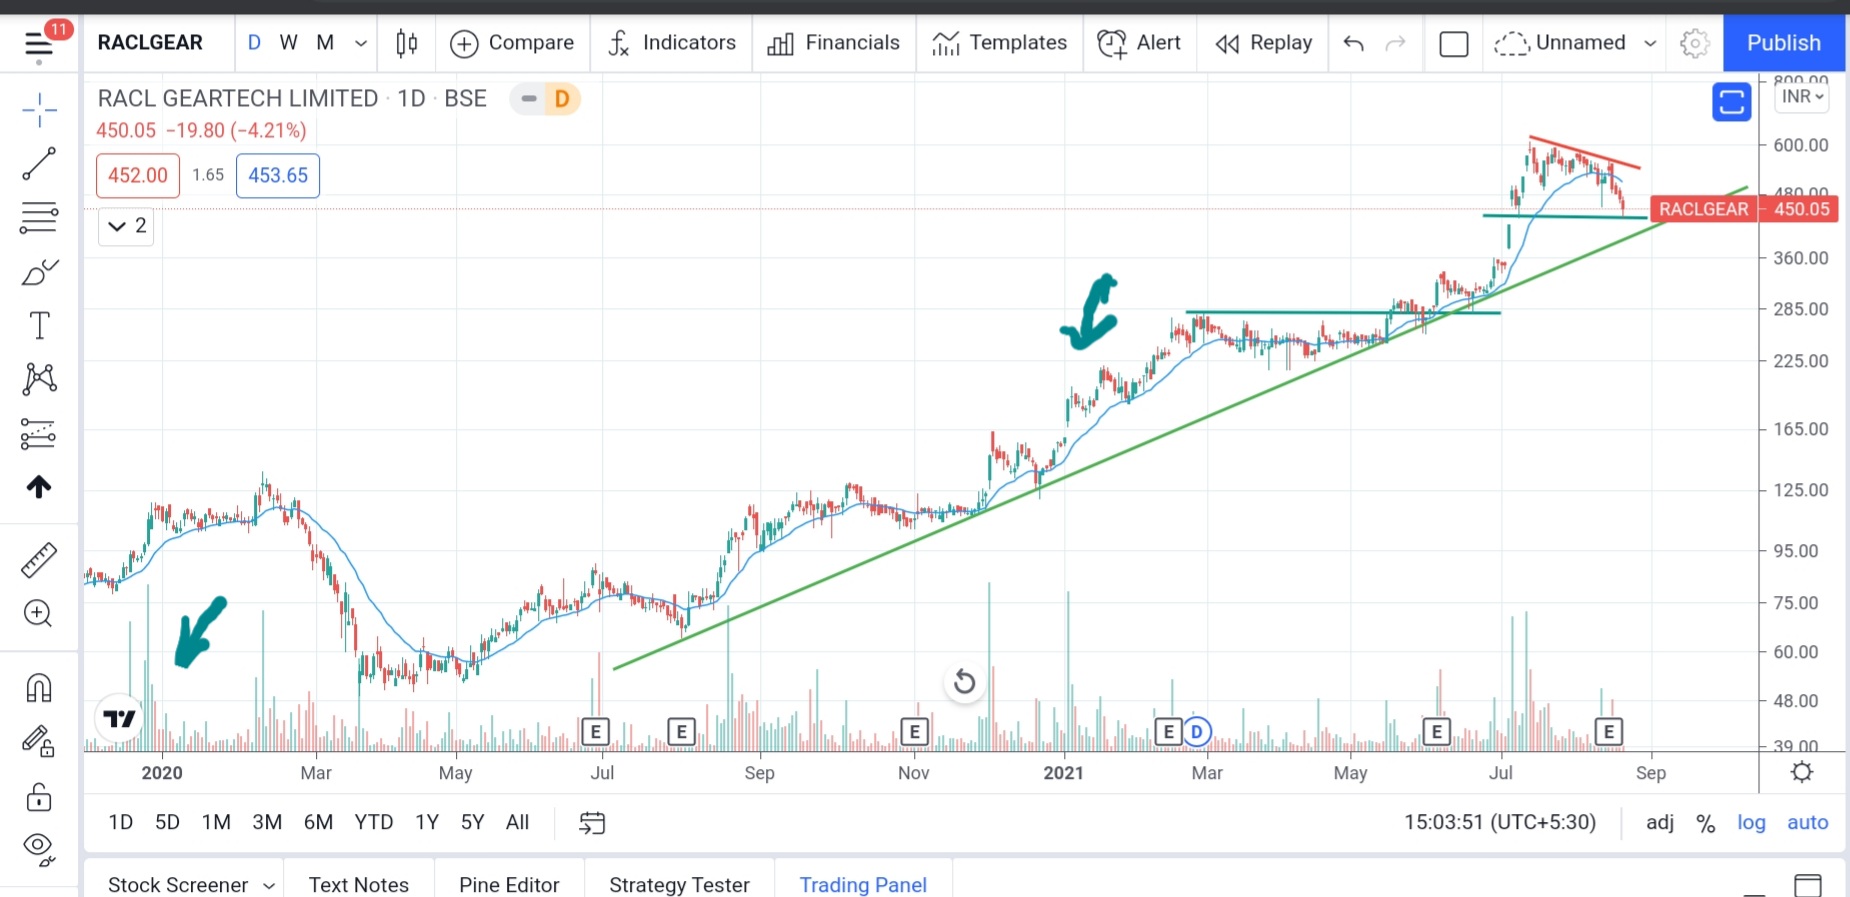
One of the high fliers in auto ancillary - RACL, pullback towards trend line and short term support line, Bounceback candidate if stages well. fundamental in main RACL thread.
I would like to put a technically cautious stance here in racl, yet my opinion would most likely be biased as I have liquidated my positions on this scrip past month…
The action was overbought and the 12th July 2021 close to me was the ugliest weekly action since 10th Feb 2020 and not to mention the stock had an incredible run-up…
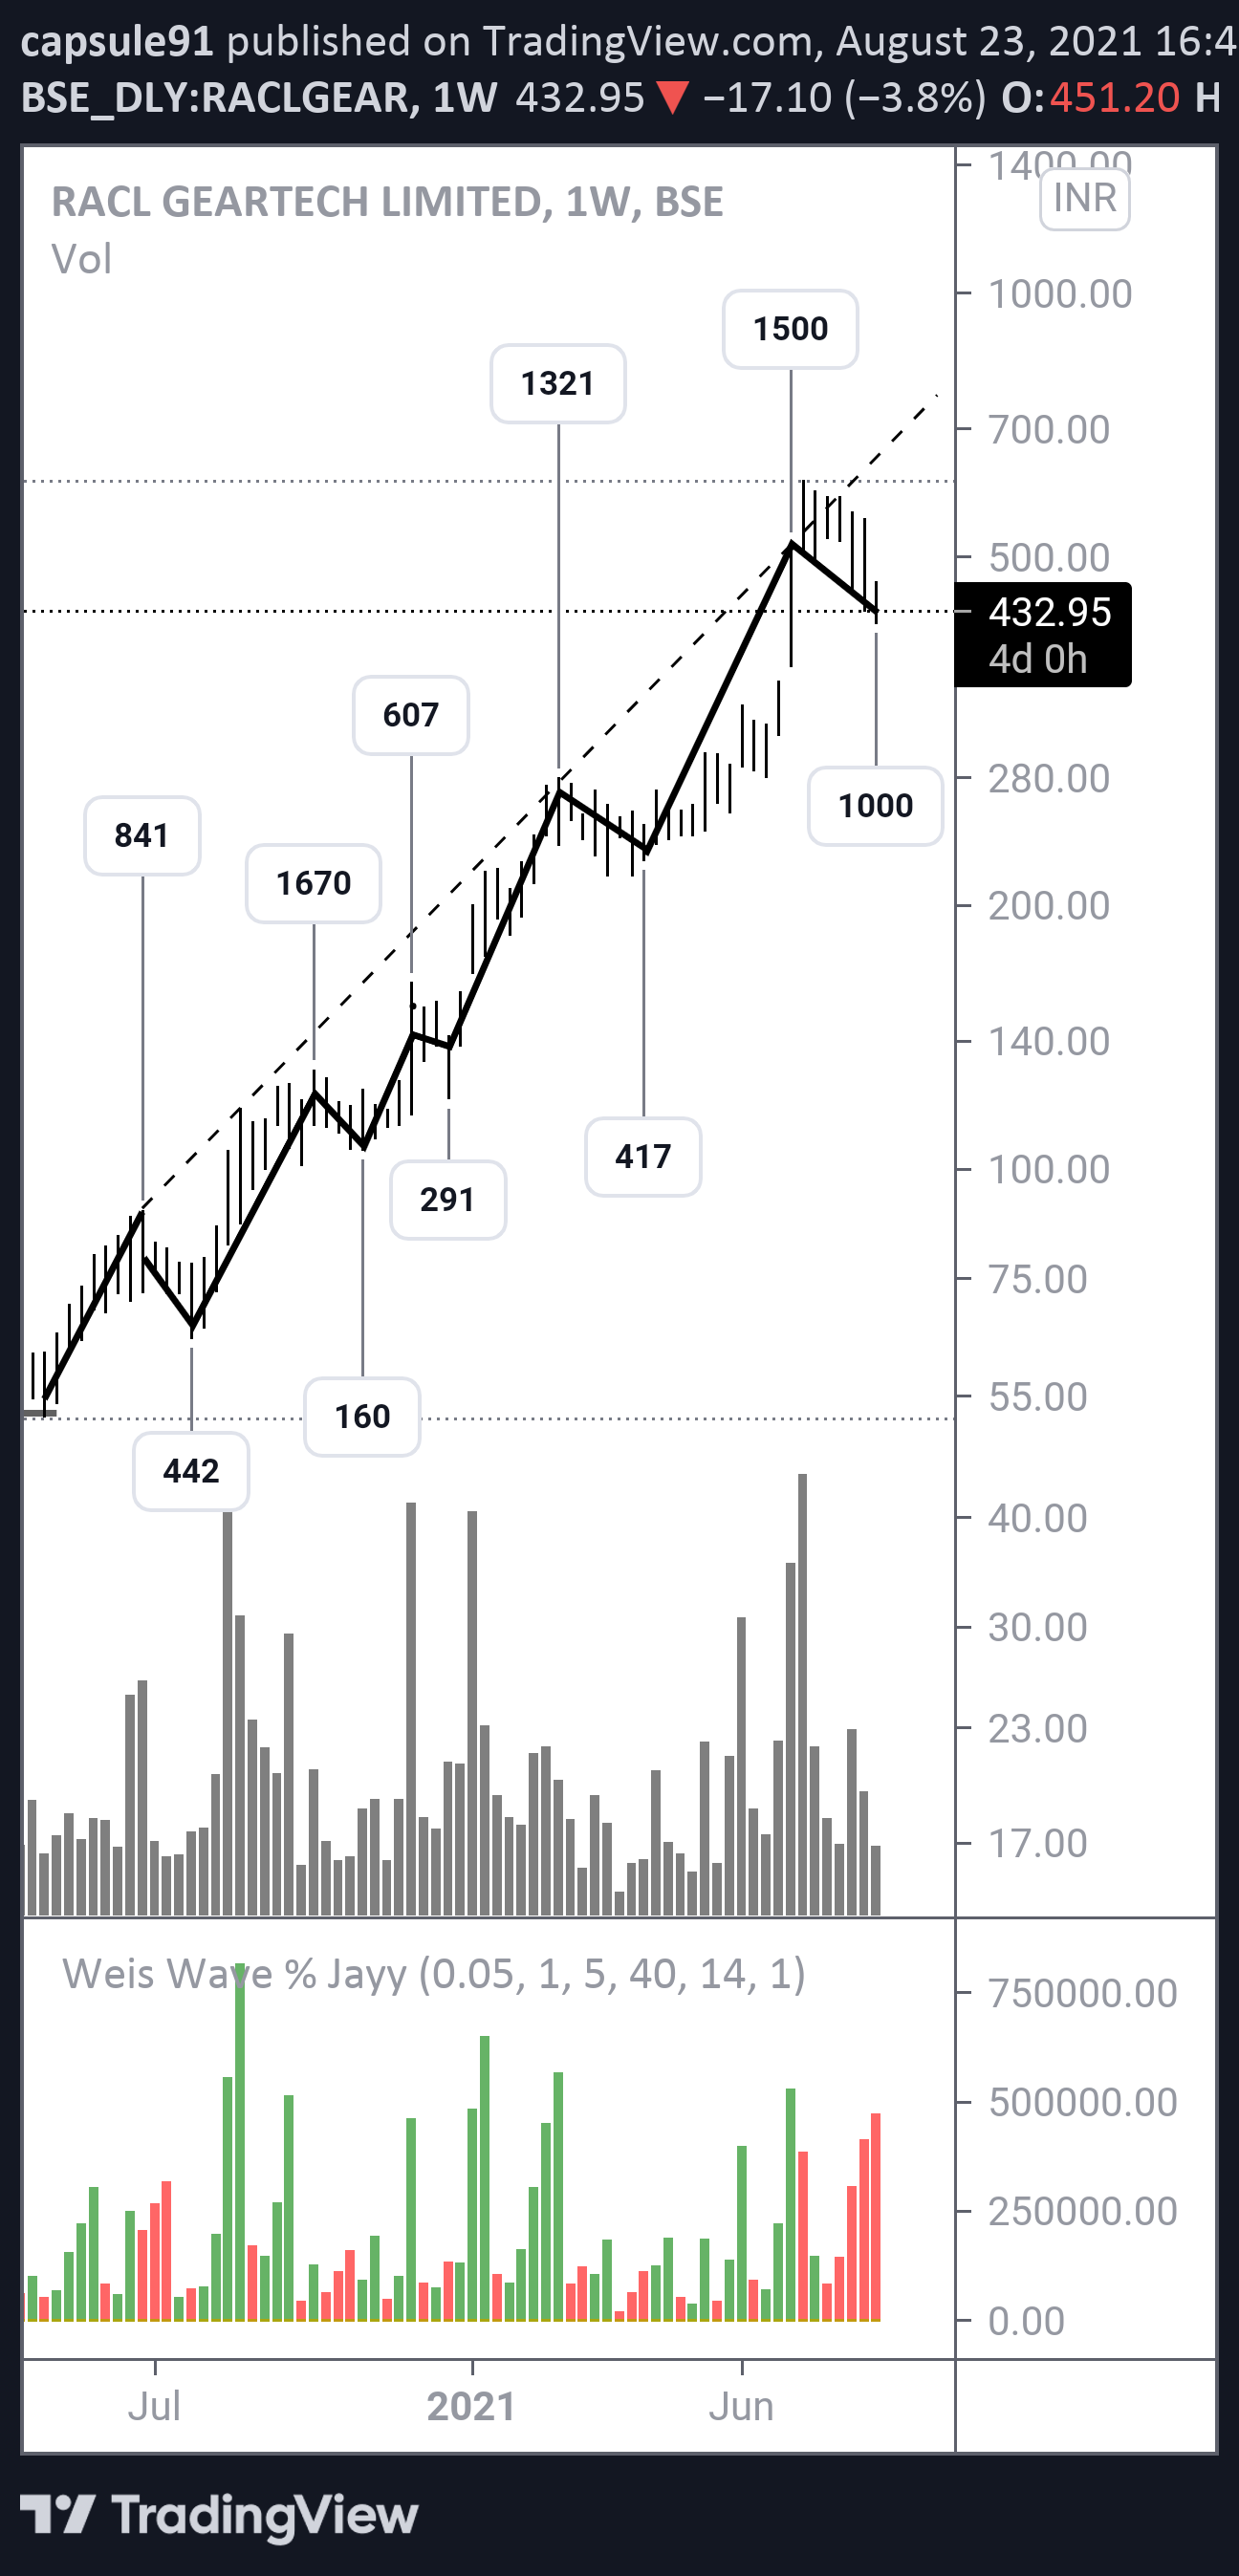
Allthough I do not notice any weekening of upward momentum , that 12th July bar close I mentioned at the top of trend channel with highest weekly volume cannot be ignored on this chart and what followed in the past month is a correction with heaviest downwave volume in this run up.
The numbers( in multiples of theousand shares) mentioned are total volumes in each waves- weis waves- I think these kind of volume information is much more significant.
The current downwave volume has already exceeded 1000k shares…
My conclusion is simple caution- no major supports broken yet, no trendline support broken, fundamentals remain on track( although last I did a proper fundamental check on this scrip was in 2019 before investing)- just subtle signs that the strong hands might have started supplying the market… otherwise why is this decline happening on more than double all the previous volumes (on decline).
The current rsi on the weekly chart is at 59- the previous lowest pull back rsi went to 44. If the rsi dips below 50( around which I am expecting a upwave might start) I expect weakness to show up on the demand side of this chart.
The small and midcap space has run up a lot, it has to consolidate technically from now on- but oh well, Bull markets are funny speacially after a significant run-up. Among the common names Tata Steel has started to show major weakness in the chart too, managed to liquidate position at what turns out now was an upthrust.
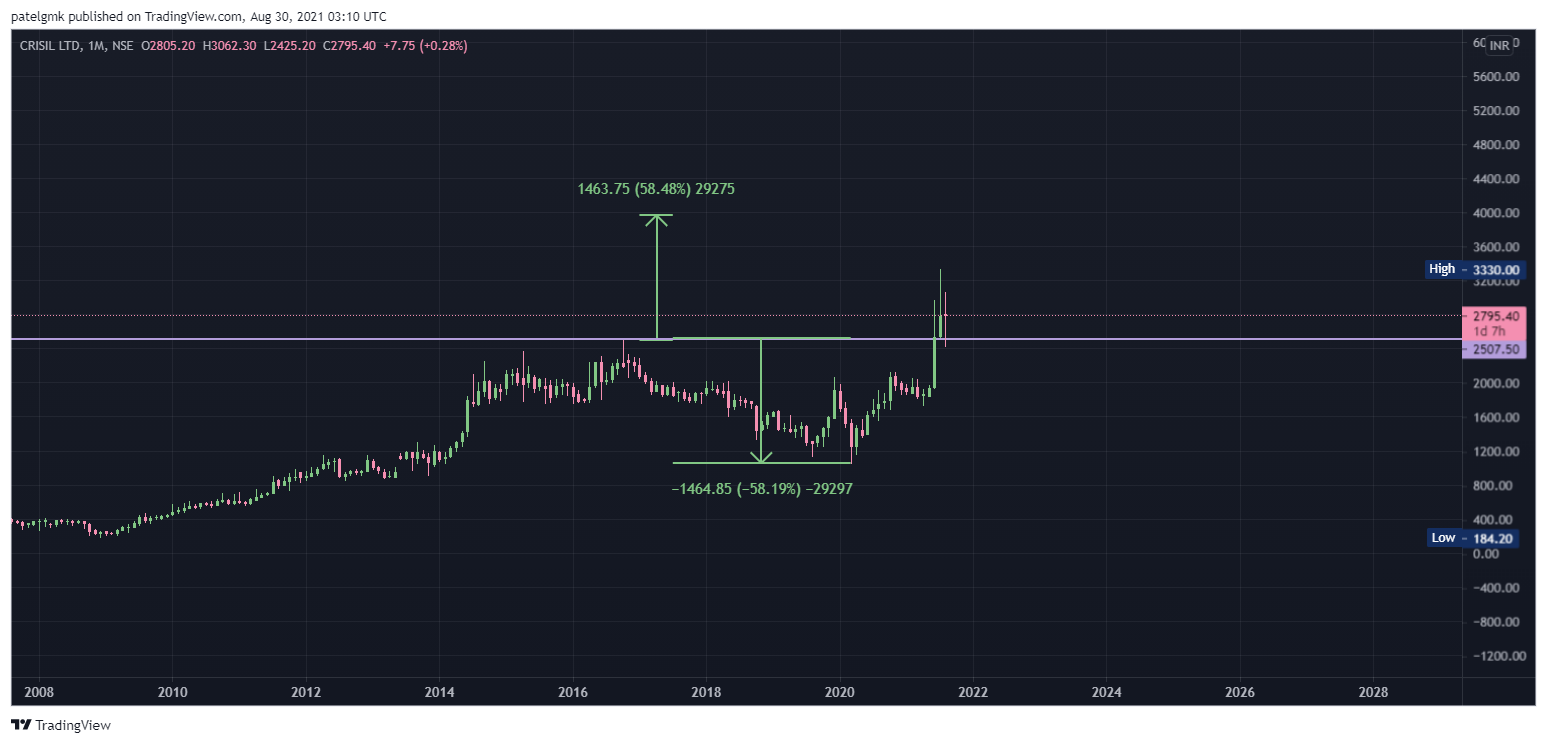
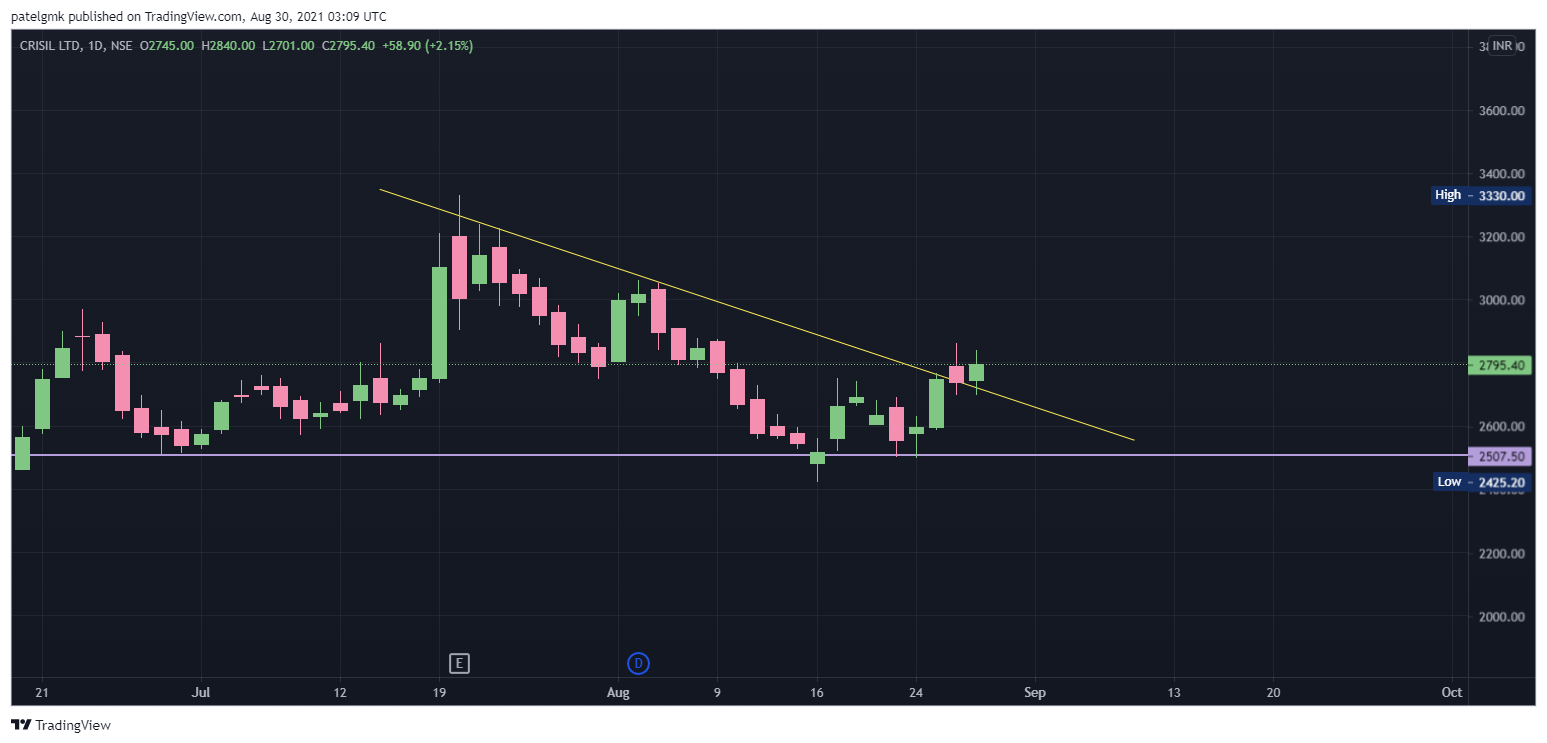
Crisil seems to be ready for a substantial move as multi year break out and retesting are done on monthly time frame. It has also retested break out of trendline on daily timeframe.
Target: 3900+.
Disclosure: Holding from lower levels.
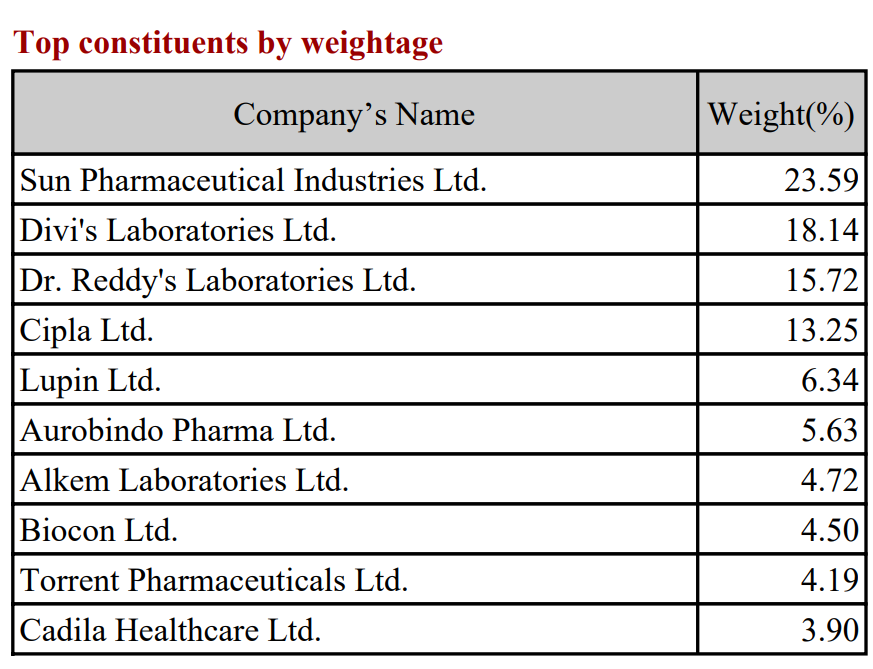
The counter argument is that the Nifty Pharma index is a heavily skewed index with Sun and Divis forming >40% weight. These along with few names like Torrent, Alkem have been strong.
So the index is not a true picture of the sector. Plotting an equi-weighted index of companies would be a good excercise. This was clearly highlighted post COVID when the Nifty pharma index gave a late signal of breakout as Sun was underperforming.
Eventually we need to select the names that are outperforming the index. I have shared the chart for Torrent on the thread “52 week highs”
There is already a ready made Nifty 50 equal weight index. It is an interesting index to track because of the drawbacks of nifty.
There are some softwares like Metastock that allow creating an index of your own. For example there are no indices for textile at all. So you can create such indices and use in your analysis. I am not aware of a website that allows creating such indices, but I havent looked for it.
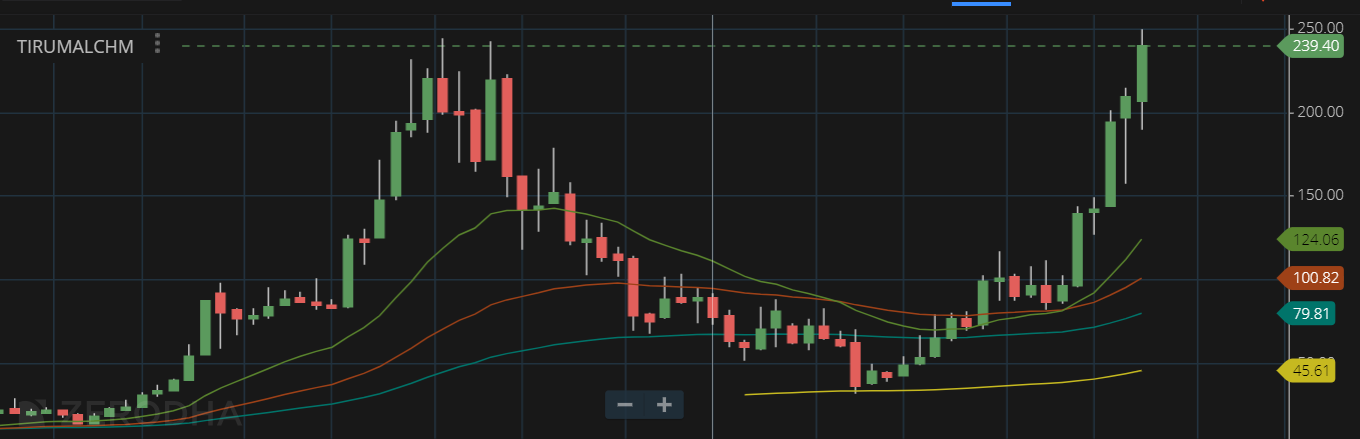
Similar pattern played out well in HIL and Pokarna. Fundamentals from my previous posts here and also the main thread from here
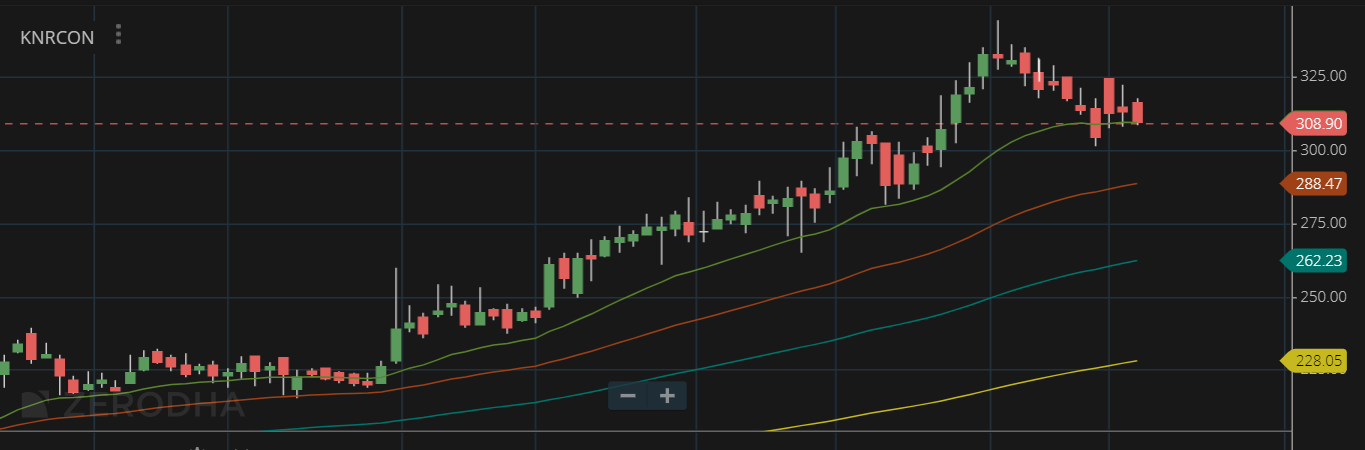
KNR, Daily - Simple trend-following systems would prompt a buy near 20 DMA on an uptrend and same thing can apply here. Fundamentals are rather strong with an order book almost 5x of topline and execution picking up steam. Valuation continues to remain favorable and its relatively less volatile due to high institutional holding.
Disc: Have positions in all for sometime (as disclosed in this thread earlier) and have added recently as well on consolidations (hence the daily charts than the usual weekly/monthly ones I rely on).