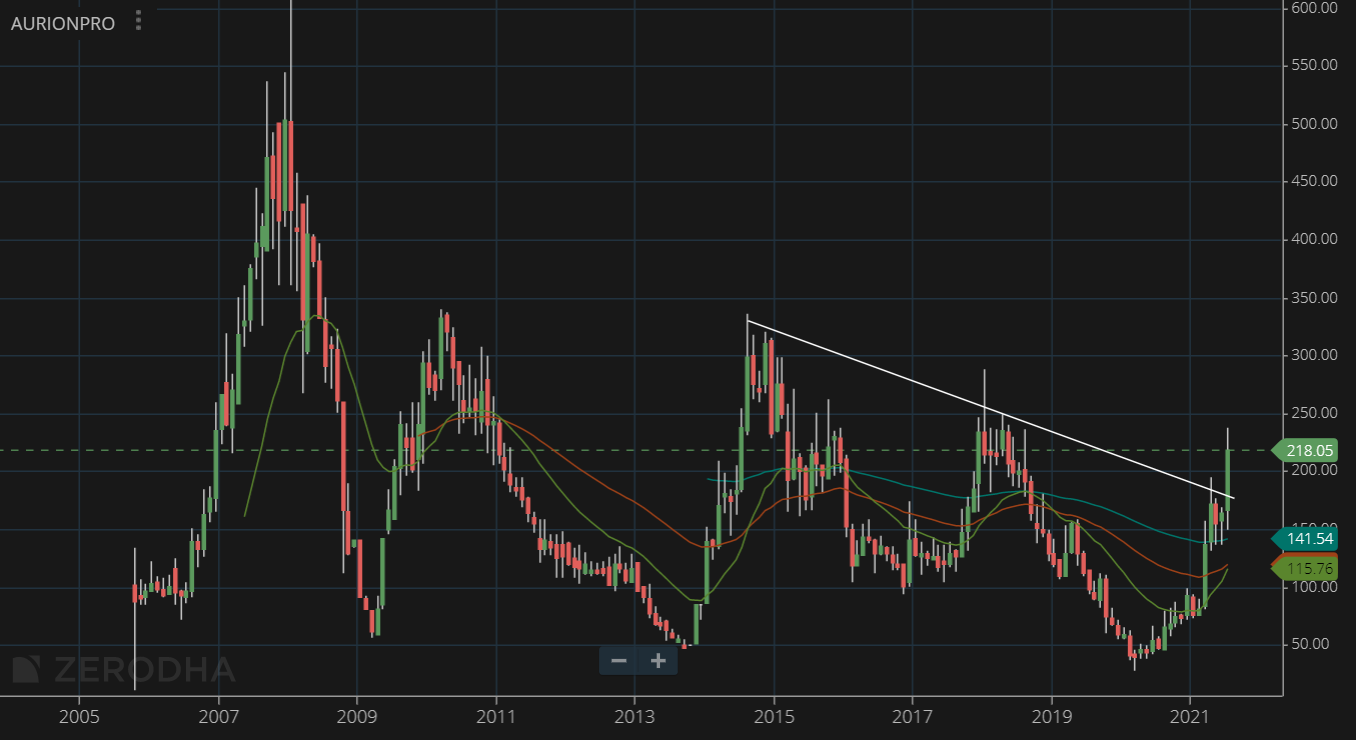
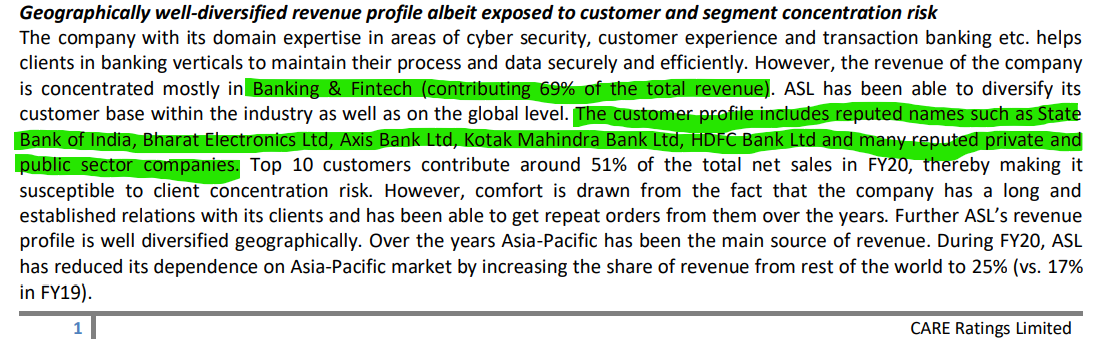
AurionPro, Monthly - Has broken out of a 6 year downtrend with volumes. Seems to be a IT Products business serving the banking industry (transaction banking, loan management with their product iCashPro) and also smart cities (toll collections, travel smart cards). Wasn’t sure of legitimacy of the business given the valuations (< 5x EV/EBITDA)
The ratings report shows some high profile businesses including several top tier banks as customers and also BEL probably for their smart mobility business.
There are some shares pledged but of late the pledge is reducing and so is the debt. They had a big write-off of some intangibles (in Q4) which makes the PnL look bad but the business performance seems to be good.
Disc: The setup is strong along with the valuations for a products business, but still not entirely convinced so my allocation reflects that. Have positions between 160-220. Not an advisor, am a novice. Please do your due diligence and if you find anything about this business, please do post as there isn’t much coverage outside of ratings reports and annual reports.
I think the fundamental premise in any technical analysis chart pattern is to buy AFTER breakout confirmation and not in anticipation of a break out. Break out happens when price crosses a resistance level, which means it is “most probably NOT expected to break out”.
This is besides the point mentioned by @manish962 earlier.
All. You need to put up technical analysis. You need to explain as there are many novice investors who may not be able to understand merely looking at chart.
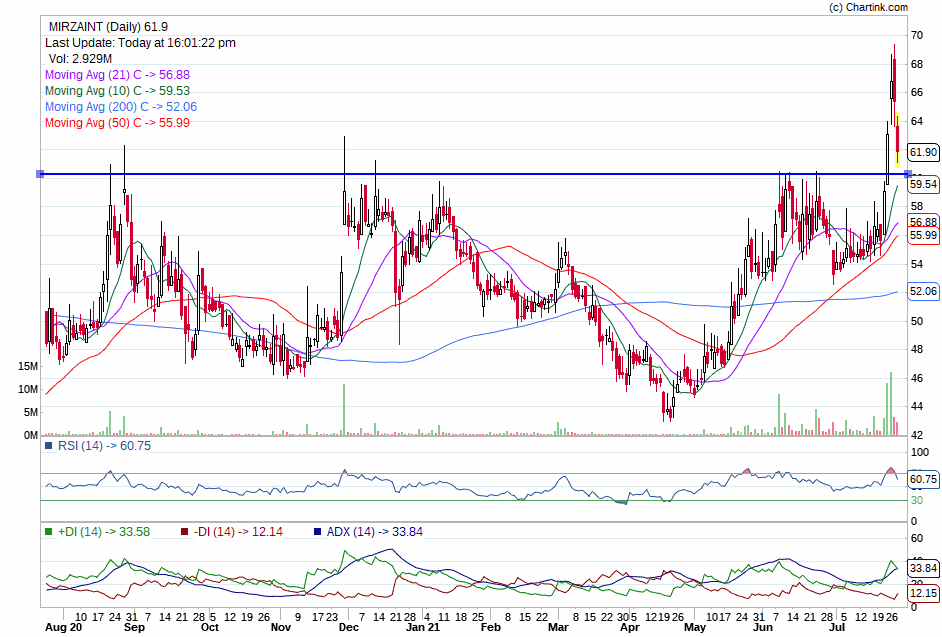
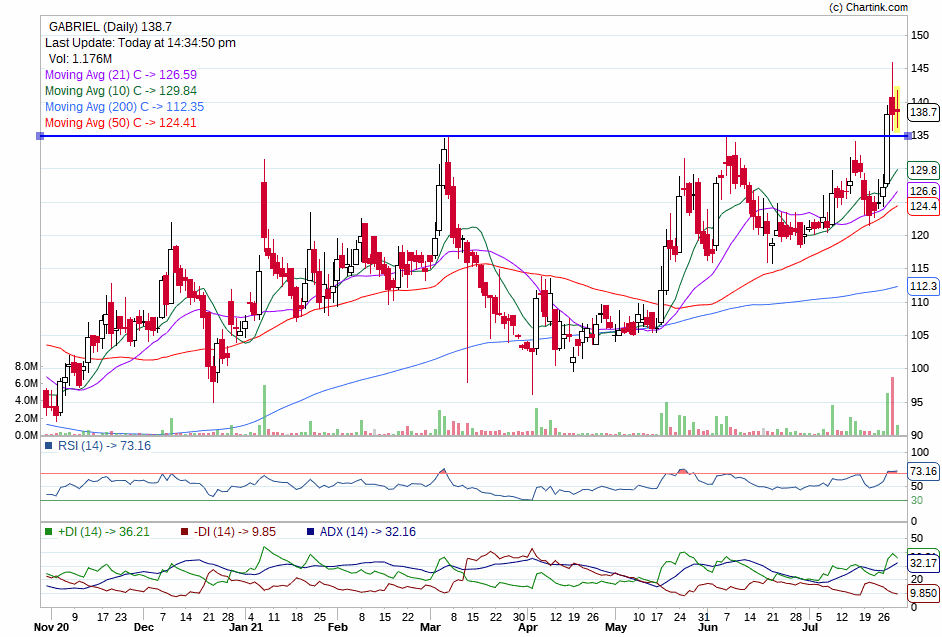
In Breakout range with whooping RSI
CMP 138 Tar 155, 165 SL 130
Range 135-140
Disclaimer: Please do you own analysis. Sharing for educational purpose only
Not very sure, whether we are serving the purpose of the thread. Technical analysis with fundamentals. A chart has no meaning per se and is subject to interpretation. Are the fundamental of safari business backing the chart ?
Sometimes fundamentals are not obvious
They are not in the financials even
Safari could be rallying due to possibility of ease of lockdown and subsequent higher travel business
When coffee prices were high internationally coffee companies like tata coffee did well but there is a time when the stock is not ready
Coffee issues were first surfacing in April however the stocks are only rallying now
Same with paper board shortages, check the time they were first highlighted and the subsequent rallly of stocks
Recent Steel and yarn are other examples
The reason people are technical is so that they can capture the correct timings and sometimes even insider info
No fundamental analysis will get you that, it’s available to institutional buyers and the only way to get it is to observe technicals
Hey @edwardlobo - This is very true but I have one reservation on this. I have noticed that the hit rate is relatively low when following just technicals because the market is rampant with manipulation - we end up with a variety of fakeouts both on the upside and downside. To improve odds of juding the direction of move correctly, I believe having a fundamental backing helps - this helps sit through as well in sideways movements when there is favorable upside valuation available. Having a variant perception (what’s changing or what’s about to change in the business) along with the technical setup helps buy even prior to the breakout - something pure TAs would advice against.
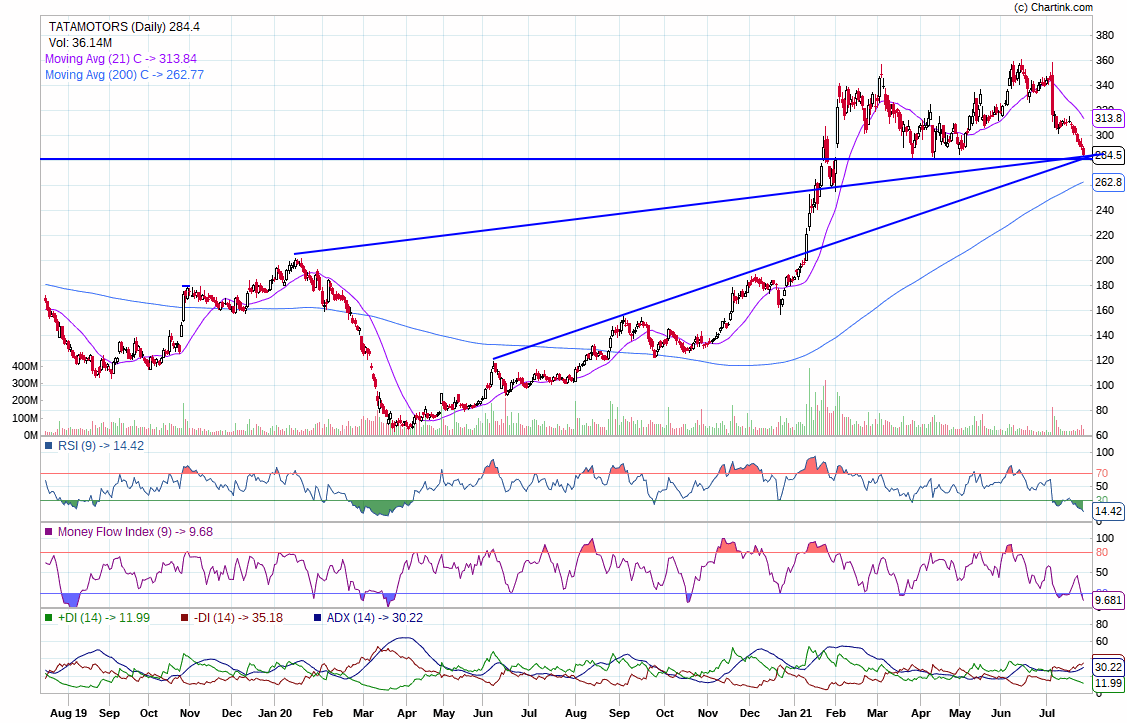
We are all trying to improve our odds of success here and that’s the bottomline - when we have better odds, it can let us bet higher - For eg. instead of a 3% or 5% technical position, you can bet a 20% technofunda position or even higher when everything aligns eg. Neuland, Polymed, Thyrocare, Tata Motors, HIL, KNR, Deepak Fert, Thirumalai, Fluorochem etc. (all posted in this thread at some point) had great technical setups backed by phenomenal fundamentals and valuation backing - the funda component helps improve conviction and hence the allocation. There are some where technically it looks good but fundamentals are still a bit dicey - like Bajaj Hindustan or Vodafone Idea for eg. - you tailor allocations accordingly there. This way you are a fundamental, technical and value investor - all at once.
For all you know I might be doing this wrong and there may be a better way, but this has worked for me and helped me stay put with the trend or reduce/sell out when odds of making incremental returns deteriorate (knowing what’s in the price). Also it is easier to fish with any technique when there’s a lot of fish (as in the last year or so) so this is no reason to believe techno-funda is the only way to fish but I believe its the equivalent of angling with a rod, hook, line, sinker and bait - works under most circumstances.
What I meant to say is that just because a technician doesn’t know the fundamental reasons they shouldn’t shy away from posting a good setup
The safari setup I didn’t like per se as it fails on volume
Most the the companies you mentioned had very very strong fundamentals written on the annual report itself if someone were to read all annual reports, which I do as they are published. Not back to back but atleast the management analysis and directors reports
But fundamentals where the sector itself has changed the fundamentals are hard to gather and read and much harder to time
The two ways are slightly different. One starts with fundamentals and waits for technicals to develop and the other starts with technicals and searches for fundamental reasons
Nothing is right or wrong and in a bull market as you said there are plenty of fish
Almost all technical books I read first and foremost insist that one trade only in the bull market whereas on fundamentals one is a bit brave to be broad market indifferent
Case for fundamentals was Gujarat themis that did wonderfully well in a bear market but I am not sure if the chart setup would not have lost among all the other false charts
When the cycle turns the technicals are usually always the first to catch it. Although fundamentals might be extremely strong the technicals will fail on support points when the market turns from bull to bearish
A fundamentals guy will stick to his guns as he would have fallen in love with the story but a pure technical person will cut short his losses
In theory the pure fundamental person would study macro economics and probably arrive at the same conclusion but the are of study is so vast compared to a study of technicals
In reality any performance is good only if it’s better than the broader market performance otherwise all the study is of zero use. One can simply invest in an index fund. It that is true and you look at something like amibroker and chart relative strength (not rsi), almost all companies that have performed well have zero fundamentals. Look at rajapalayam for instance. It’s outperformed but has zero fundamentals, all it’s fundamentals are based around the sector expecting to do well
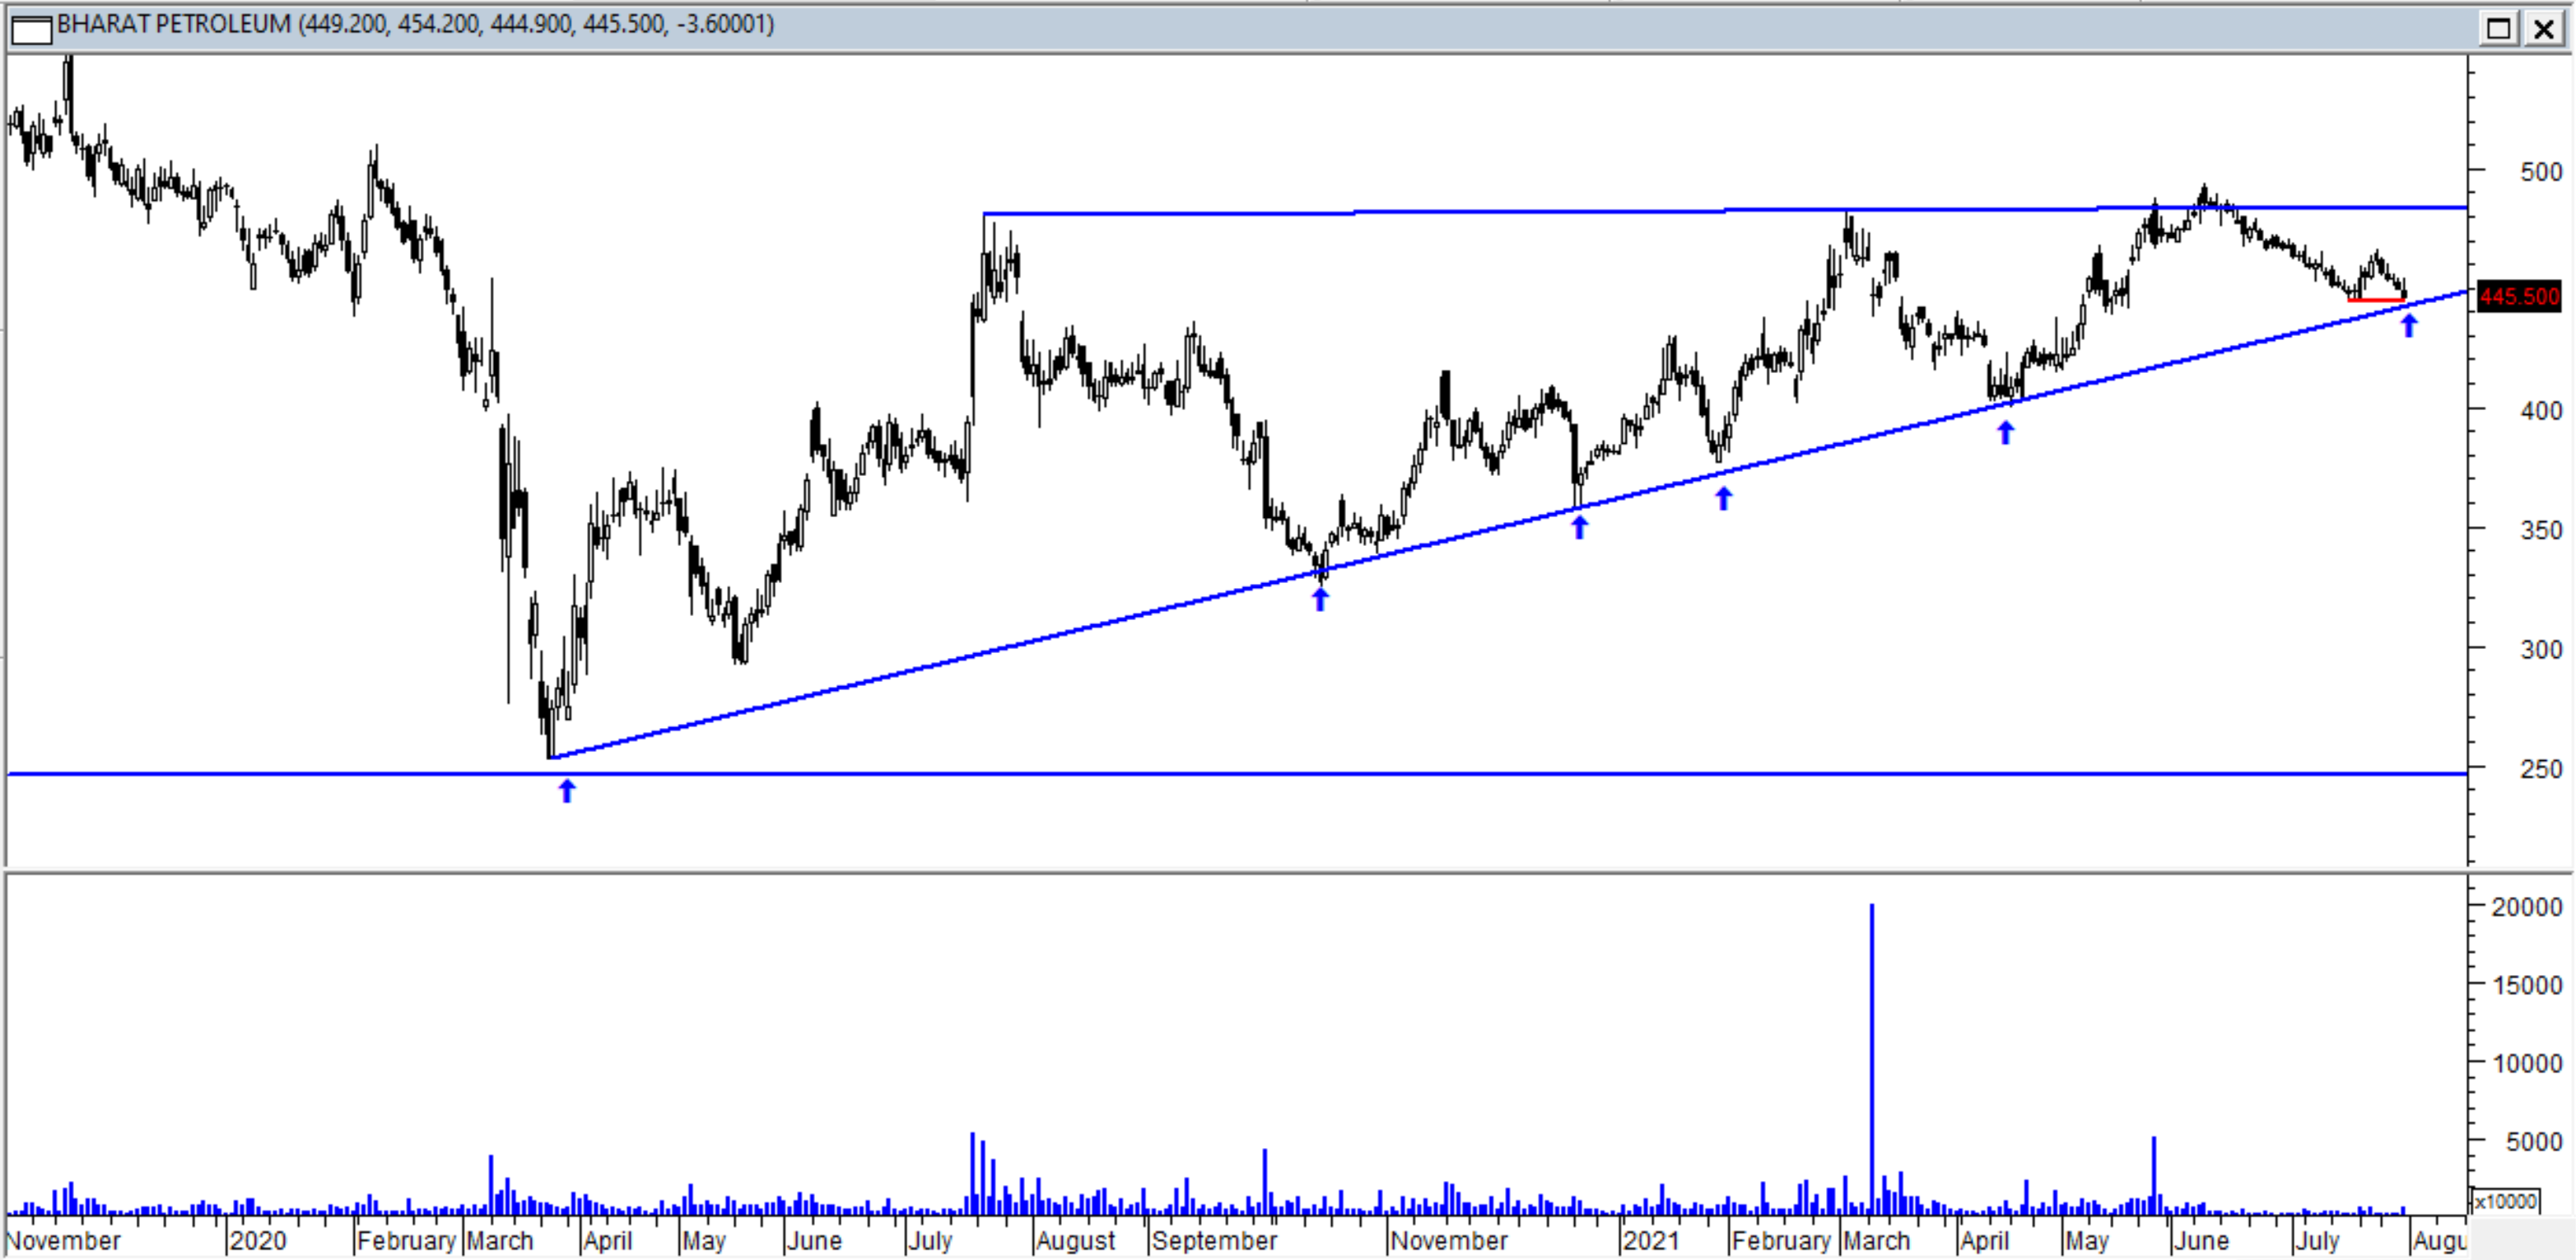
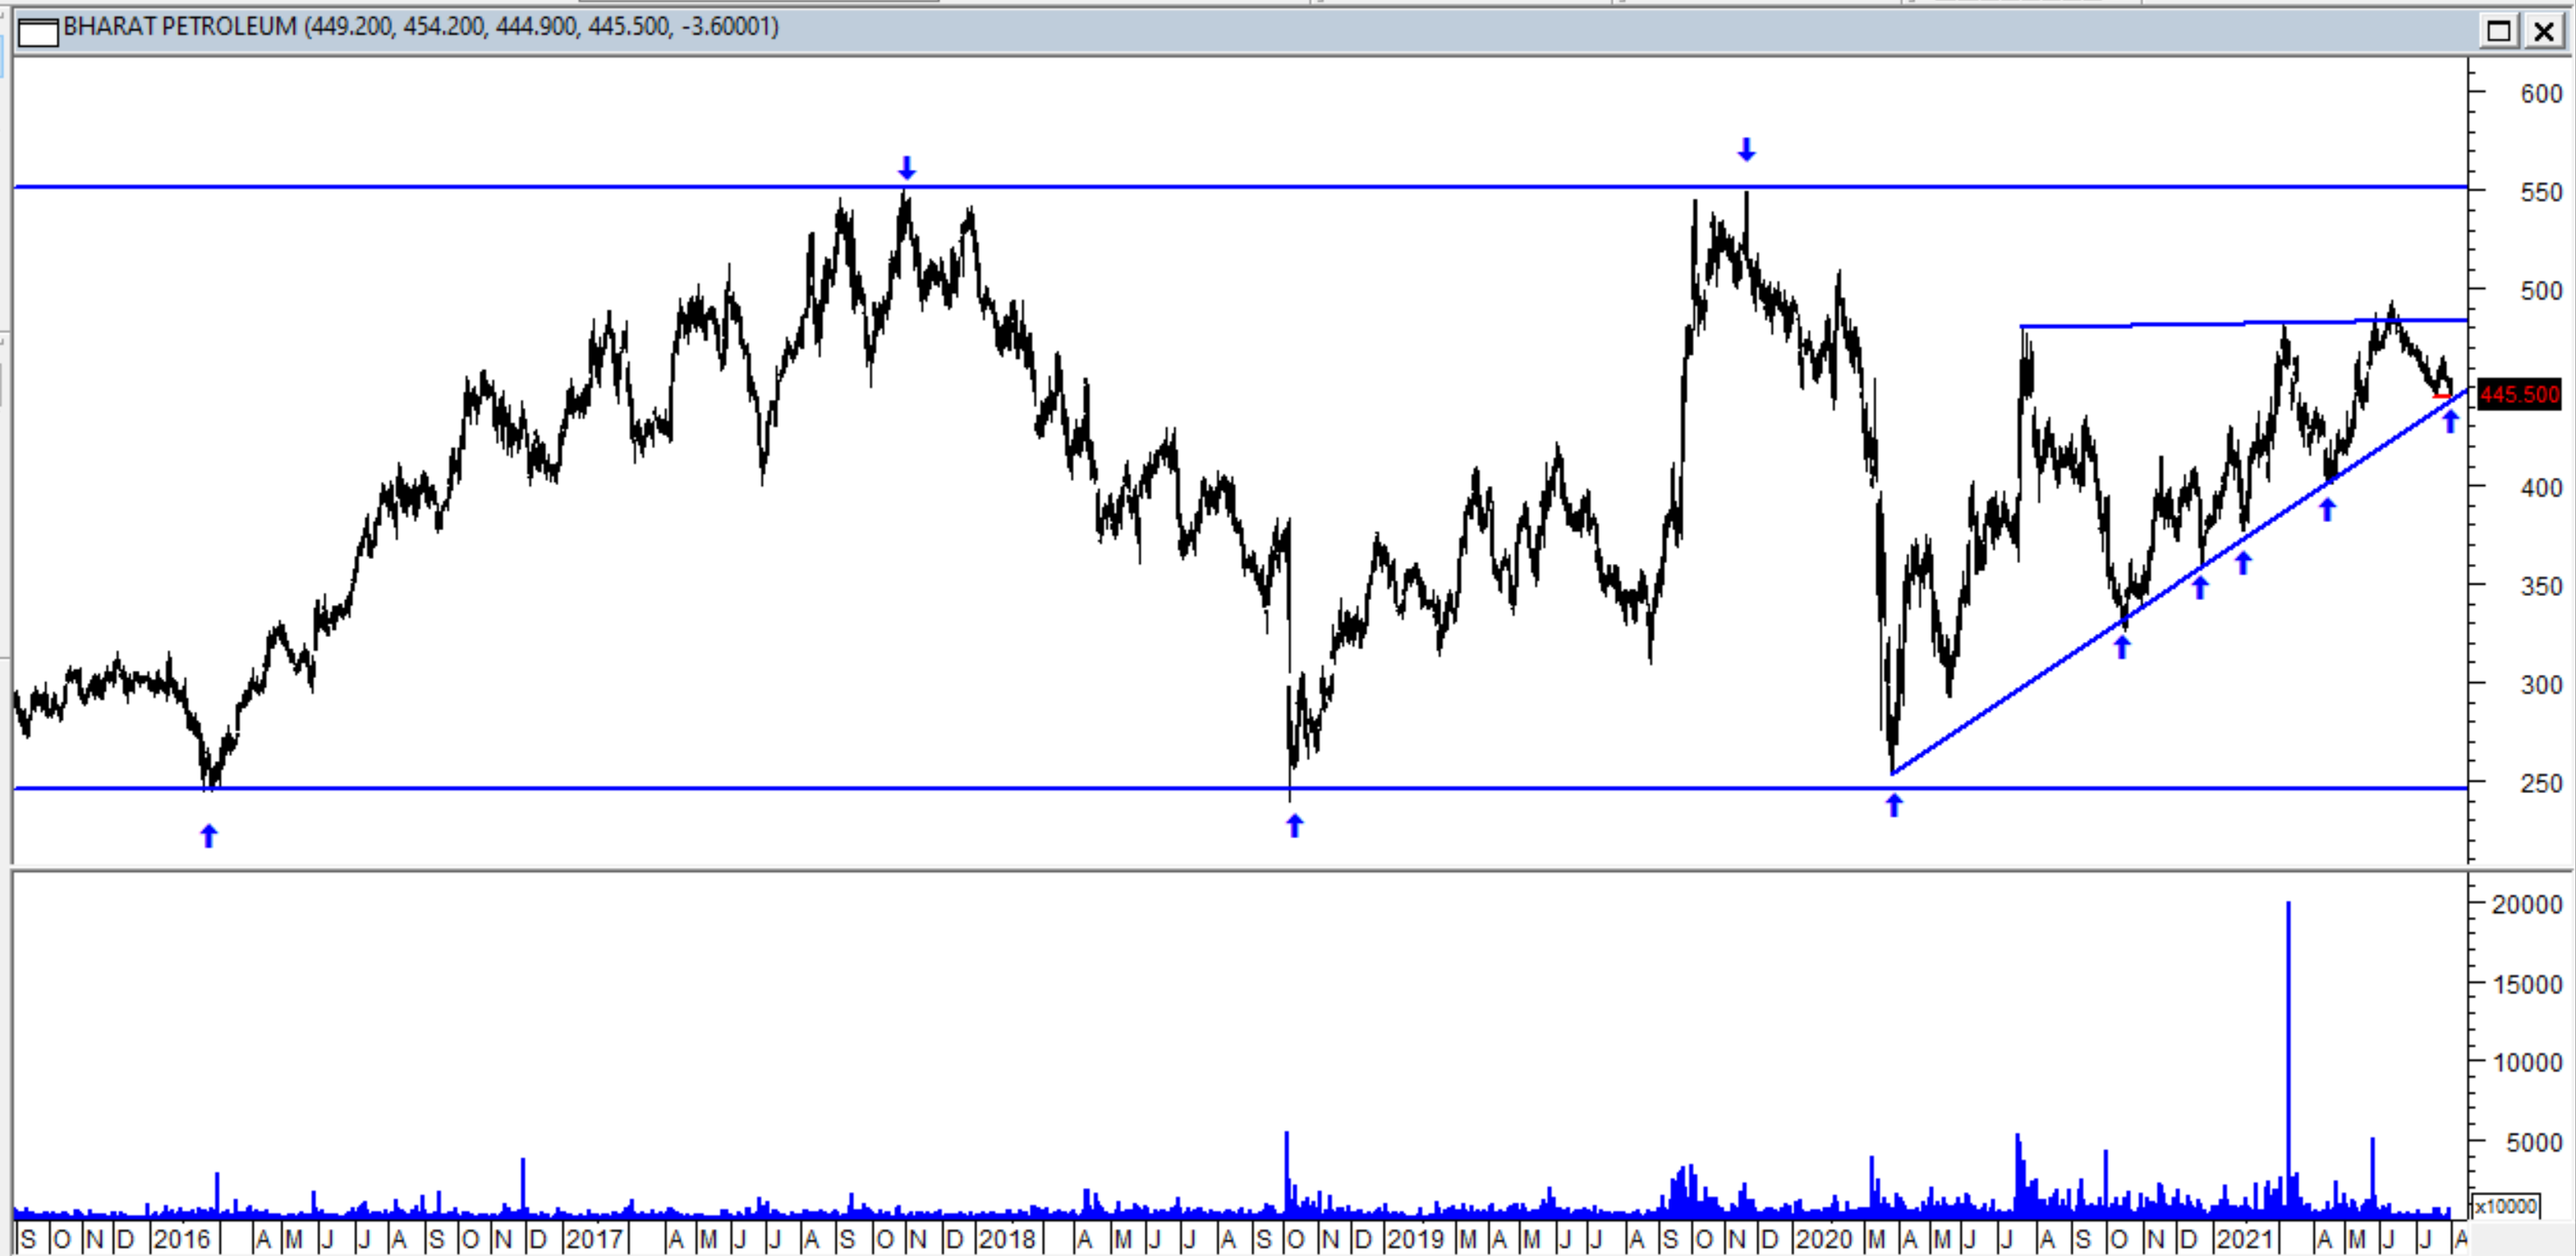
BPCL has formed an ascending triangle pattern. Interestingly, the stock is at the support trendline and it had held the current level of 445 on 15, 16 and 19th July. Now IF it bounces to above 465 levels, it will also confirm a double bottom. Ascending triangle BO will get confirmed above 485-495 levels.
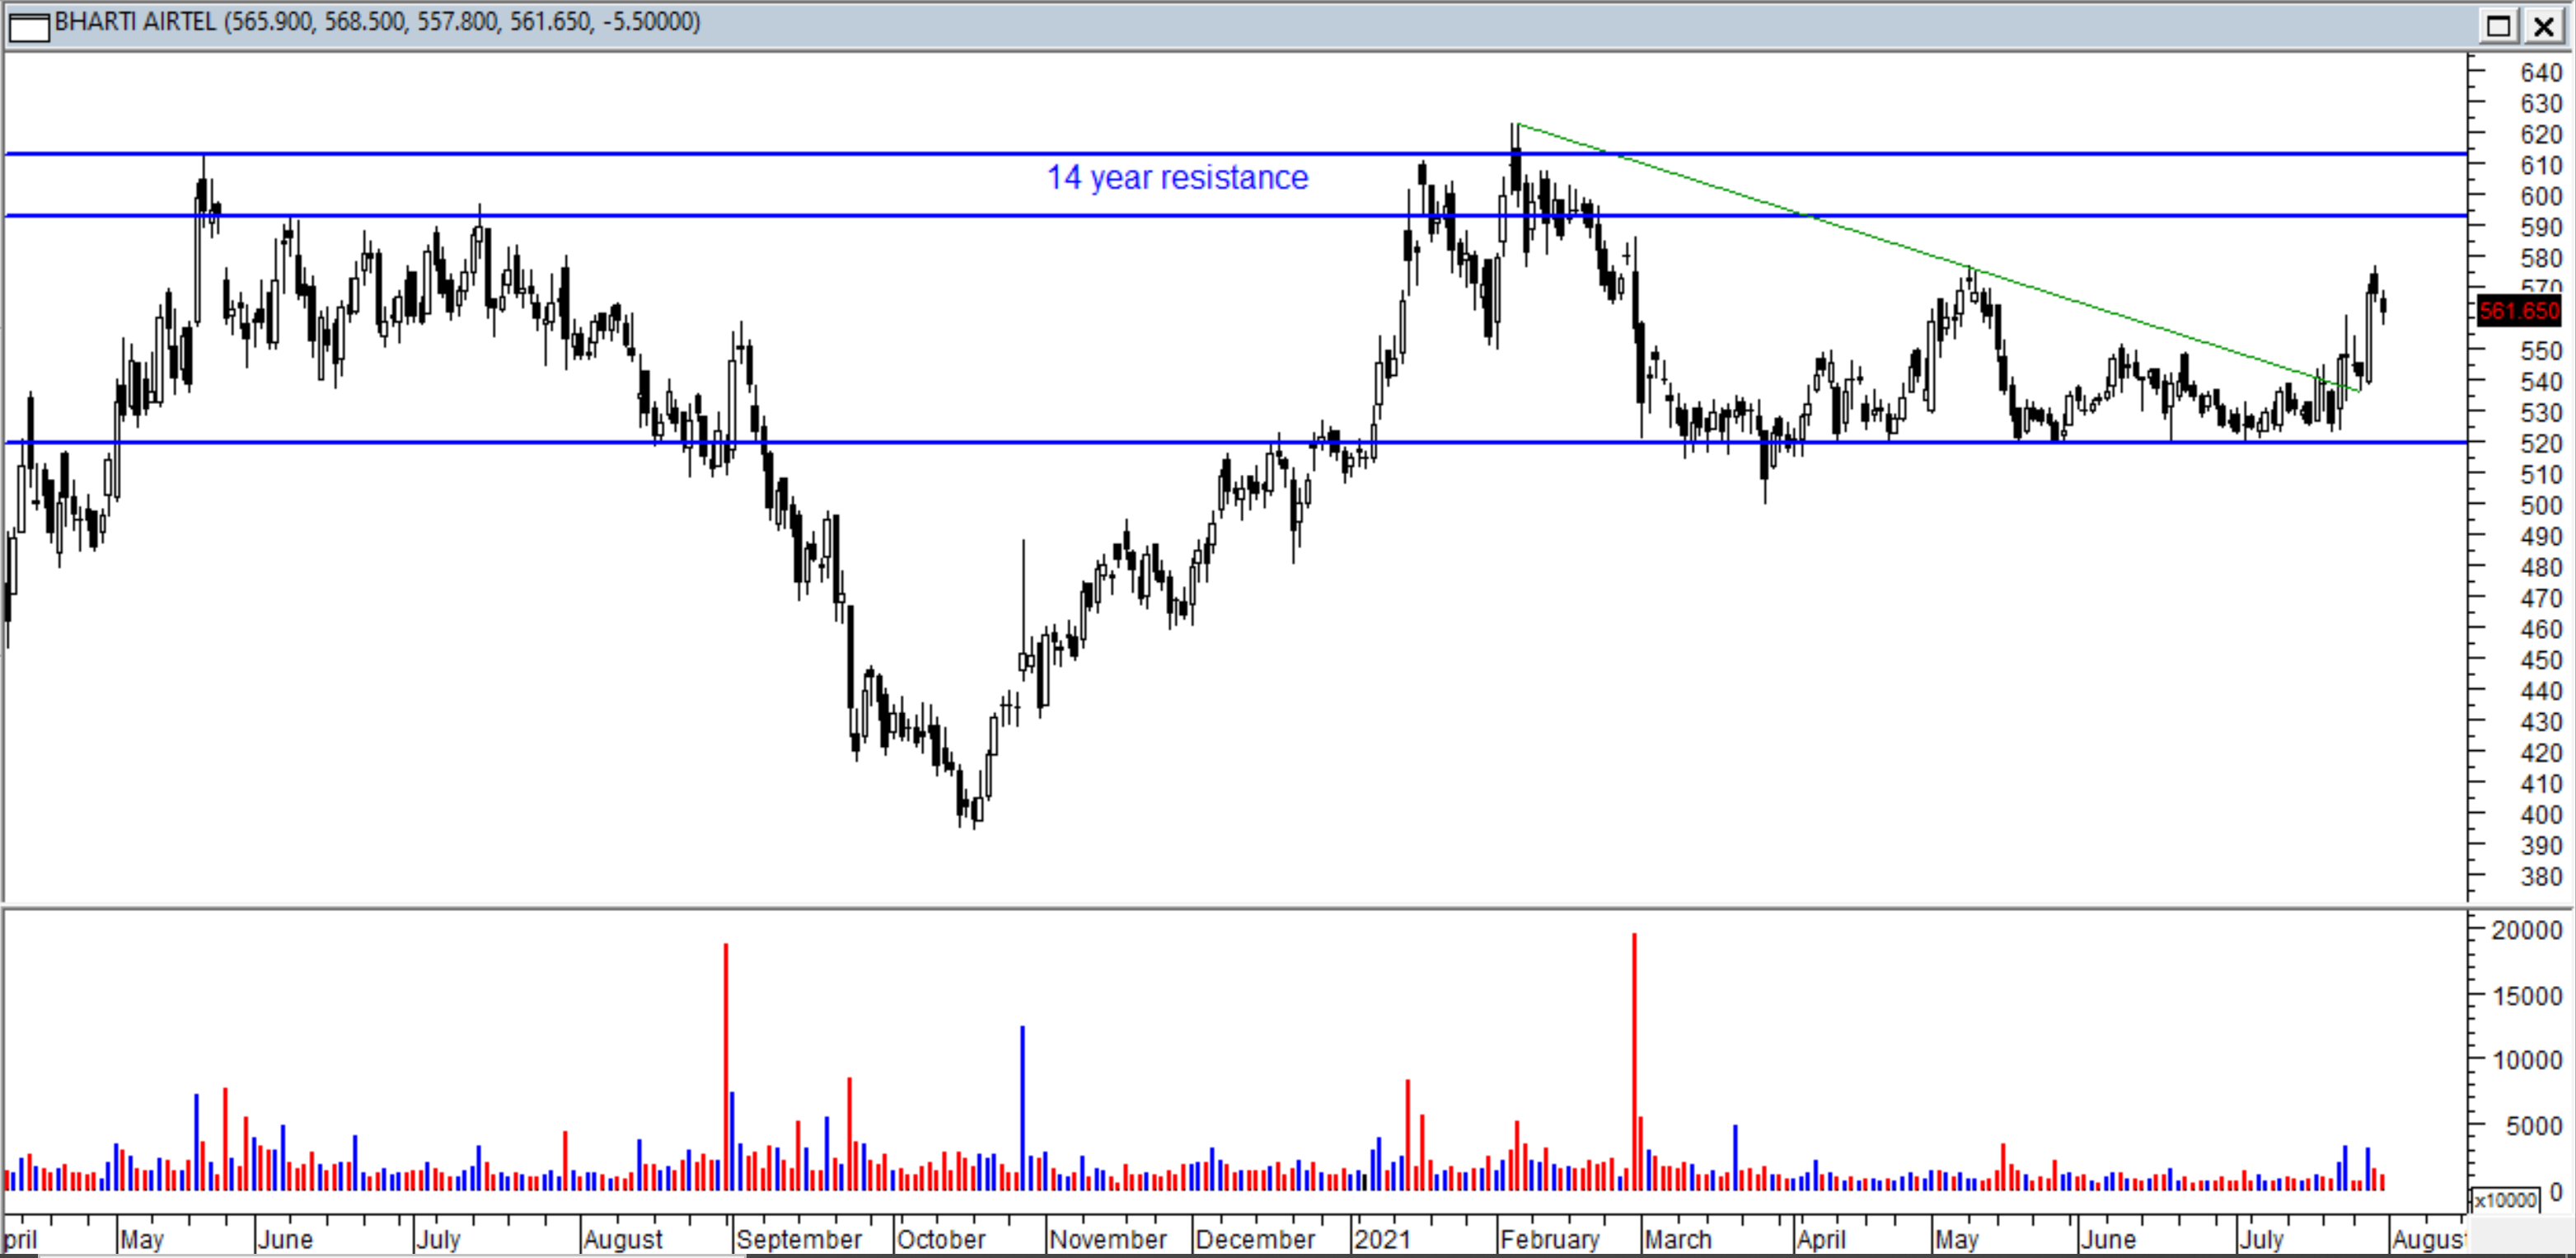
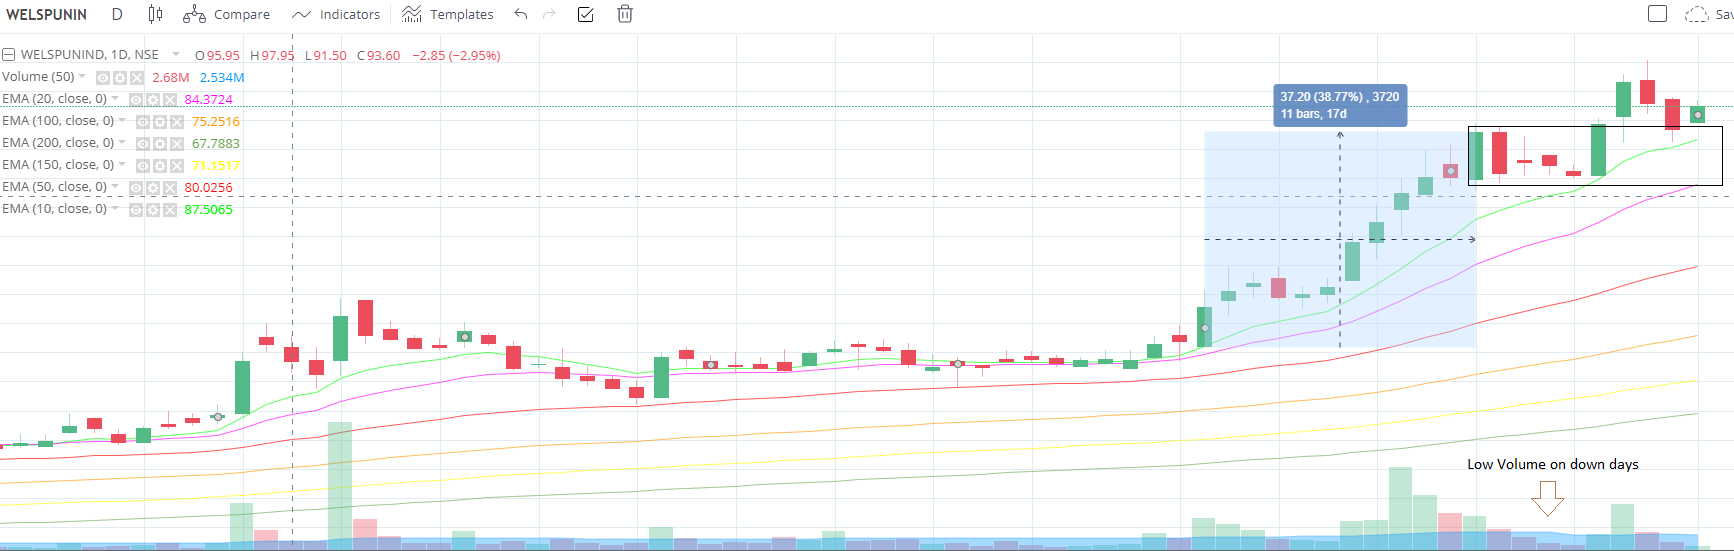
Bharti Airtel formed a good base around 520 over last 6 months. Few days back, the stock broke out above the green trendline after news on increasing tariffs for corporate plans and entry level pre-paid recharge. This is a clear signal by Airtel that it will not wait for Jio to hike rates. The volumes are higer on up days and lower on down days.
There have been multiple attempts at 590-615 but the stock hasnt been able to cross these levels. It will be interesting to see how this moves.
Discl: I have a trading position. Sharing the charts for educational purpose
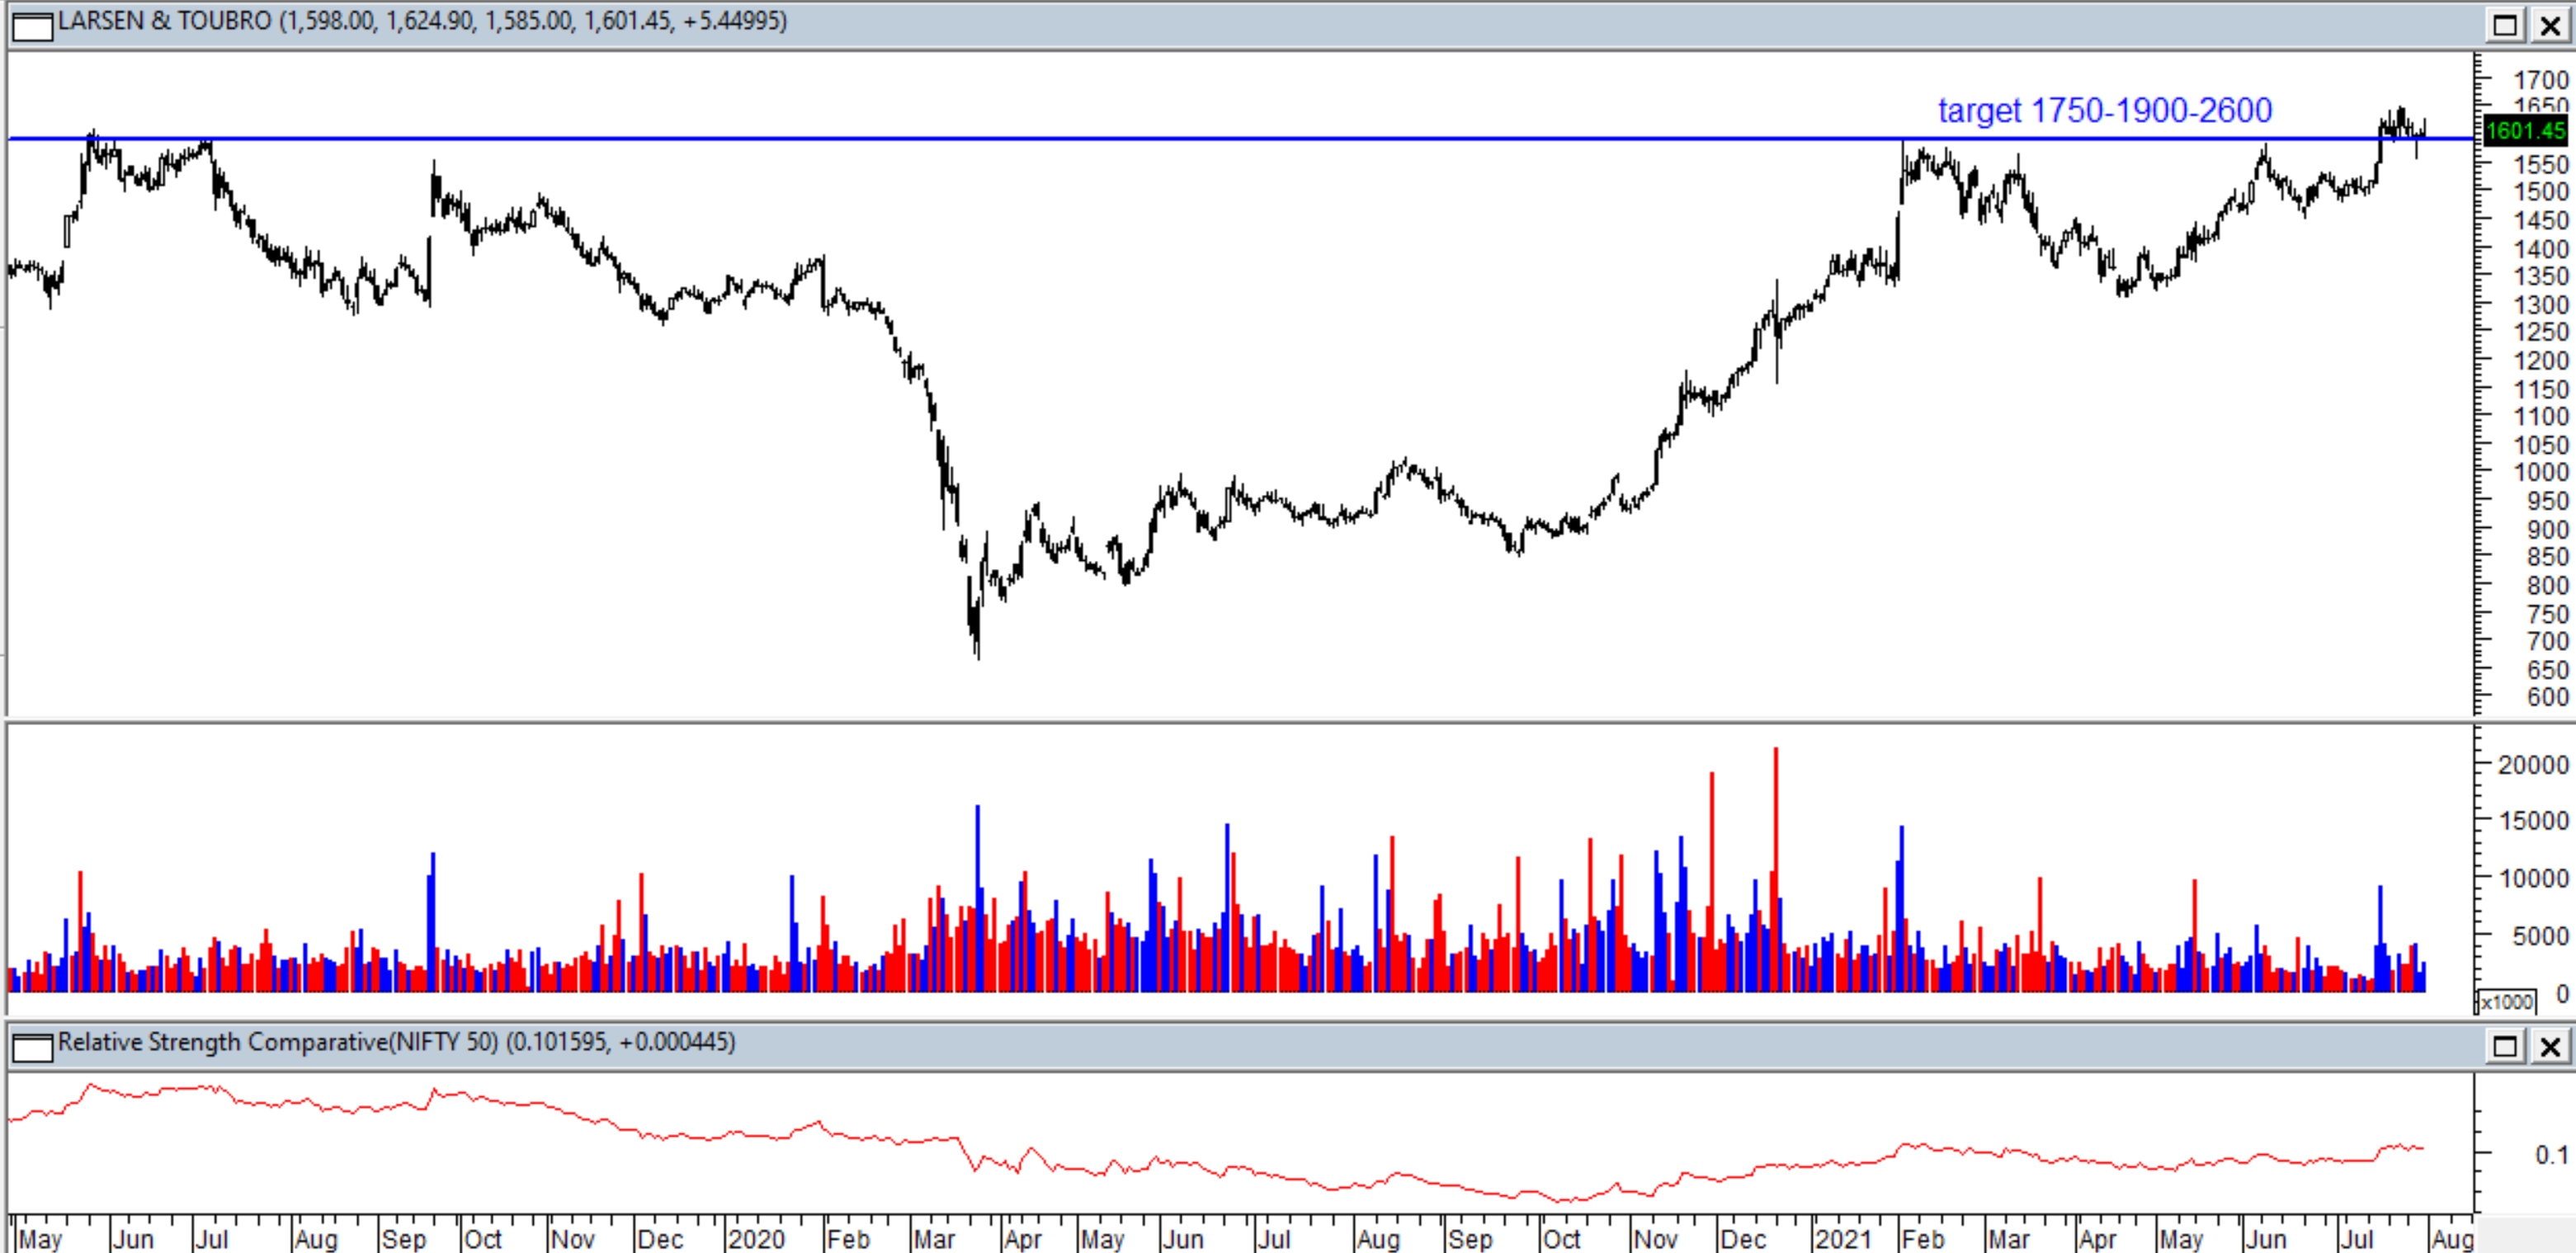
L&T has a classic Cup and Handle pattern on the charts. It broke out above 1600 with decent volumes and now pulled back to retest that level. A similar pattern playing out in SBI Life