I have identified certain good stocks for short term investing and explained the TA behind it. We are near ATH and hence be cautious. https://youtu.be/zXEC0O76JFM
When I identified Apollo Pipes yesterday, I never had any view that it will go up 17% today. But I thought it is a good set up to buy. Sometimes it happens. How one approaches the huge upside is individuals choice - his money management, risk management, return achieved, enough attitude, etc. Here nobody including me can advice you correctly. That is beauty of markets. But bottom-line - system has shown the way
I have different opinion based on scullbutt as I had my batchmate working in polyplex Indonesia earlier to this he was in turky . I was tracking the sector and i asked him if your company has single silver bullet to shoot indian competitor to whom it shoots to without wait he replied Jindal poly … yet ihe said the raw material has escalated a lot and so is price of final products but one must wait … as this up move won’t be sustainable even for shorter durations… I may be wrong but one must be cautious for the companies in this sector … second the production capacities are more than the demand and some more additional capacities are coming in ti play . THIRD which is most important is that alternative Materials are in R& D tunnel and companies with fully backward integrated operations will leads… I am not an experts it is just small scullbutt from the industry expert who is in same industry for more than two decades of technical experience however I may be 100% wrong in my interpretation…
Regards
https://youtu.be/xq2qzzkSxCA Week end learning for Investors from how Mindtree has recovered from the lows and how one can use TA to buy good stocks with confidence.
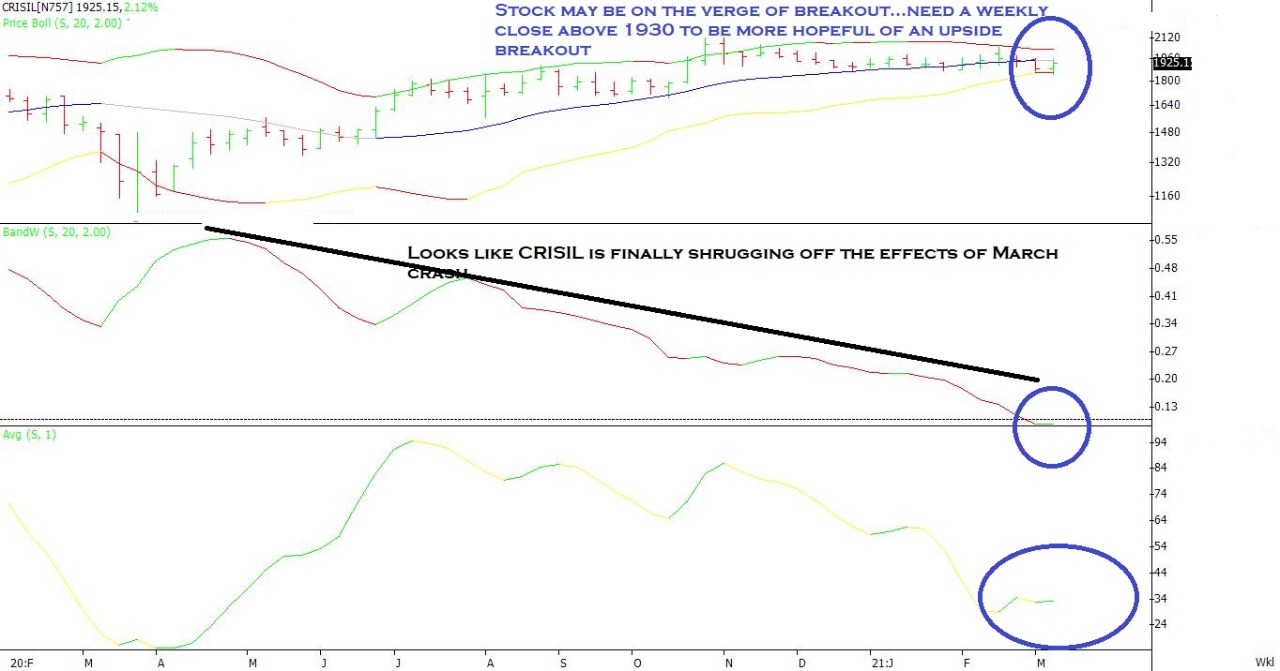
Here is the half yearly chart of CRISIL with Pitchfork…the price movement is quite well mapped by the pitchfork and that gives a good upside target for CRISIL…
The following points may be noted about CRSIL long term charts.
It has tested and bounced from the support on 4 times during the last 3 years
The bounce has been preceeded by a very strong 3 bar bullish divergence on on Half yearly and quarterly charts
Stock has formed a double bottom on monthly charts and subsequent to that there was an upside breakout on monthly charts and in now in post breakout sideways movement / base building process…
On weekly charts crisil is about to shrug off the effects of the March 2020 crash and in now under bollinger band volatility compression. A close above 2050 indicates that the long term rally in CRISIL has started.
Discl…Invested in CRISIL. For me this is a stock with very strong fundamentals…very low paid up capital and very low float…market leader and with almost nil default by CRISIL rated bonds…very stock as it has very good support @1500/ 1700 and almost nil risk of permanent loss of capital…and very good upside potential of 8000-10000 over long term…it meets all the requirements of an ideal investment
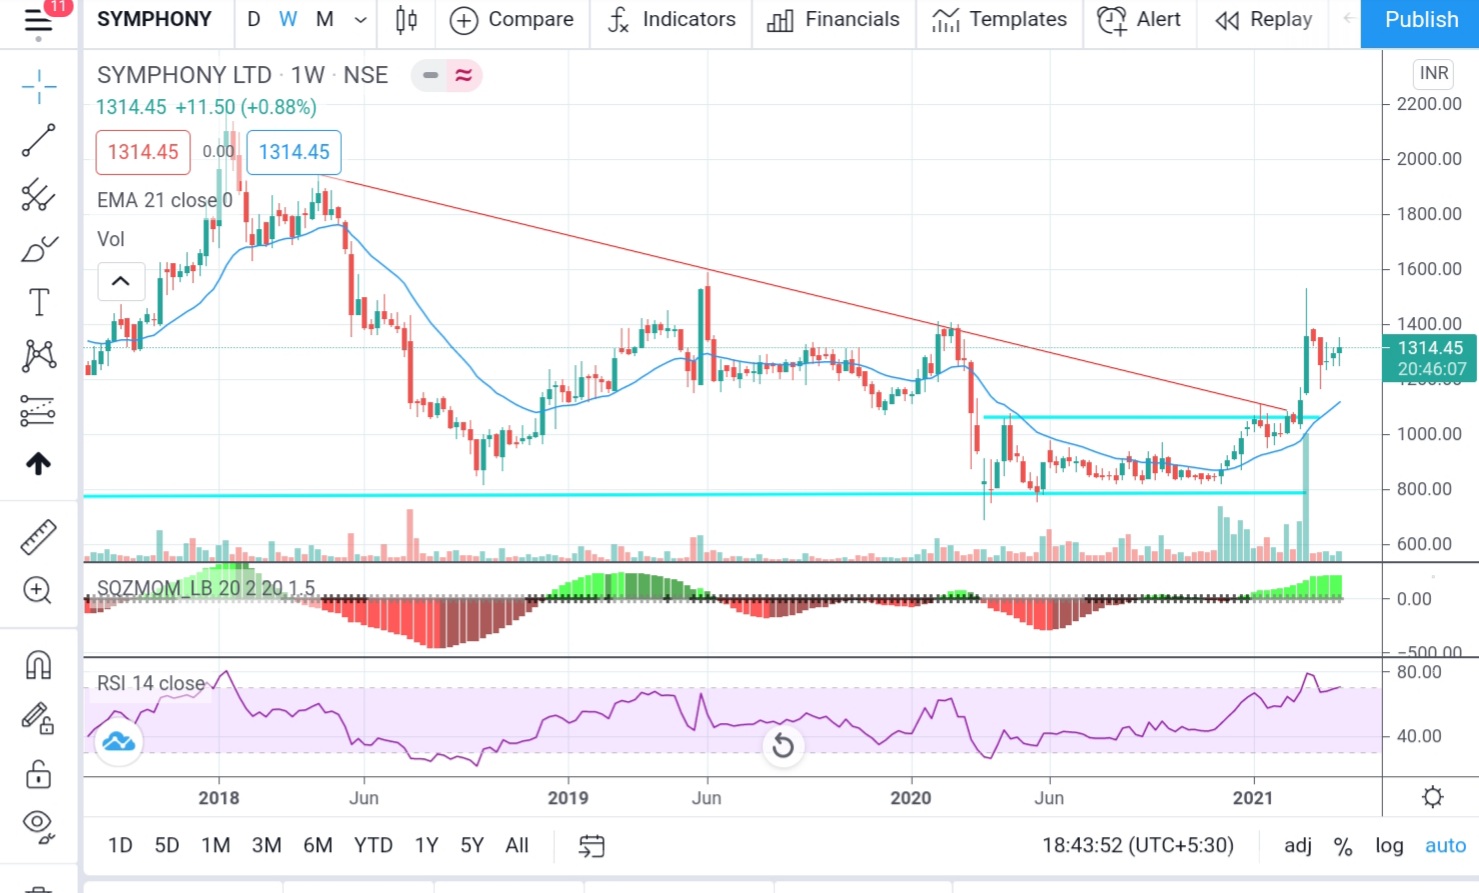
Symphony has given multi year downtrend break out with good price volume , on back of good summer demand in India and turn around in global subsidiaries performance - if past glory were to come back and sustain, it has all ingredients of high performers ( asset light, high quality mgmt, return ratio etc) - as they say technicals lead fundamental…Q4 likely to be a good performance ( low base and derating over last 3 years - low expectations), recent concall from mgmt were not conveying aggressive growth but let’s see…
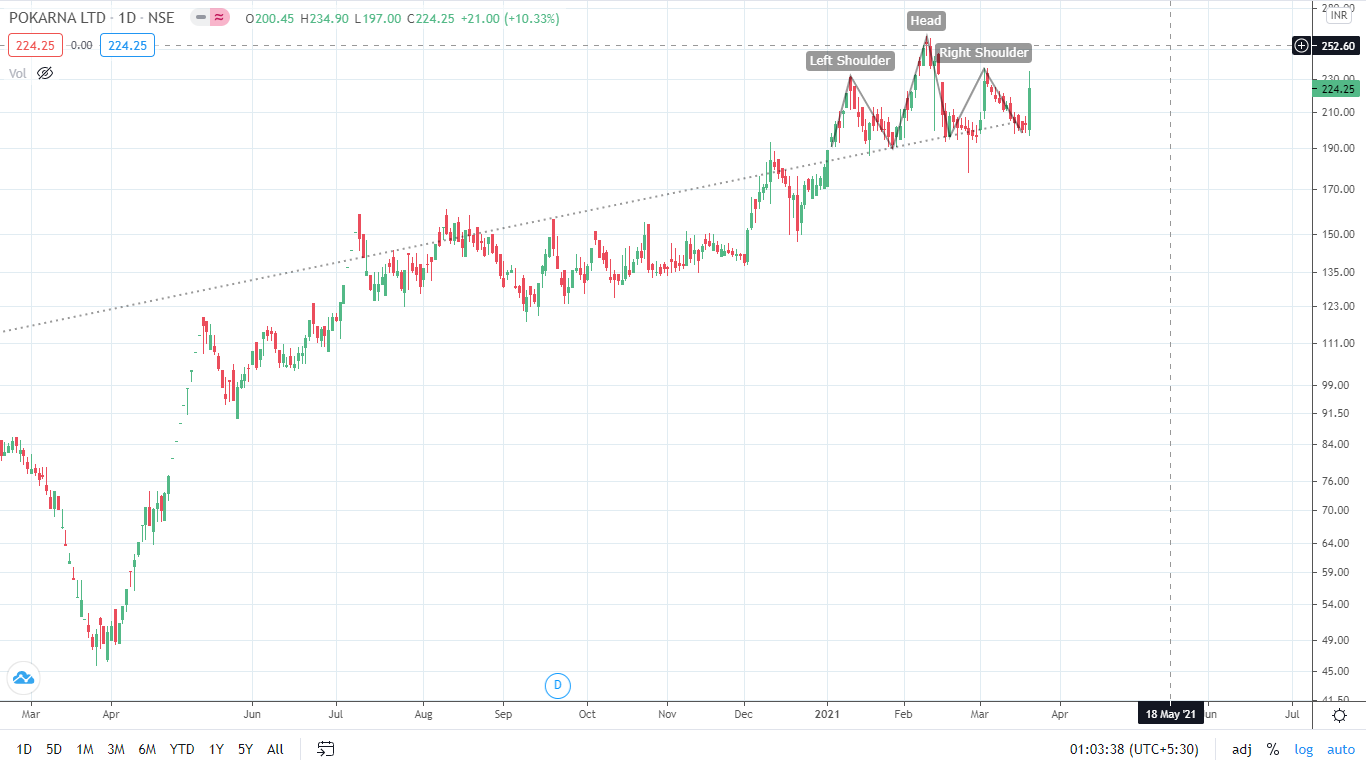
A picture perfect failed H&S with heavy volumes on the pokarna daily chart. Good example of a bearish pattern suddenly becoming very bullish. Fib trend based retracments suggest a target of 265-275. Medium term target of 400 odd based on the same fib trend based math.
A good bullish butterly seen on the colgate daily chart. Harmonic patters are rare but very successfull in my experience. Pattern target is 1800-1900 in the medium term - i.e 3-4 months. Colgate also has historically given a bonus when the stock price has touched Rs 2000
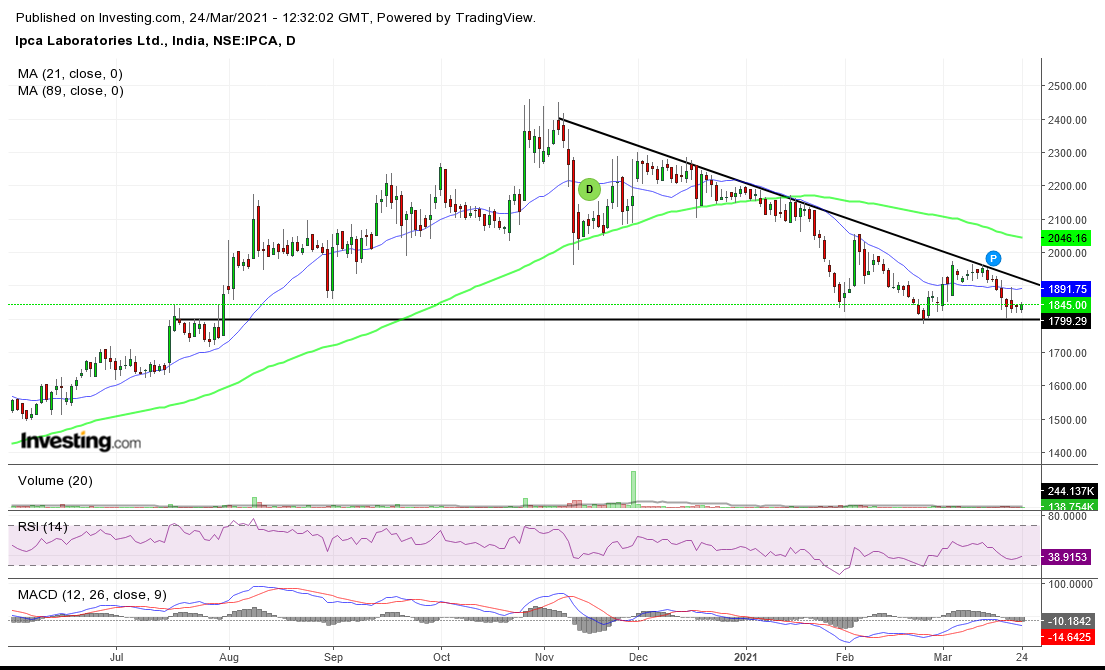
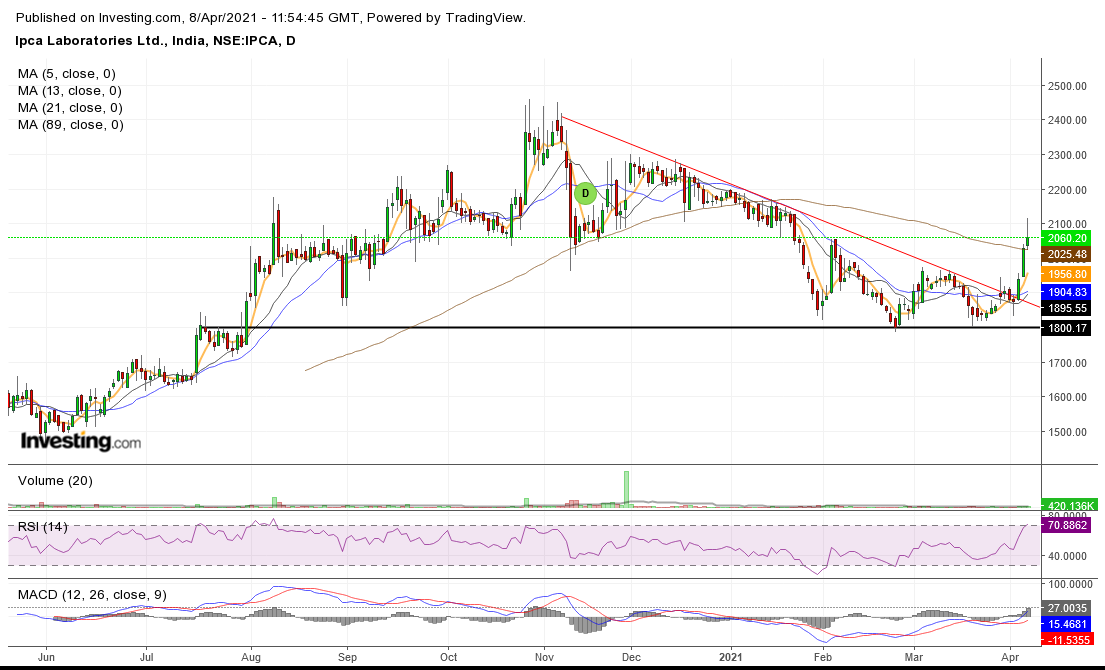
IPCA Laboratories is looking good. The stock is taking a support at 1,800, a decline of 25% from top. Also, stock is taking multiple support at current levels, while RSI is showing strength. Company has reported good numbers in recent quarters, so it seems more of a correction. Views are invited.
Thanks Kartik for sharing your views. I agree with most of your views, especially that the major support could be near 1625-1600 range (if 1800 breaks) and one should jump in once the stock breaks the 2000 level, so will not have to hold the stock for long.
However, I don’t agree with your historical run-up point. If you will check the financial, Company has reported very good numbers during this phase. So, I believe run-up is justified.
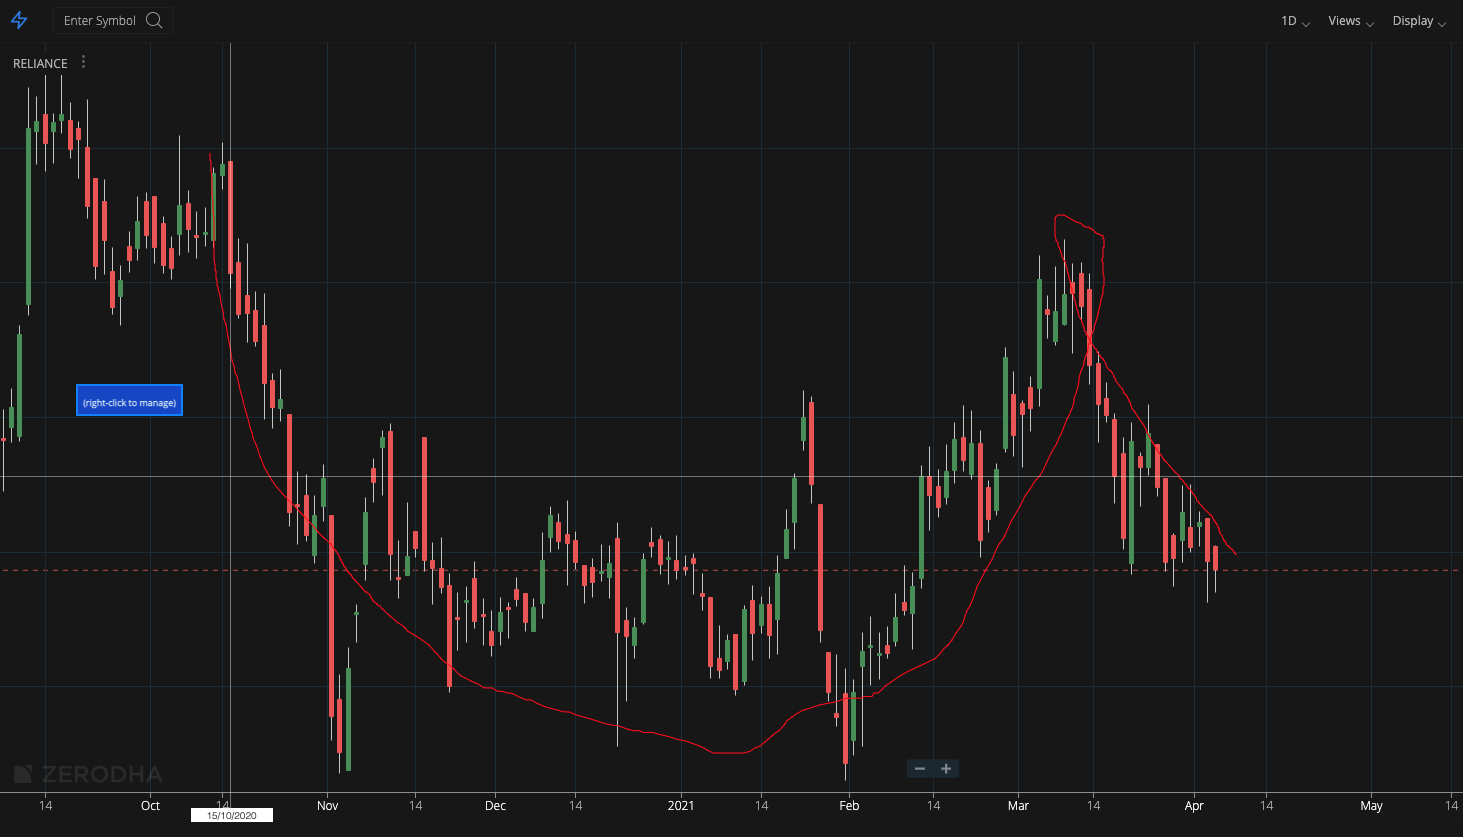
Reliance daily is forming a cup and handle formation. Issue with handle is that it is very deep but at 61.8 retracement of last wave. Watch for breakout.
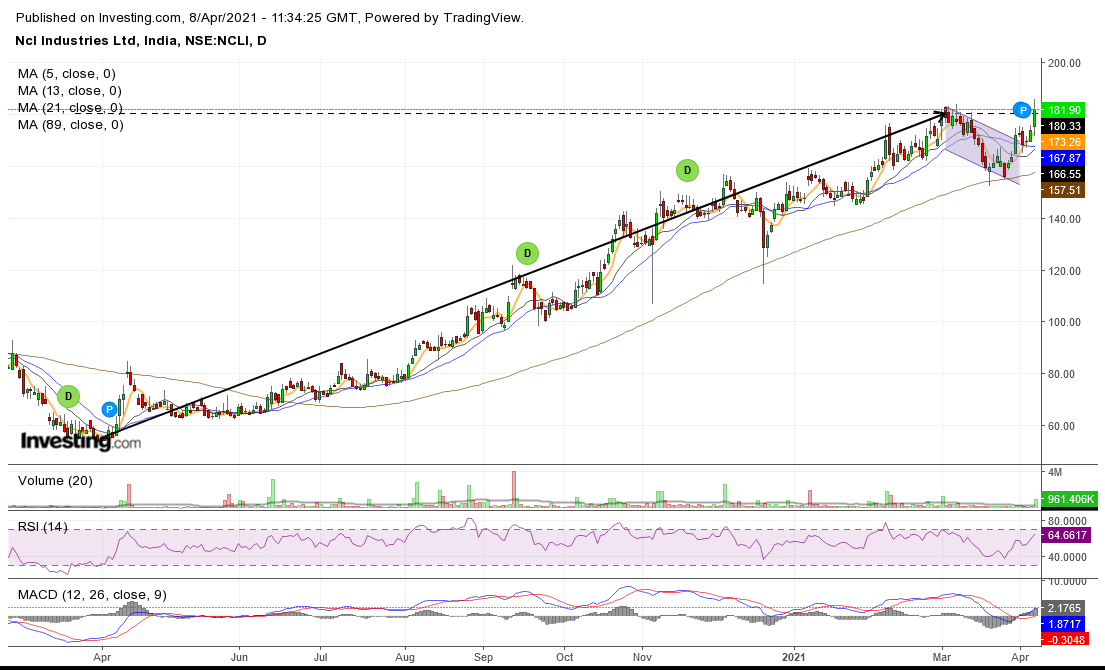
NCL Industries is looking good. The stock is in uptrend, and I believe it has taken a flag breakout, Next Target would be around 300. Company has reported good numbers in recent quarters (latest Quantity data attached in file). It is trading at lower than it’s 5 Yrs median PE. Also, Promoters have increased the stake in the last 2 Yrs. However, I don’t know why Institutions have exited the stock. Views are invited.
Update to Previous Post: IPCA has taken a breakout from a trend-line resistance, albeit with an average volume. I believe, now 1,800 could act as a good support. Views are invited.
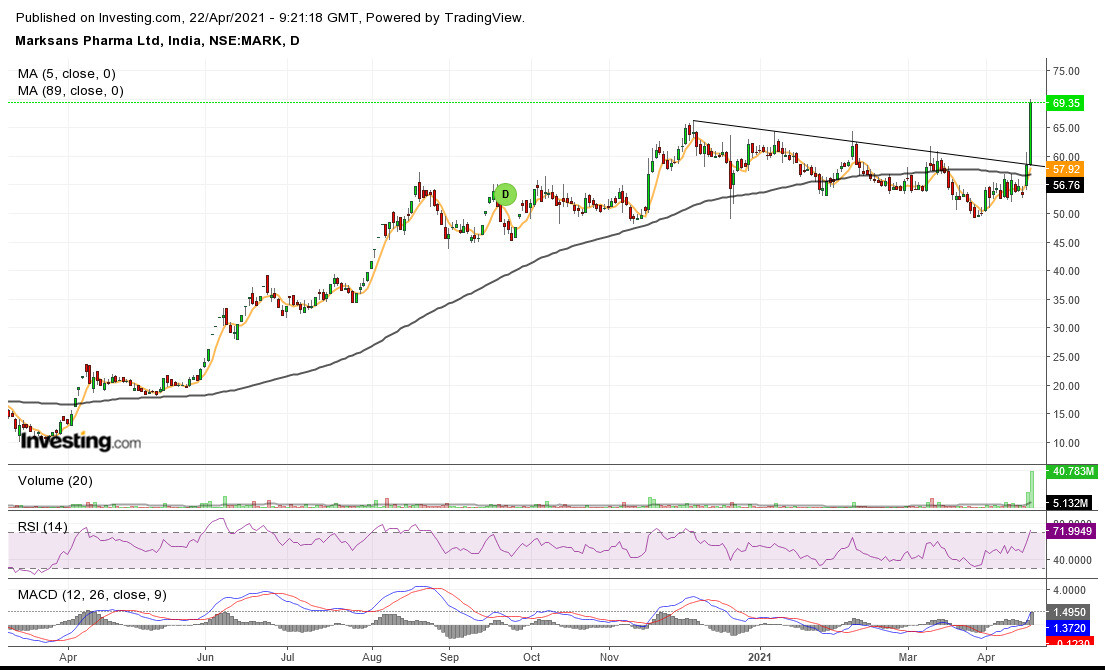
Marksans Pharma is looking good. The stock is in uptrend, and today it has given a flag breakout with high volume, Next Target would be around 110 (Previous top). Company has reported good numbers in recent quarters. Views are invited.
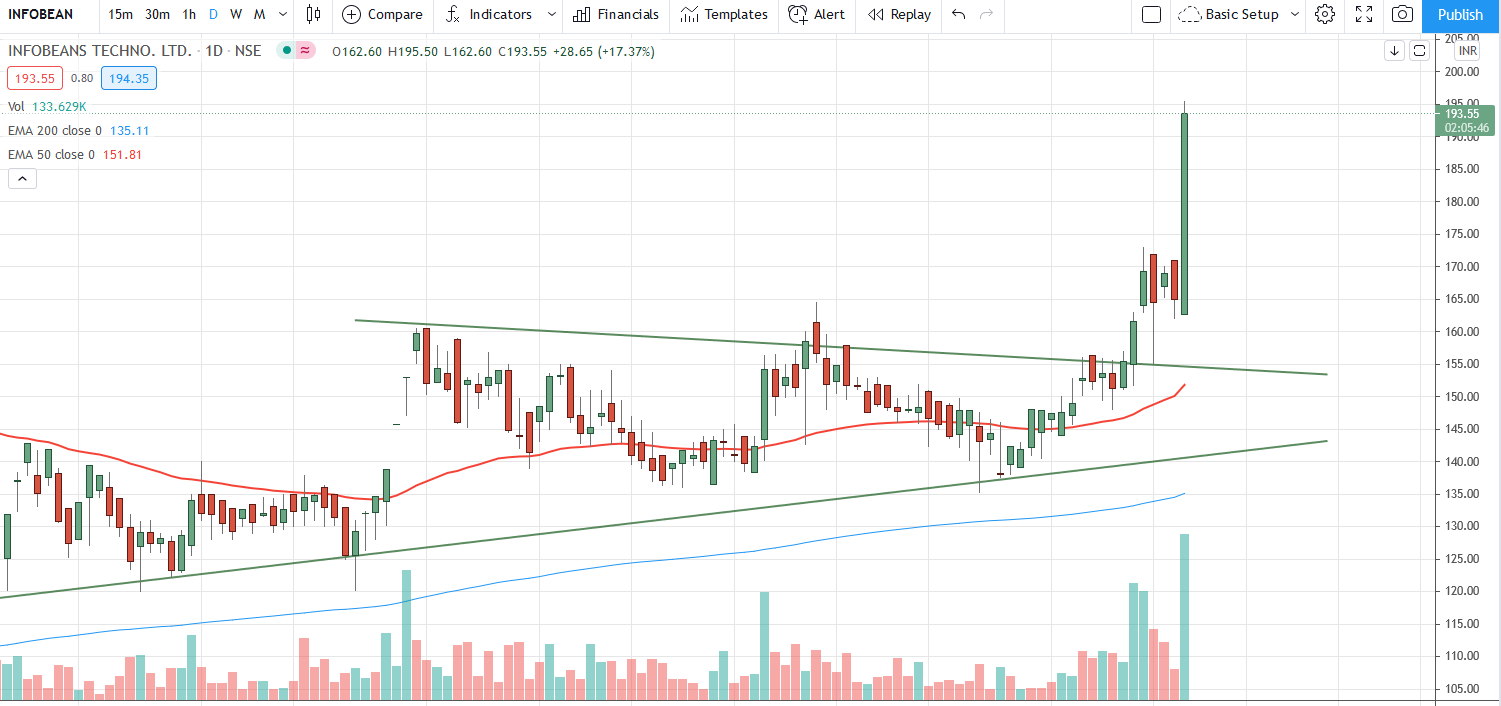
InfoBeans is a small cap IT services company that got recently listed in NSE from NSE EMERGE. I have compiled my notes on company in the InfoBeans thread.
Q4 results are expected on Apr 26th with an investor concall.