AVT Natural Symmetric Triangle Pattern
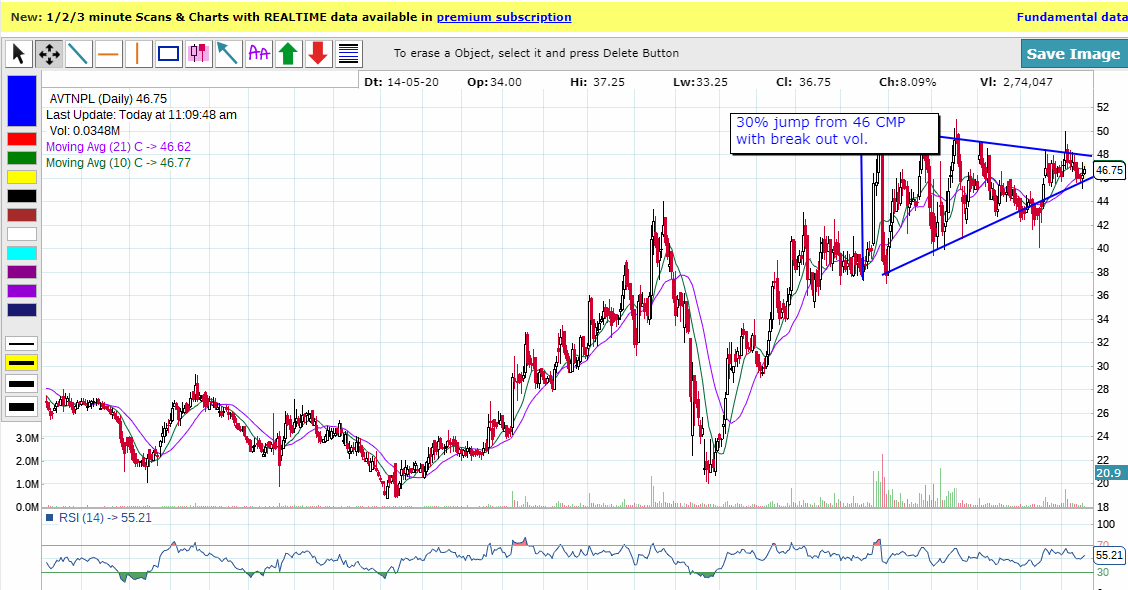
Disclosure: Invested. view may be biased.
Thyrocare daily, rising channel, a correction, doji at correction and a chance of breakout … lets see if it it happens
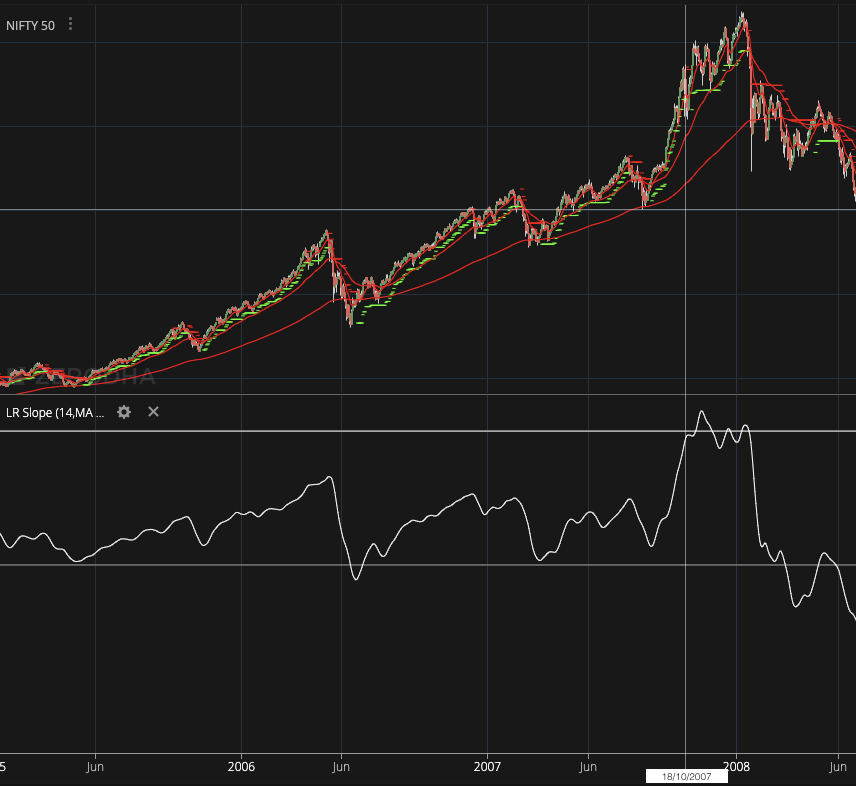
Slope of 200 ema (velocity of move) reached 20. Last time this kind of slope was seen in 2007 (it was 13 in 2007) (below chart)
2020
2007
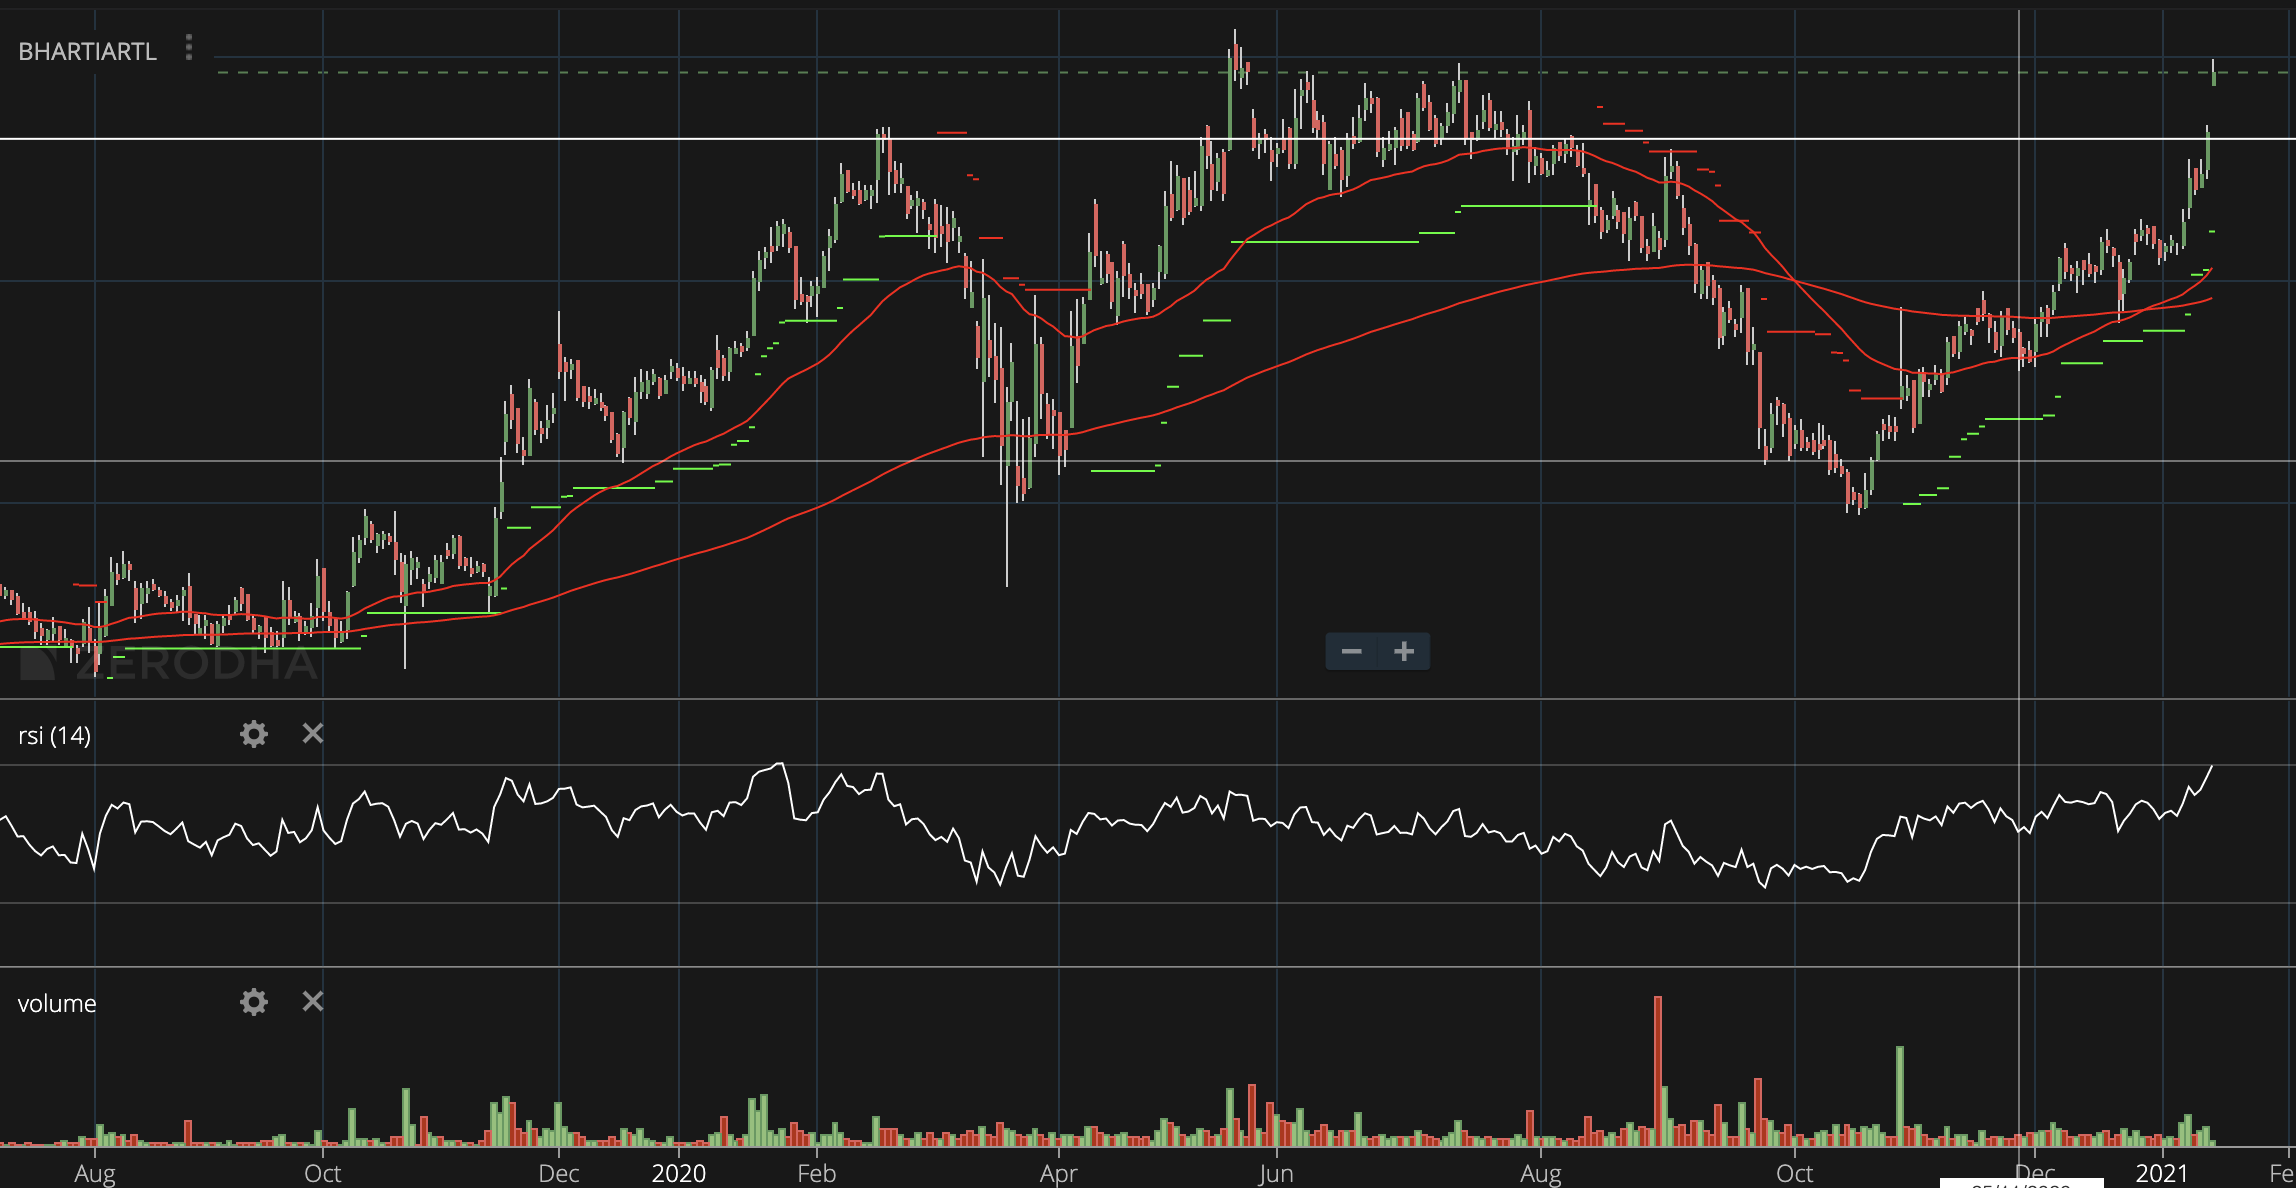
Bharti Airtel (daily). Looks like a breakout from shoulder (head and shoulders). If it crosses 600 then possibly a new trend.
disclaimer: invested
Does anybody have some inputs on McClellan oscillator and how to use it ( in.tradingview charts ) because if i use the built-in McClellan oscillator ,its based on Nasdaq & S&P500 , how do we make it work on Indian Nifty50 ?
Support/Resistance & Trendlines are one of the most important tenets of TA. Attached is daily chart of ADF foods which recently came out with a good set of numbers with a Yoy earnings growth of 24%. Of particular interest its distribution business which has a great ROCE of 38% and is growing at a rapid pace. Given that this biz was started in Q1’20 it has grown from strength to strength and from contributing 7% to the topline it now contributes 21% to it. A fast growing business generating an ROCE of 35% can easily be valued at 50-60x multiple , in ADF’s case this business is likely to close the year with a net profit of 10-12 cr and can easily contribute 20 odd crs to the net profit next 1-2 years making only this component worth 1000 cr, which is 75% of current the current market cap. The co is almost debt free & has 74 crs of cash/investments + the rest of the foods business is also doing well with good margins and returns on capital.
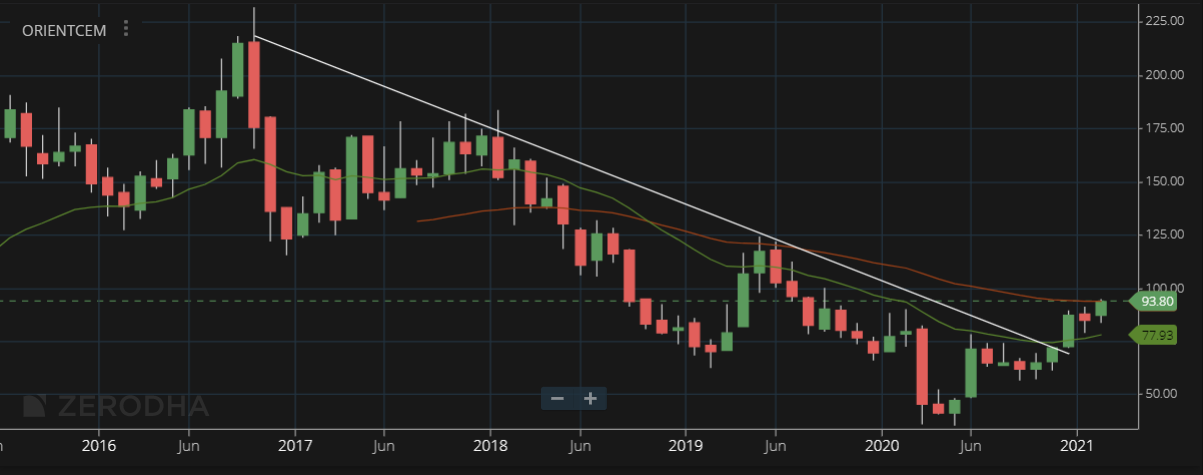
Orient Cement - Coming out of a 4 year downtrend. Valuation is cheap compared to other cement companies at around 12 times earnings and 6 times EV/EBITDA. Capacity utilization appears to be in the mid 70s so there is scope for growth in the numbers but this is primarily a valuation catch-up play in the infra space. Recent numbers including Covid hit Q2 have been very good. Recently got past its 52 wk high but trading far below all time highs while earnings are close to all time highs.
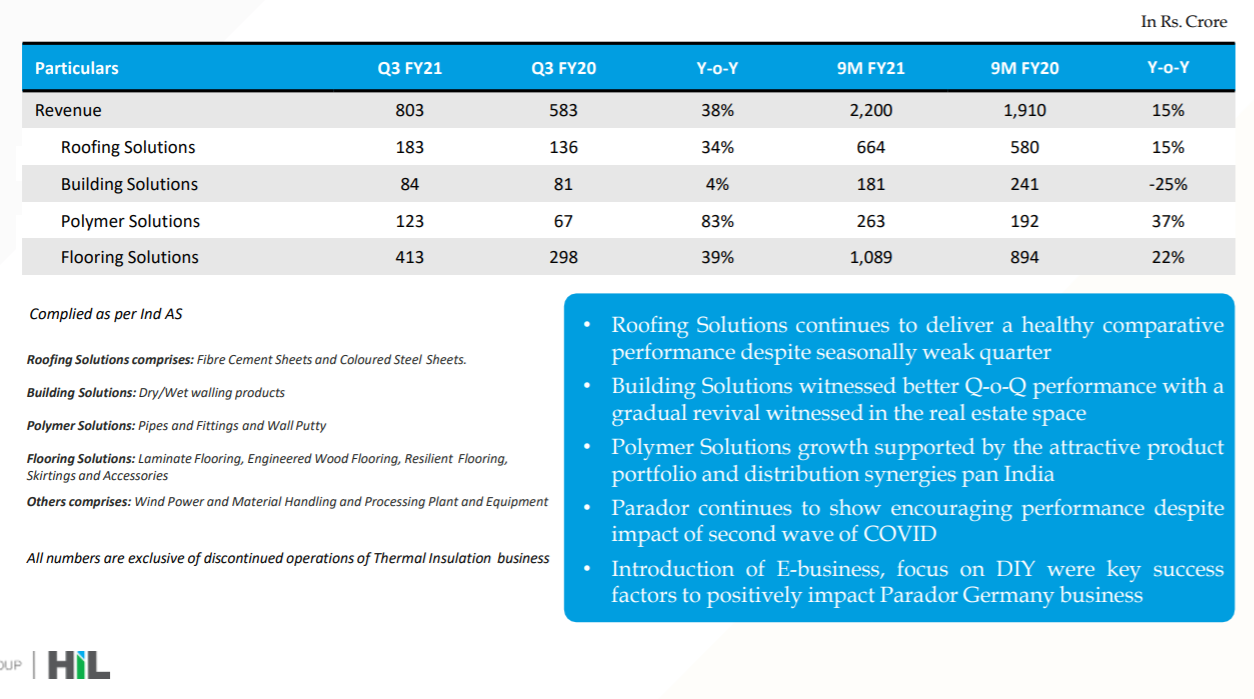
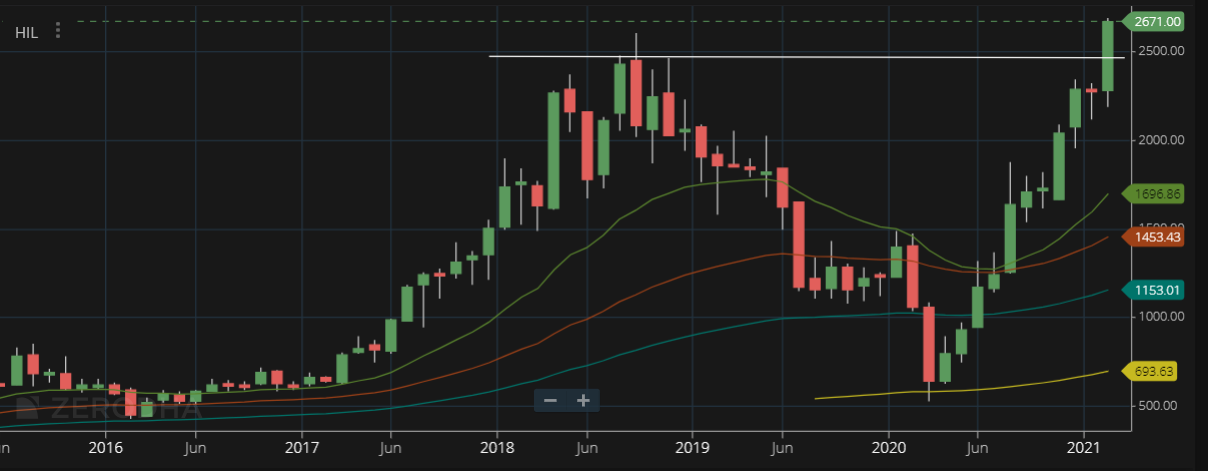
HIL - Another cheap infra/capex play. What I really liked about the recent numbers is that pretty much every segment from roofing, pipes and flooring (primarily international) is showing significant topline growth. They have also reduced debt by 250 Cr which implies that the cash flows are healthy (They took on huge debt to finance the Parador acquisition).
Valuation is still very cheap at 8 times earnings and 5 times EV/EBITDA.
Update on KNR Cons and Tata Motors posted earlier based on speculative fundamental shifts - both these are now playing out and there is possibility of a multi-year strength here. Some of the speculation I had last year on infra spends by govt. and the way it might be financed are coming true now and we could be in for a capex/infra led economic growth due to low interest rates.
Tata Motors latest update shows strength in CV segment as well along with PV which is going great guns. KNR Cons has been growing its order book handsomely last couple of quarters although the market has taken fancy only post budget.
Disc: Bought Orient Cement post results last week and again post budget this week. HIL bought this week. Holding KNR Cons and Tata Motors from last year (No recent trades).
Can debt be an issue here? .91 D/E(orient cement is quite high but looks like promoters are taking efforts to reduce it.
Debt is an issue in a de-growing economy which is leveraged to the hilt. I would have personally not touched anything with a high debt (D/E > 0.5) couple of years back but have changed approach due to cheap money environment and deleveraging that’s been going on for years in the economy which has laid the groundwork for expansion.
In an environment like this where growth is available and credit is cheap, leverage isn’t necessarily bad. In fact leverage plays an important role in amplifying numbers in businesses like this when the cycle turns because the company can deleverage faster and bottomline expands faster as erstwhile interest payment flow through to the bottomline (even interest rates on payments can come down as well).
However, I would still keep an eye on Interest coverage ratio (4-5 times EBITDA) and have an eye on OCF/Interest as well in WC heavy businesses (Survival is important). Both HIL and Orient Cement have decent Interest coverage ratio and both have been paring debt (HIL reduced 250 Cr recently and Orient Cement as well has been reducing last couple of years) and have very short WC days (5 and 12 days respectively).
I am a novice so I may be overlooking several things, so take this with skepticism and research a bit.
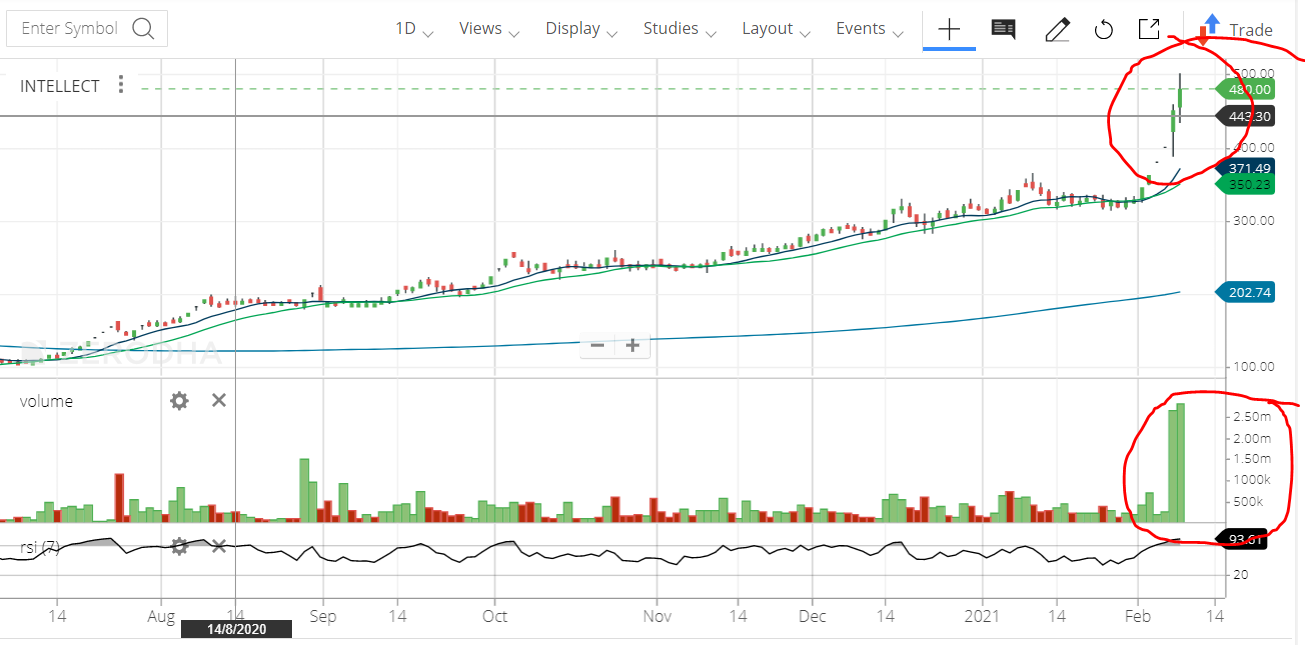
Pretty good Q3 numbers and valuation continues to remain cheap despite the runup. What’s nice is that there is very good topline growth (22%) as well this time along with the 40% PAT growth. Trading now at 17 time earnings at a time when the TTM earnings is at an all time high (ATH price is close to 500 levels). Appears strong technically as well to continue. Hopefully the WC management has gotten better too.
Disc: Have position from around 150 levels in Nov
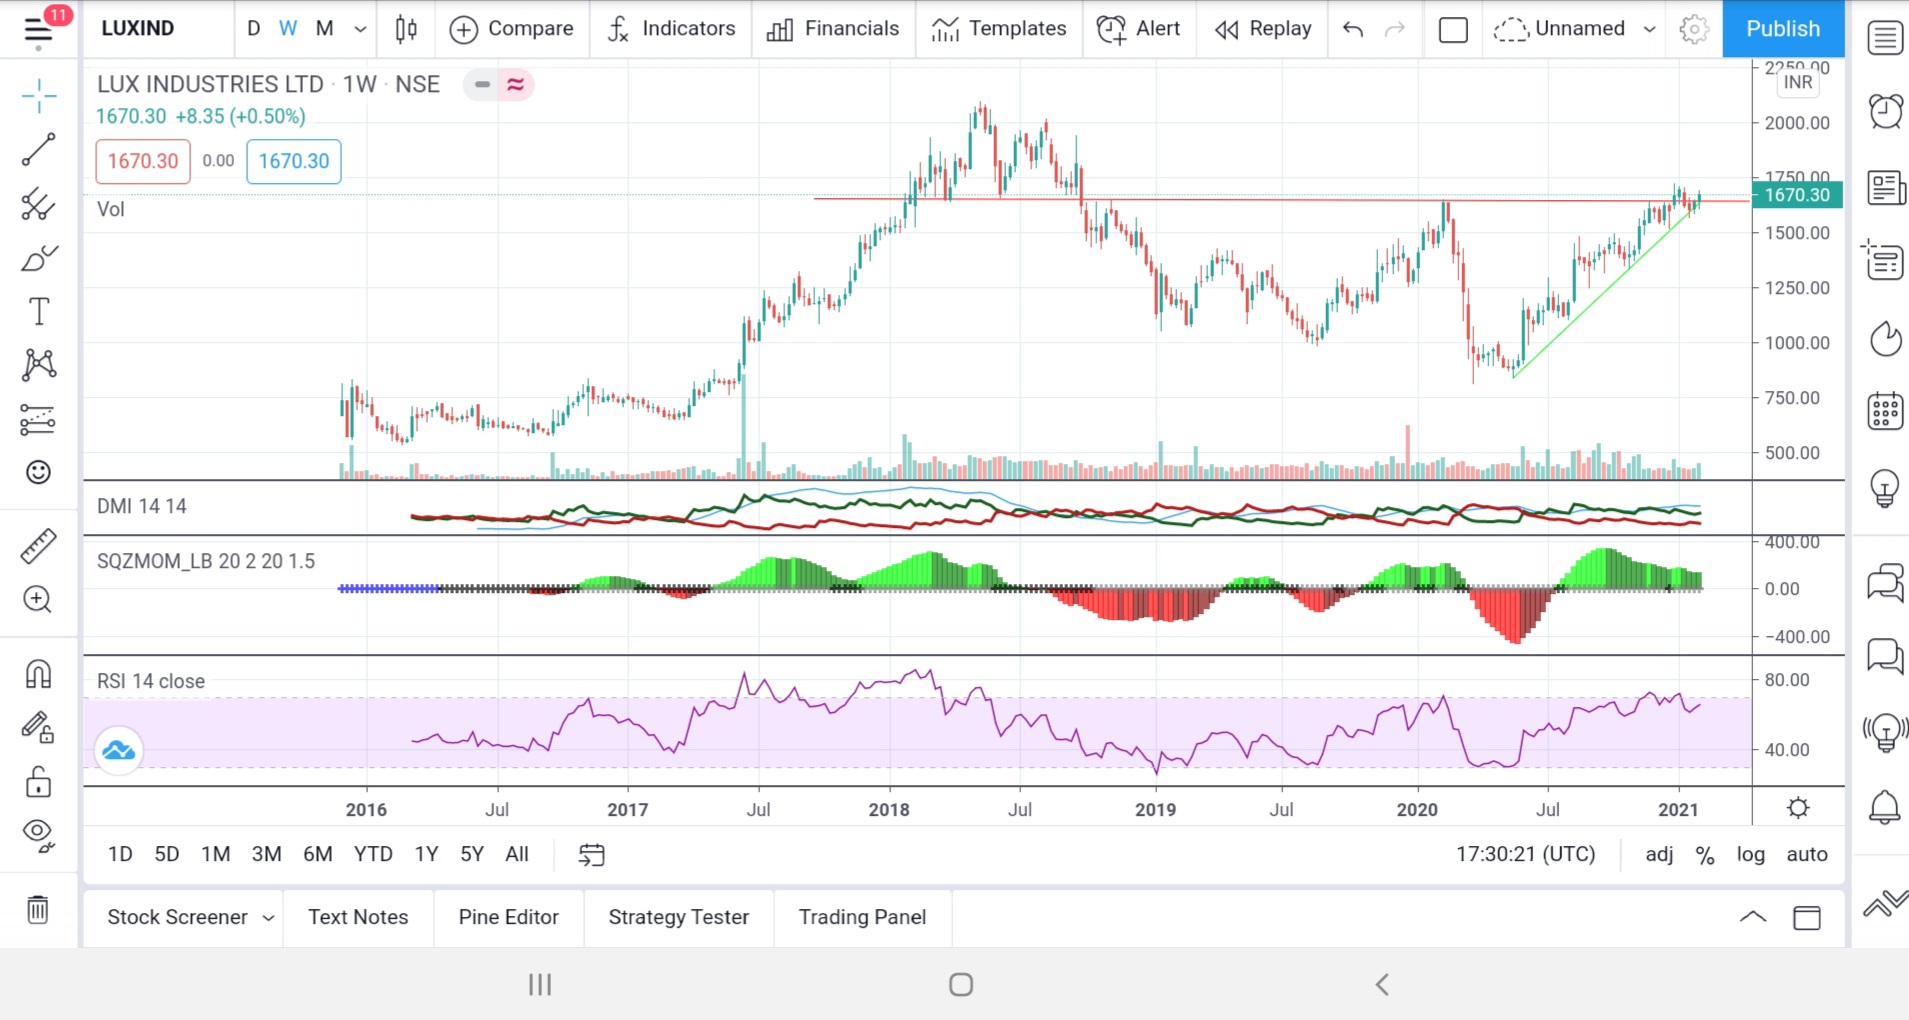
similar case for Lux ind, profits are already ahead of 2018 price peak, valuations are below long term averages, results in this week, last 3 qtrs results have been good growth as well
Looks like significant accumulation happening in Intellect Design Arena
AJ
Disclosure: Invested from lower levels and added recently.
Hi ,
Mods please move , if this is not the appropriate thread for it 
I have a query on Moving avg. indicator : if daily MA of 20/50 is used on a daily timeframe & then after changing the timeframe to weekly …do we change 20 MA of daily to 20/5=4MA on weekly & 50/5=10 MA on weekly OR tradingview will convert automatically , if we select ‘indicator timeframe’ input as ‘same as chart’? & there is no need to change 20/50 to 4/10 ?
A bit confused with this …any inputs or suggestion will be highly appreciated , thanks in advance !
No idea whether that setting helps in that or not. But you can use below pine script and add it to your chart and edit if you want to remove or add some moving averages. This will definitely do the work. I have not put in code for month but if you want you can do that also.
//@version=3
study(title=“MA Dynamic”, shorttitle=“MA Dynamic”, overlay=true)SMA_200=iff(period==“D”, 200, iff(period==“W”, 40, 200))
SMA_100=iff(period==“D”, 100, iff(period==“W”, 20, 100))
SMA_50=iff(period==“D”, 50, iff(period==“W”, 10, 50))
SMA_20=iff(period==“D”, 20, iff(period==“W”, 4, 20))
SMA_10=iff(period==“D”, 10, iff(period==“W”, 2, 10))//Plot Simple Moving Averages
plot(sma(close, SMA_200), color=red, title=“SMA_200”, linewidth=2)
plot(sma(close, SMA_100), color=orange, title=“SMA_100”, linewidth=1)
plot(sma(close, SMA_50), color=blue, title=“SMA_50”, linewidth=2)
plot(sma(close, SMA_20), color=black, title=“SMA_20”, linewidth=1)
plot(sma(close, SMA_10), color=green, title=“SMA_10”, linewidth=2)
Could not see that setting you mentioned in trading view but you can compare the moving average value in daily and weekly time frame to see whether that setting is working as you want or not.
Hope it helps.