First entry done, second entry above 129 on closing basis
2 Likes
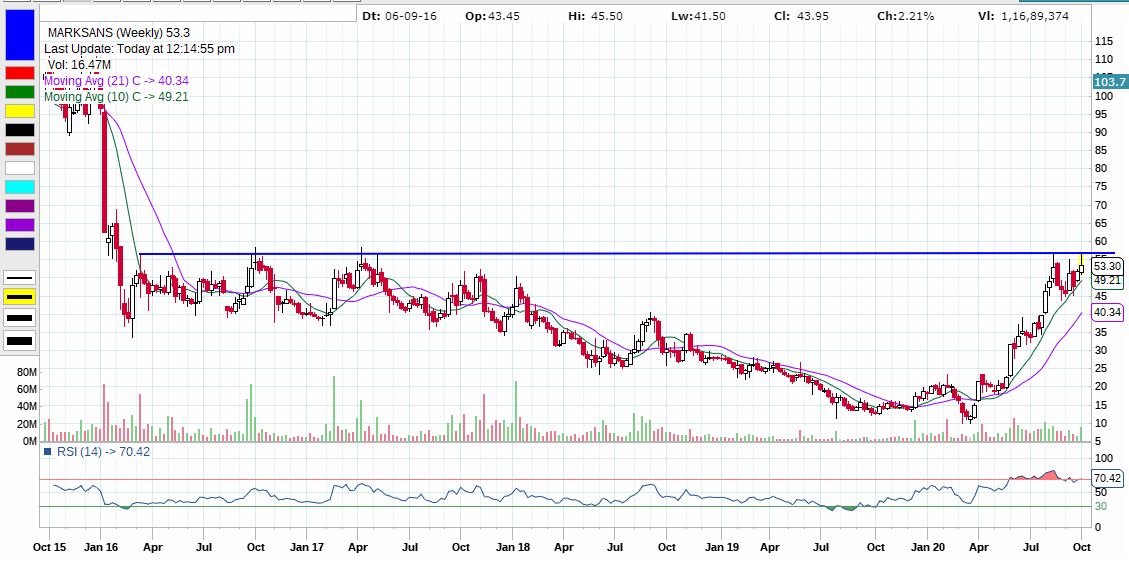
After breaking out of the rectangular consolidation, Daichi closed above 282 levels which is a strong support - as it is the 61.8% fib level of the peak of 361 and trough of 155. At the current level the daily chart has formed a gravestone doji after a little correction post a couple of upper circuits after the results. A gravestone doji is bearish or bullish reversal signal depending upon the context.
The 282 level which also acted as a strong resistance barrier in the past was overcome with prices sustaining about it. The Jun’20 results were good considering they were obtained with the Dahej plant operating at 40% capacity. The management has guided for a 300 cr topline in the next 3 years which is 3x of the current topline. Furthermore, the interest burden of 10cr which will go away after the repayment of the debt will add another 150 cr to the market cap ( assuming a p/e of 15).
Best
Bheeshma
2 Likes
You can easily calculate RSI from stock price data in excel, if that is what you want. Please see this:
https://school.stockcharts.com/doku.php?id=technical_indicators:relative_strength_index_rsi
Hi …guys …thanks for your response but i think i clarified in my Q itself that i am not looking for RSI indicator …which i am fully aware off …i am referring to RS ( relative strength ) which is different from RSI …here is a short video for it …which will give u a brief …and i was interested in knowing how to get this in zerodha or any other charts …thank you !

You can watch this youtube video https://youtu.be/RVbze1duD-U
from Trade with trend. He has explained relative strength in 3 parts series and explained how to plot it on trading view in the comments section.
2 Likes
Is there any way I can find how many stock in NIFTY250 are hitting 52w high & low in a month? Also is there any way to find it on historic basis?
Hello …thanks …this is what I was referring to …btw i did see this 3 part series before posting here  as i found the plot description a bit too complicated but i guess i will have to review the explanation of the plotting again in the comments …i was looking for an easy way out …but thanks anyway !
Hi. This is what I found in comments section :
You Can view RS (Relative Strength) on Trading View Dot Com
You can use the code below.
study(“Comparative Relative Strength”, shorttitle=“RS”)
a = tickerid
b = input(“NIFTY”, type=symbol)
as = security(a, period, close)
bs = security(b, period, close)
plot(as/bs, title=“RS”, color=gray)
len = input(10)
plot(sma(as/bs, len), color=navy)
But when i actually use RS in tradingview we only have to change comparative symbol in inputs rest are default settings. Hope this helps.
4 Likes
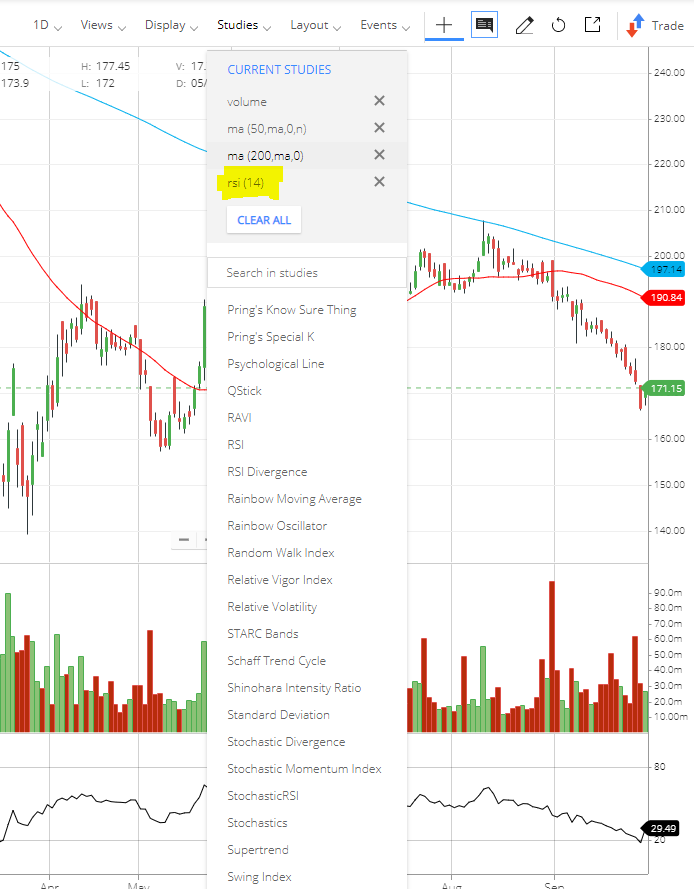
Zerodha has introduced a new indicator called the ratio
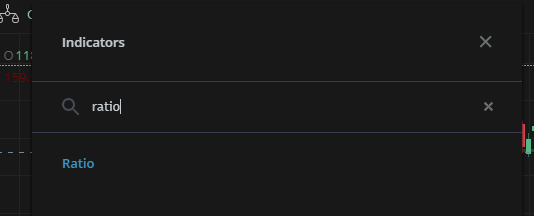
After selecting the ratio indicator
You may select against which you want to see the relative strength (Eg: INDEX NIFTY50) and
3 Likes
Hi, Novice trader in me need some learning support- can someone confirm if this is a breakout(used weekly chart) to much higher levels on HDFC Bank?
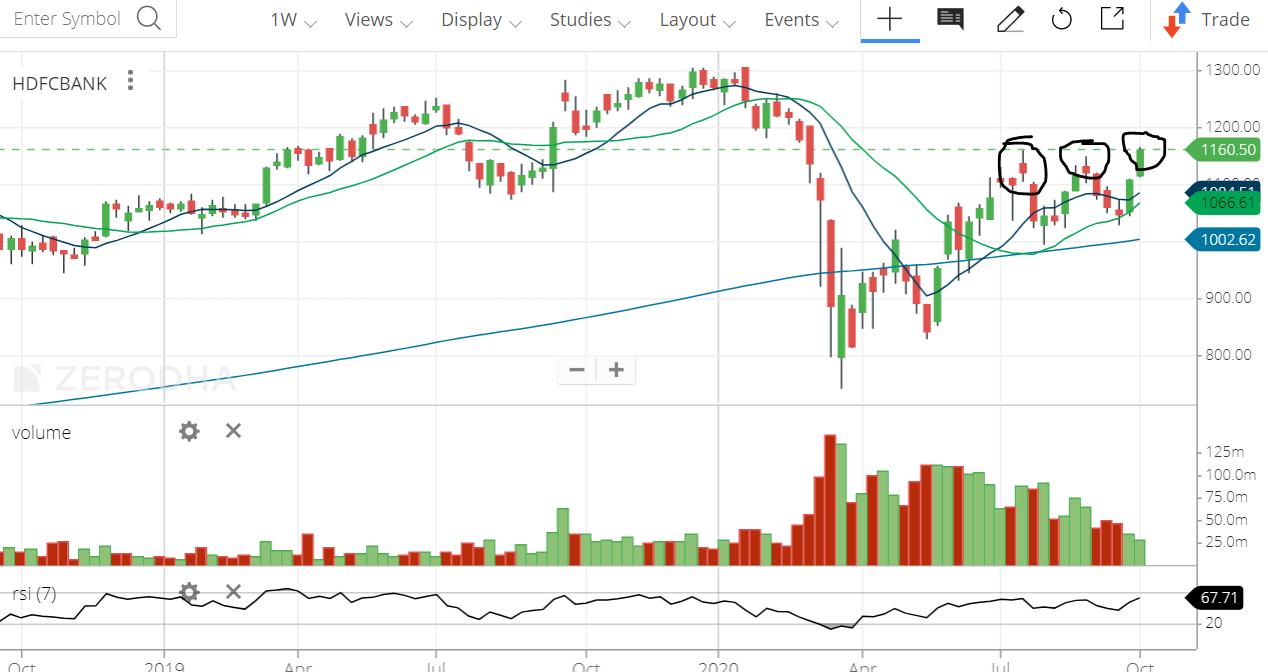
Thank you!
Best regards,
AJ
Please take my observation with a pinch of salt as I am equally a novice. The latest uptrend seems to be very strong. Look at the past 2 candles. They are all Marubuzo candles. The previous two candles as you can see are weak candles with small bodies and large wicks. Also their preceding candles indicate that the momentum was dropping off. Not today. So yeah, looks to be a breakout atleast for the short term.
Hope this helps
1 Like
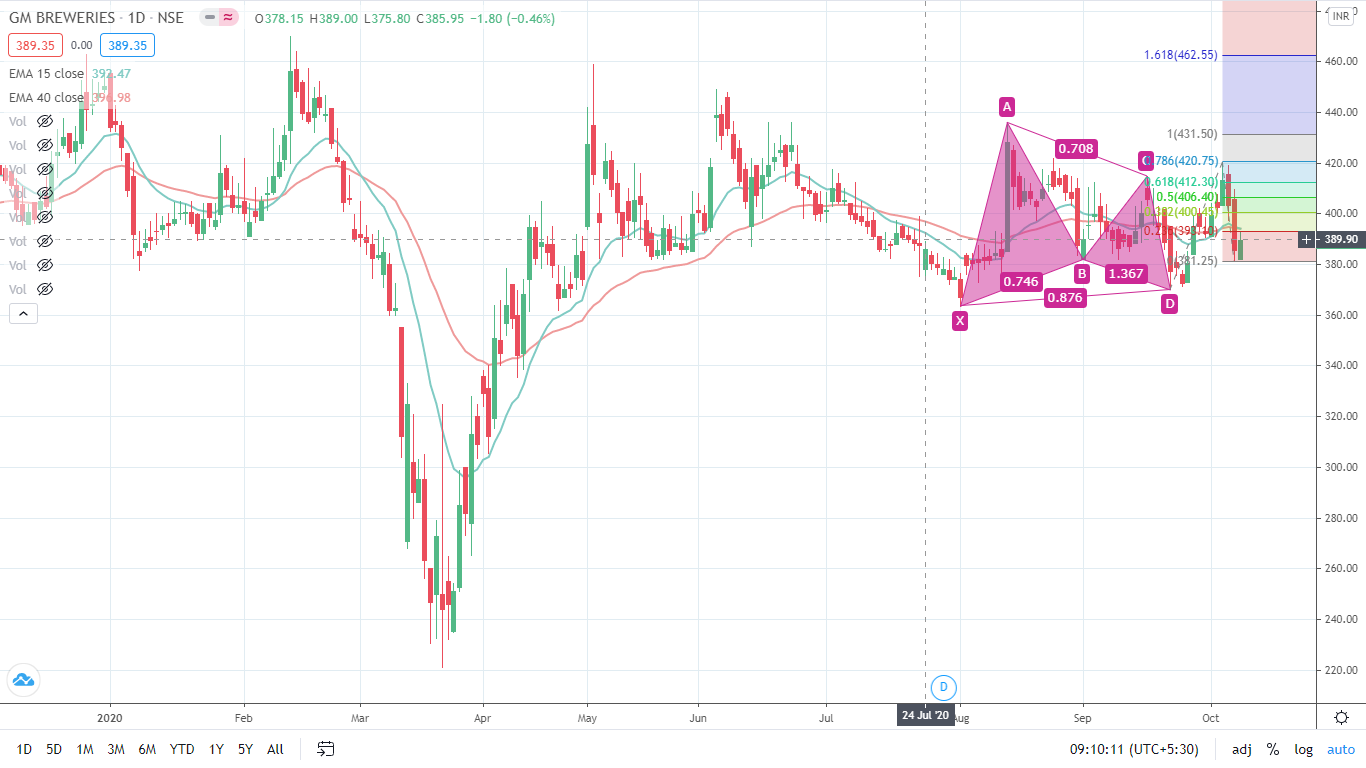
The harmonic pattern worked for Hexaware when price was at 250 odd levels pre delisting. A similar pattern is seen on the GM breweries chart.
The co rescently declared its Q2 results and operating margin seems to have improved compared to the previous Q2 quarter standing at 21% compared to 20% in the previous quarter. Due to the lockdown topline was impacted but is back at 60% of precovid levels. The co does about 120 cr of revenue on an average every Quarter. Pattern suggests a target of 462 which is 1.618 of the current wave. Lets see.
Attached chart.
Best
Bheeshma
3 Likes
JK lakshmi- Breakout of multi year channel after testing support with bullish MACD cross.
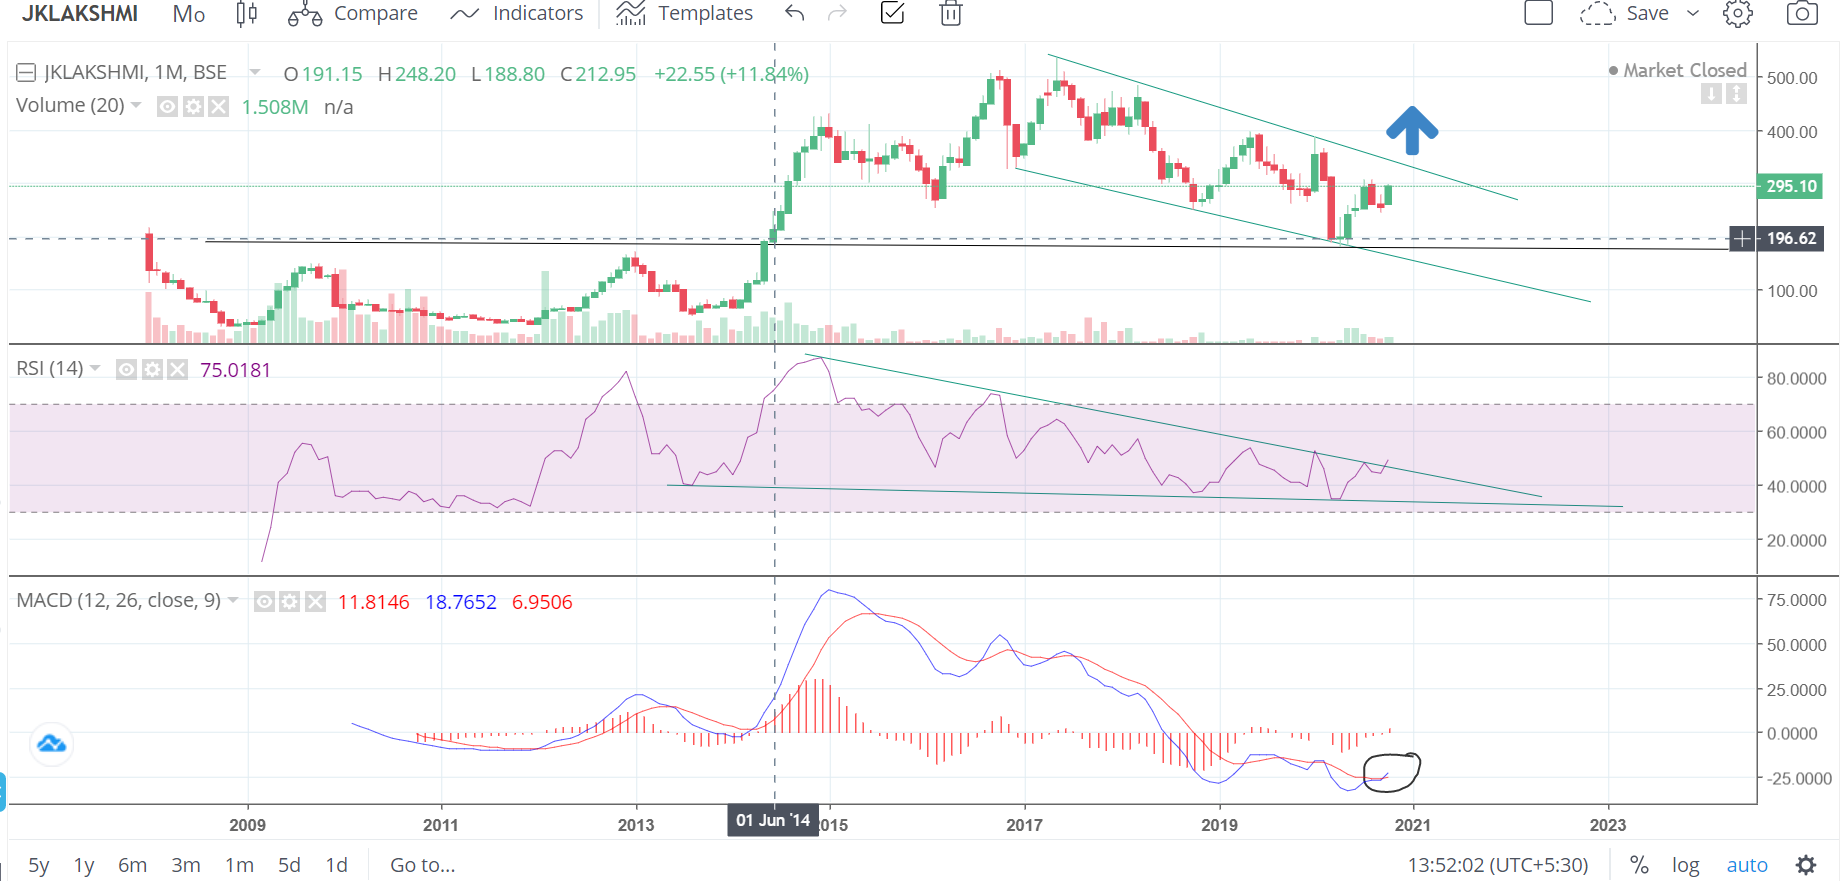
Disc- invested recently.
1 Like
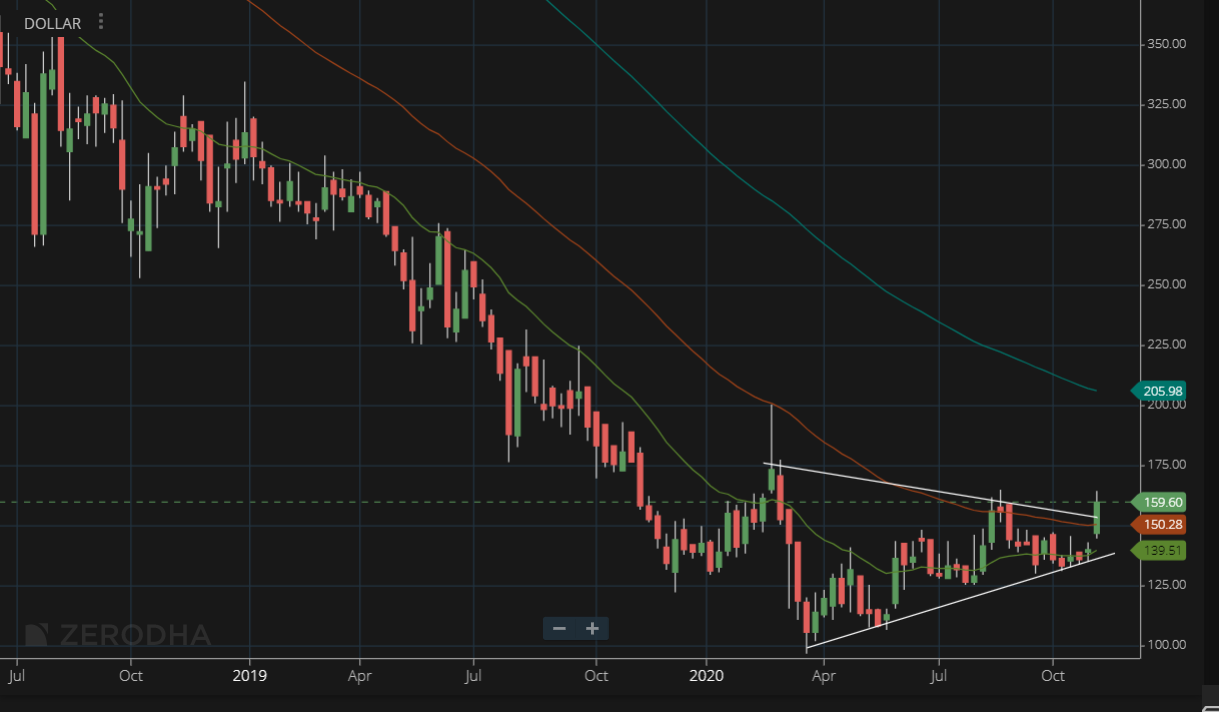
Dollar Inds, Weekly - Appears to be bottoming out. The recent quarter numbers are very good and the valuation is cheap. The business doesn’t have good working capital management, mainly on the receivables - probably worst in the industry and the valuation reflects that. However, there are signs that this might be changing.
Emami, Monthly - Decent numbers, favorable valuation. Trendline breakout and a bit of consolidation has happened.

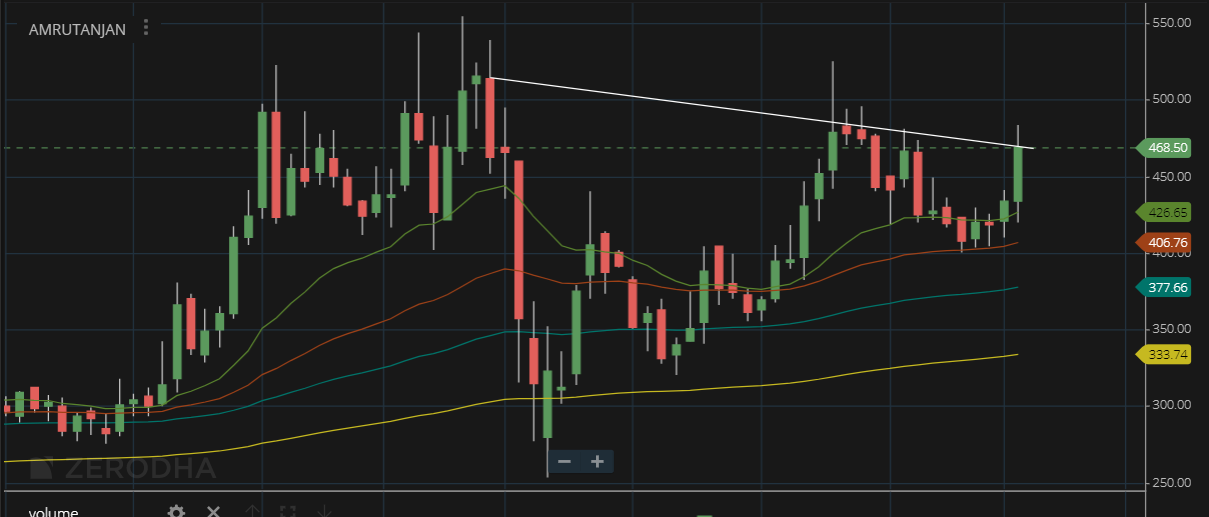
Amrutanjan, Weekly - Good numbers today and a C&H on the weekly. Valuation is probably fair but if growth shown in this quarter is sustainable, then perhaps it is undervalued.
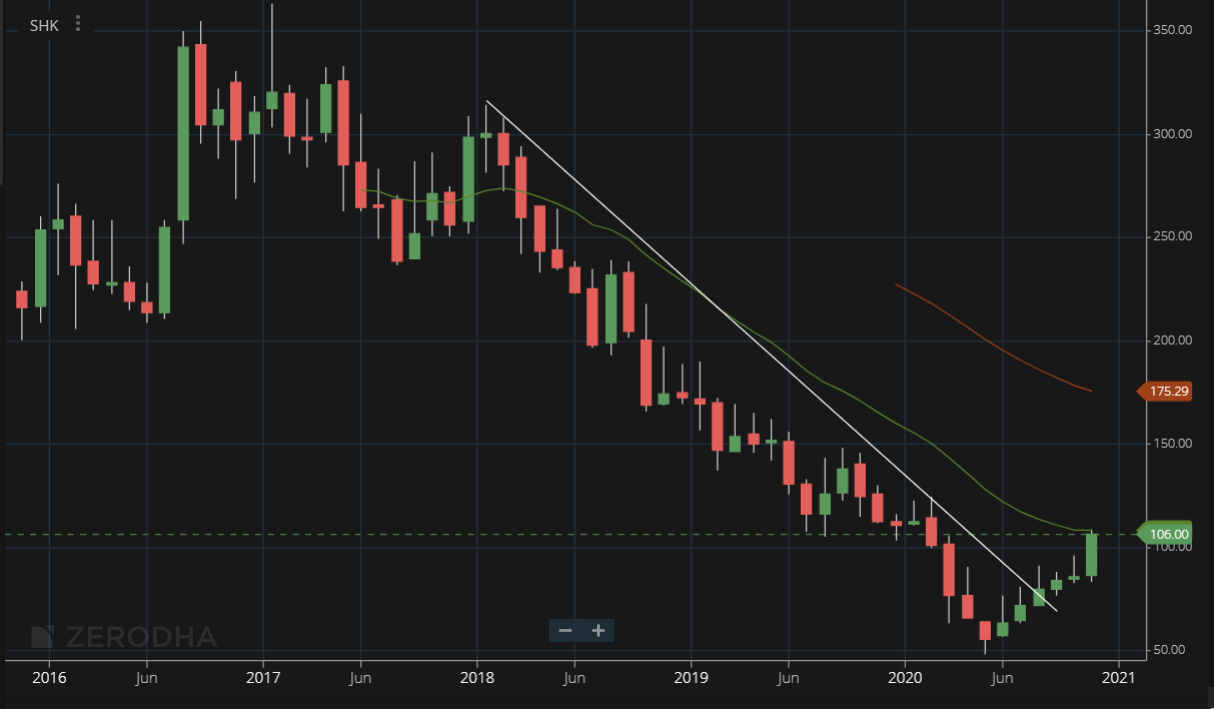
SH Kelkar, Monthly - Very good results and the worst might be behind the company here. Promoters have shown faith in increasing their stake throughout the year. Valuation is very good as well
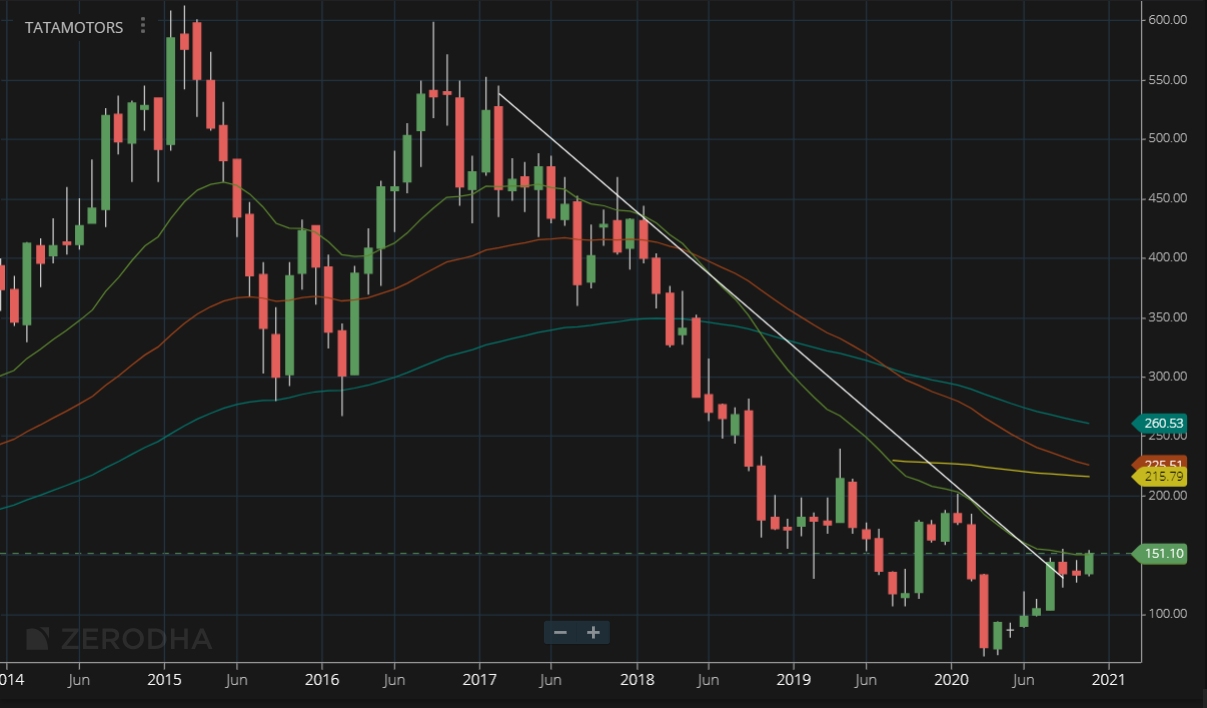
Tata Motors, Monthly - Long downtrend broken. There are recent signs of recovery. The new models of Altroz and Nexon EV as well are doing very well and growing faster than the industry. They have recently pipped Mahindra in PV sales and are at #3 in terms of market share behind only Maruti and Hyundai. What’s also nice is Nexon EV is being offered with 160k or 8 year warranty, showing faith in the platform. I think it might be mature enough for mass production of EVs at this point. Nexon EV is doing way better than MG ZS EV and Hyundai Kona and is priced much lower as well and is currently the segment leader. PV business has well and truly turned for Tata Motors. Hopefully now they can do the same with CV and JLR as well. JLR is also showing strong signs of recovery lately. None of this is in the valuation yet.
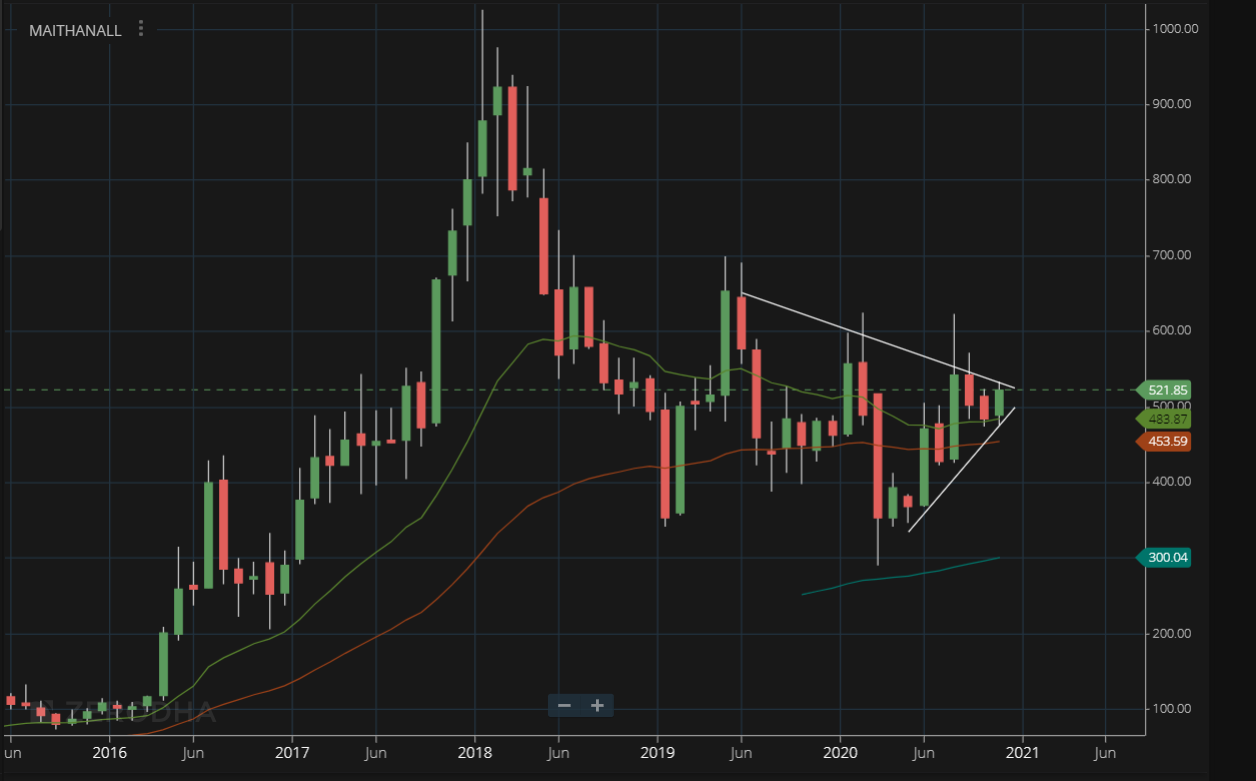
Maithan, Monthly - Another value play in the metals space with about half its market cap in cash, trading at 7 times earnings, 3 times EV/EBITDA and about 1 time P/B. Has been a laggard compared to other metal stocks, despite pretty good recent numbers. Is very close to a trendline breakout.
Disc: Have trading positions in all
13 Likes
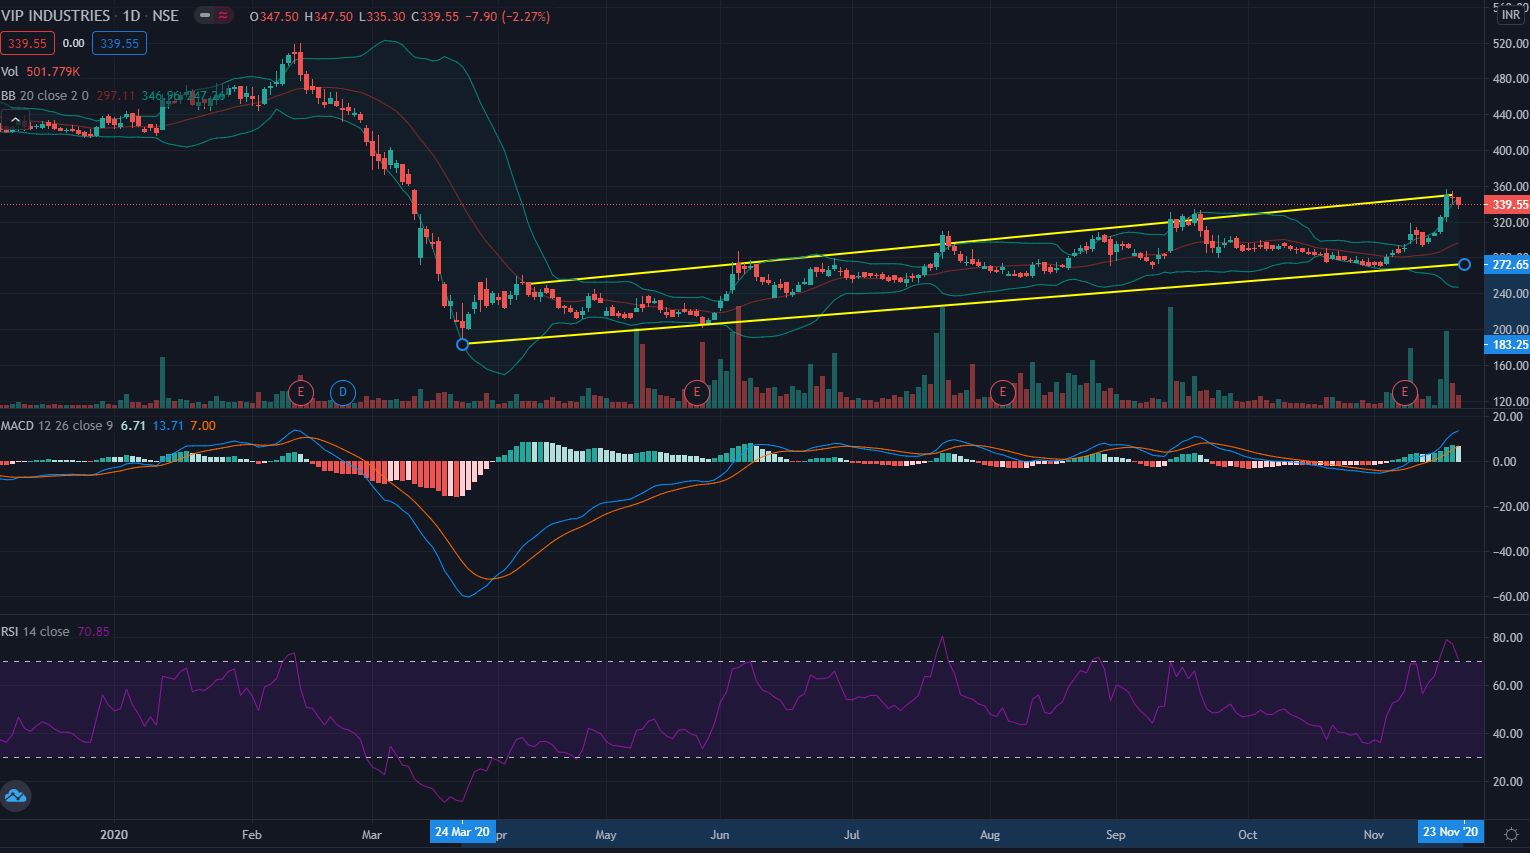
VIP industries in a classic ascending channel pattern since march lows.
The Candlestick chart for VIP technically looks overbought in the following charts
- Upper edge of the Bollinger band
- Recently made a bullish crossover on the MACD indicator , looks ready for a short-term reversal to the mean
- RSI has recently peaked at 74 , which is highly overbought indicator
Disclosure : This is my first post on a technical chart topic, apologies if it is not polished information!
Recently exited VIP based on this interpretation.
Closely watching if the new high sustains at 340 -350 levels or retraces back as per the rising channel lower edge.
1 Like