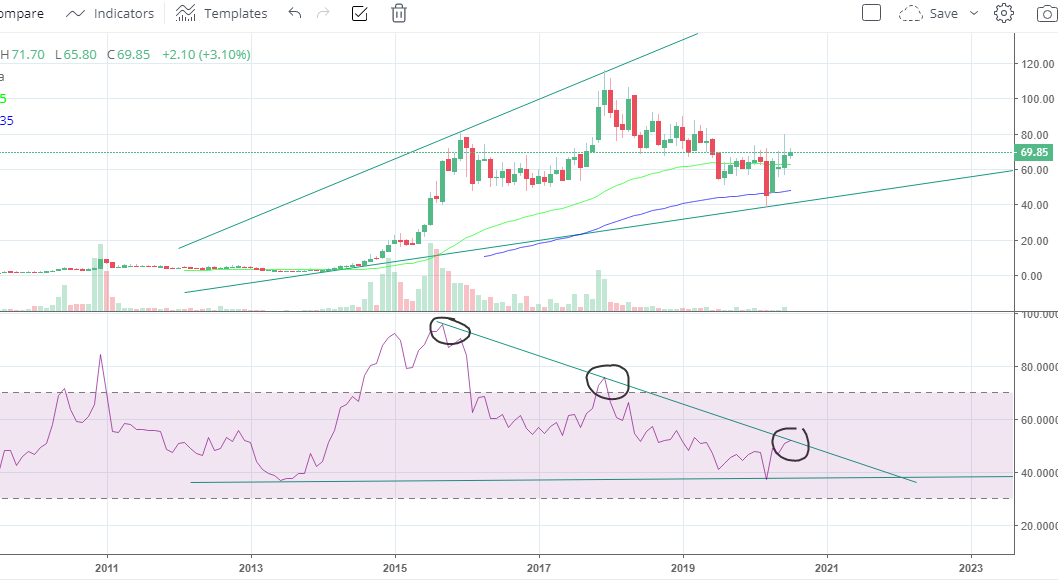
cant predict but personally expecting it to break all time high if it manages to break the RSI triangle-
1 Like
Kinldy recheck ur EMA settings,bcz u have selected monthly chart and period u have kept 50,100,150.
1 Like
so how does that matter can you please explain because its a line representing n periods average whether it me 5 min, 15 min, 1 hour, daily, or monthly chart.?
I’m using Mark Minervini trend template to filter stocks. However, not sure how to I get Relative Strength of the stocks. Is there any screener available for the same.
Thirumalai Chemicals breaking out of VCP pattern, with RS Nifty breaking out.
1 Like
Shilpa Medicare, Monthly - Has broken out of 4 year resistance trendline but is in the congestion zone of 500 levels from '15-'17. Should only be a matter of few weeks for confirmation. Fundamentally, all the tailwinds are in place where the business is geared for next level of growth with foray into Biosimilars/Biologics (New plant online this year), transdermal patches & oral films and also derma formulations to augment their existing Onco API & Formulations business. Back in '15 when the price was in this range, none of the new business lines were at play and the Gross-Block was 1/4th where it is now, so valuations are perhaps very good with respect to future potential in terms of P/B. If and when these investments materialize, price should follow.

Disc: Have positions around 470 levels
13 Likes
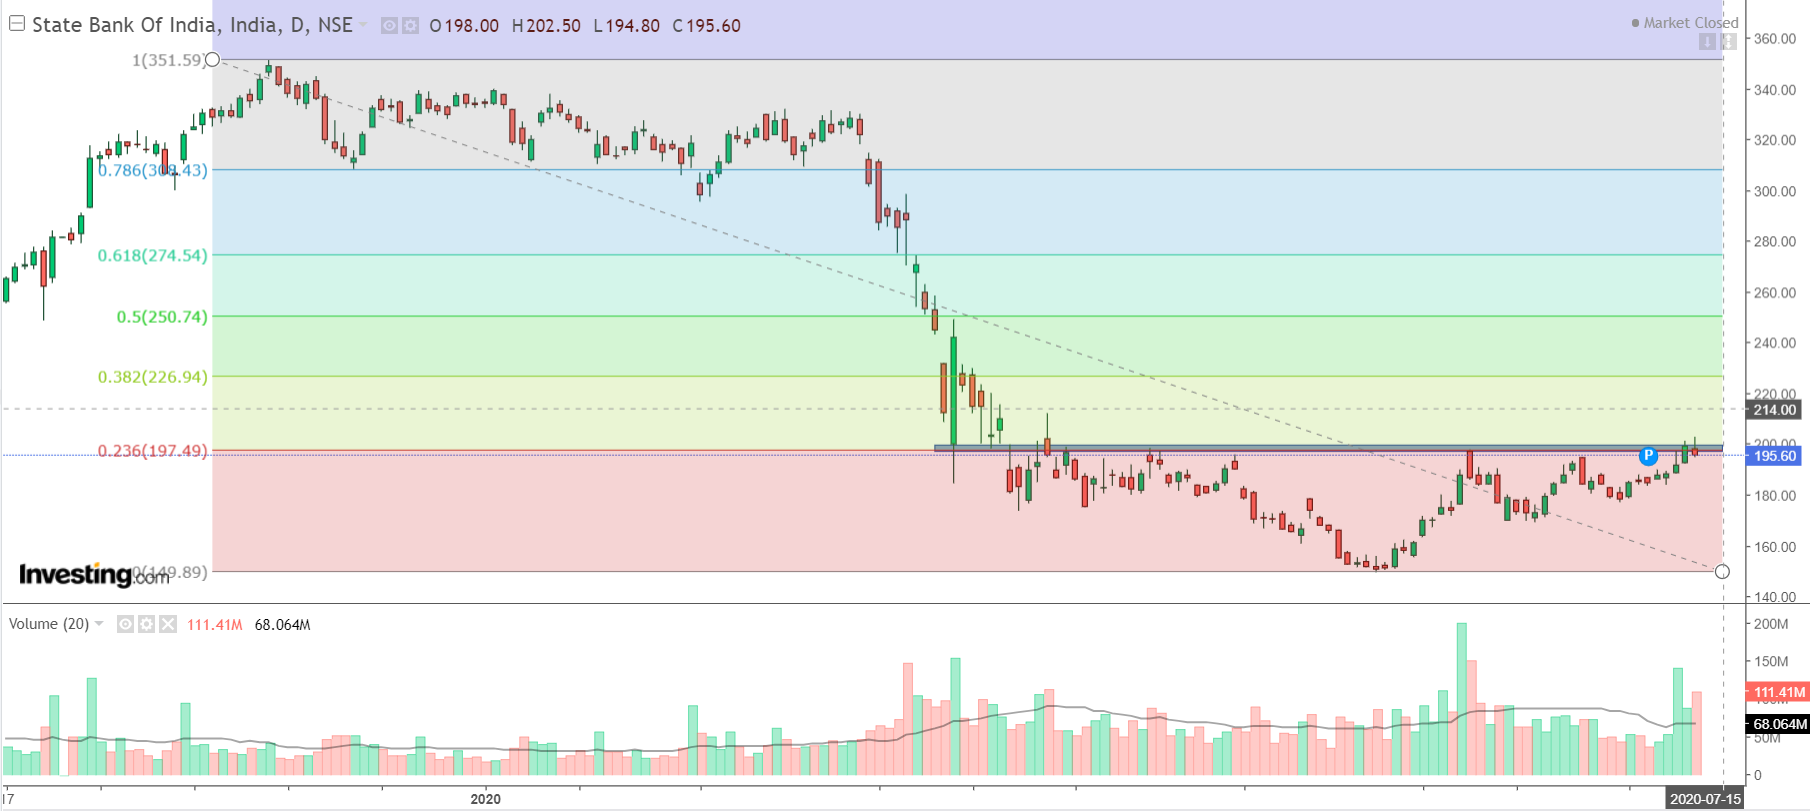
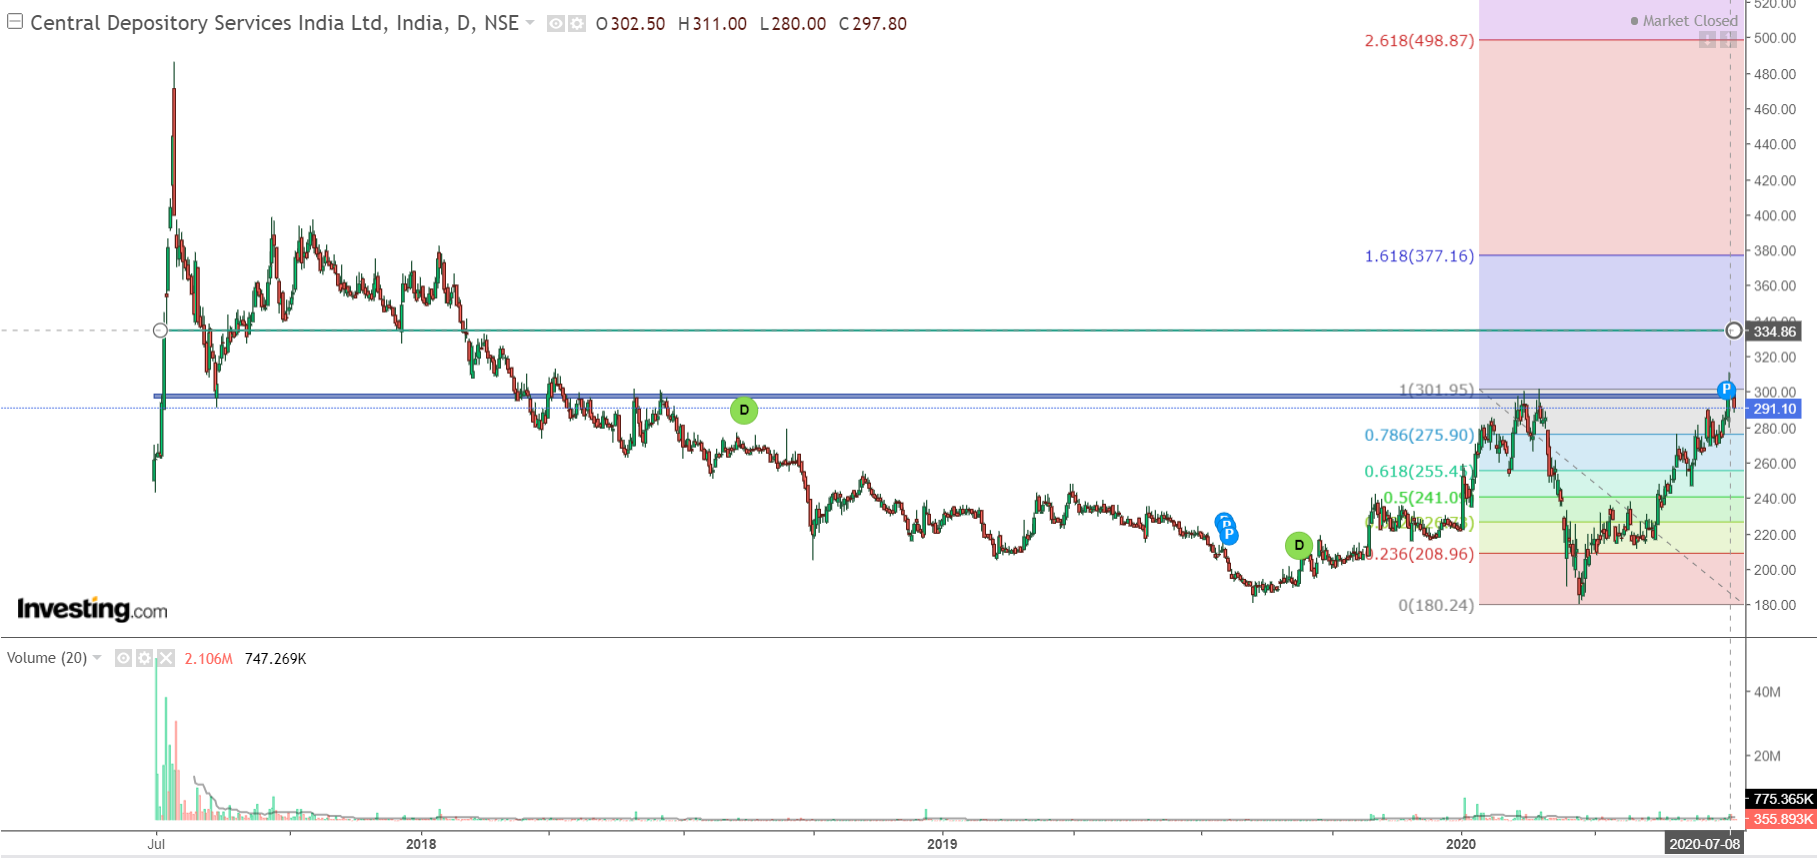
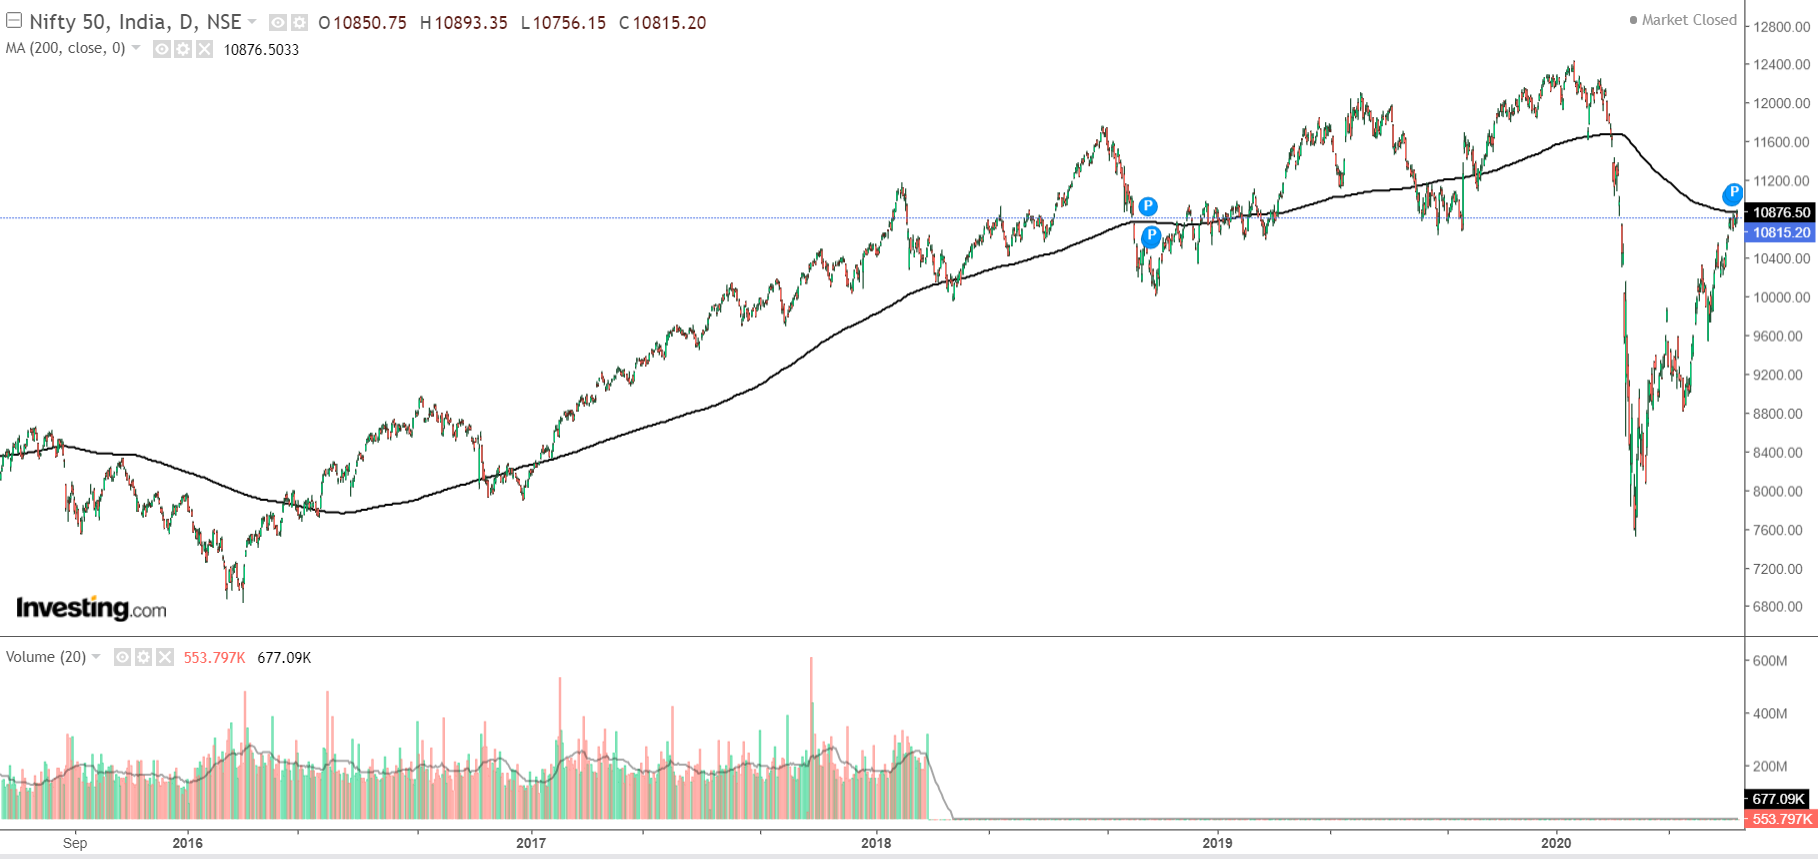
Interesting charts (for next couple of weeks):
SBI: Close above 200, 214 & 227 (38.2% fibo retracement) possible
CDSL: Close above 303, 315 & 335 next resistance levels
Nifty: 200DMA; Hold the Door or Break the Door !
SeQuent: A short pullback to 95/97 possible. However, post that, chart looks kinda strong for 120,132 &144 up-move.

Disc: Charts only for study purpose.
2 Likes
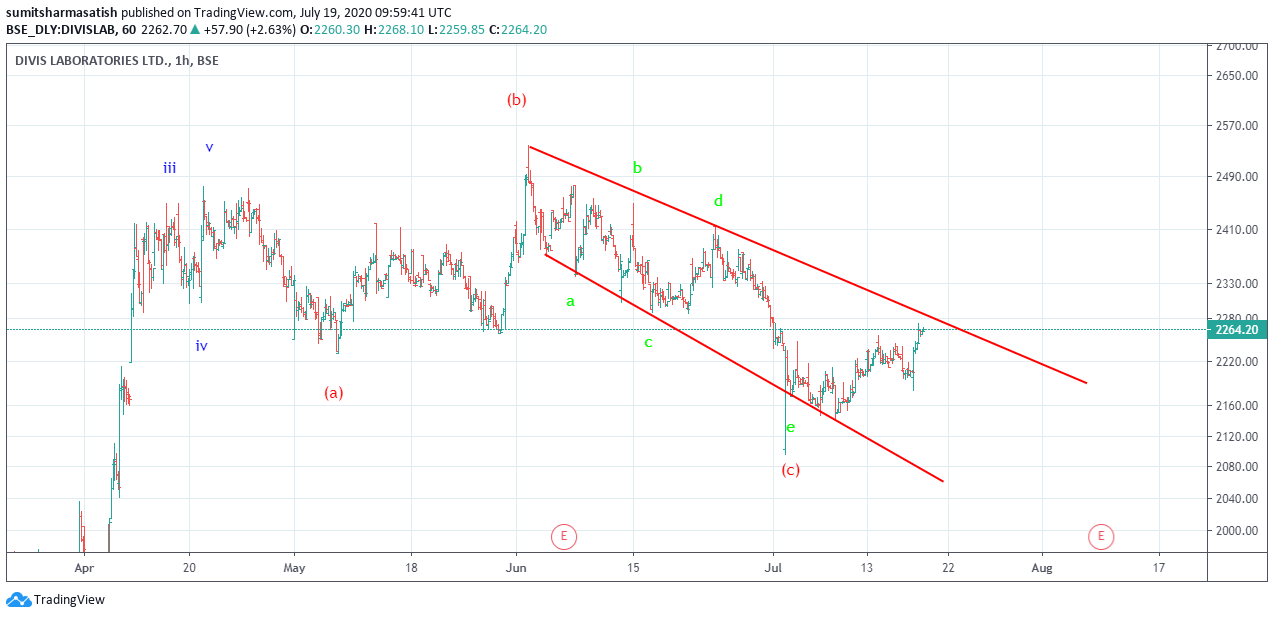
Divis Lab…expanding triangle as sub Wave C…correction looks over and target is minimum 2900 id wave 3=wave 1
1 Like
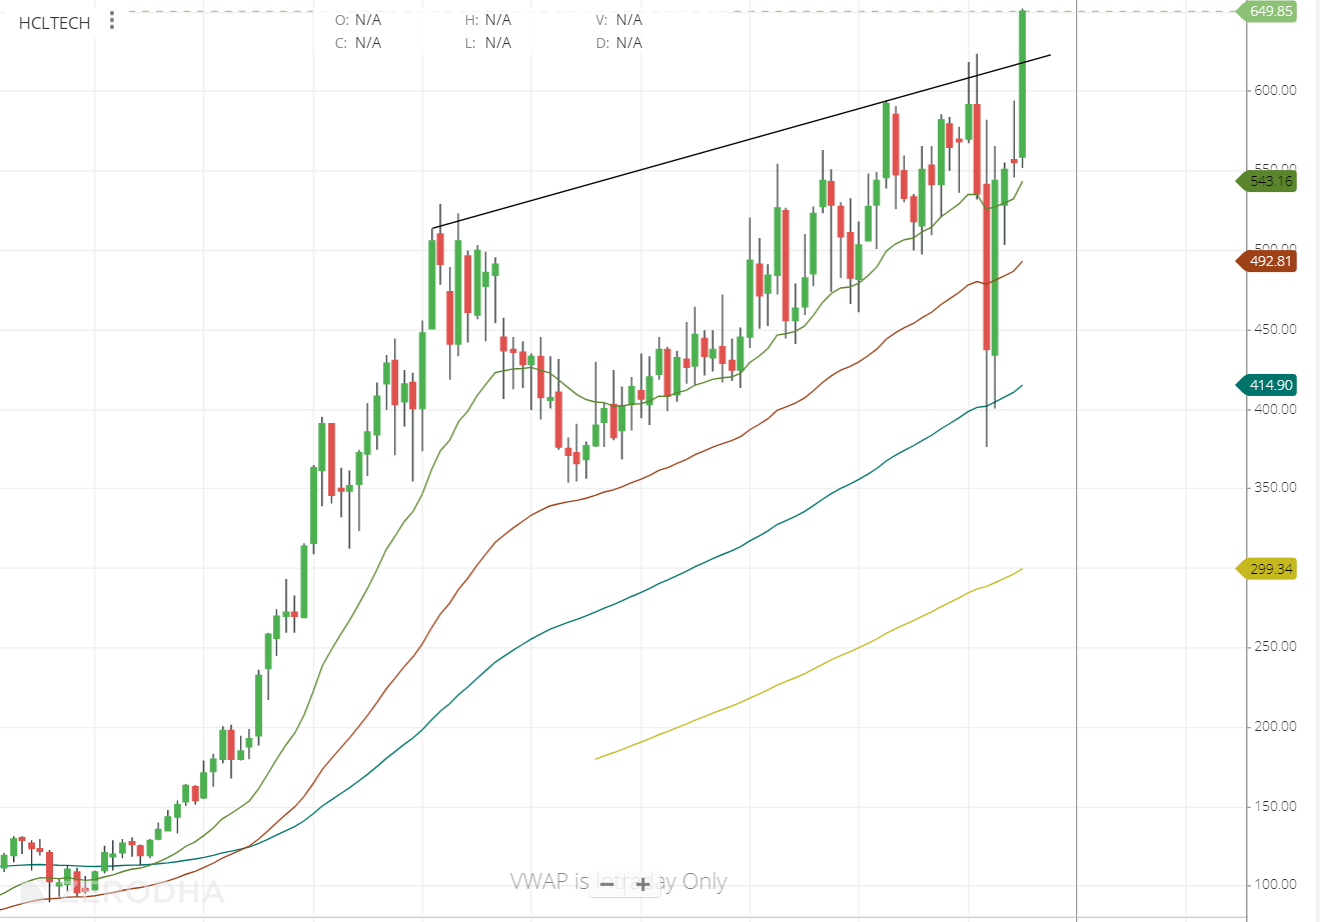
HCLTECH, Monthly - This is a upwards consolidation that has gone on for 5+ years and appears to have broken out this month. Fundamentally, the numbers are good given the circumstances and the guidance is good as well with 1.5%-2.5% growth in the next 3 quarters in constant currency (Just the mere fact that there is a guidance in this situation itself is very good). Looks like digital business due to companies shifting online will drive the trend.
IT in general hasn’t had good valuations for sometime now but certainty in revenues coupled with decent dividend payouts and the lower hurdle rates due to falling interest rates, should all work in favor to lift it up multiples in the medium term as it fits the bill perfectly for FD replacements. Large cap with good liquidity gives some comfort as well if volatility comes back again.
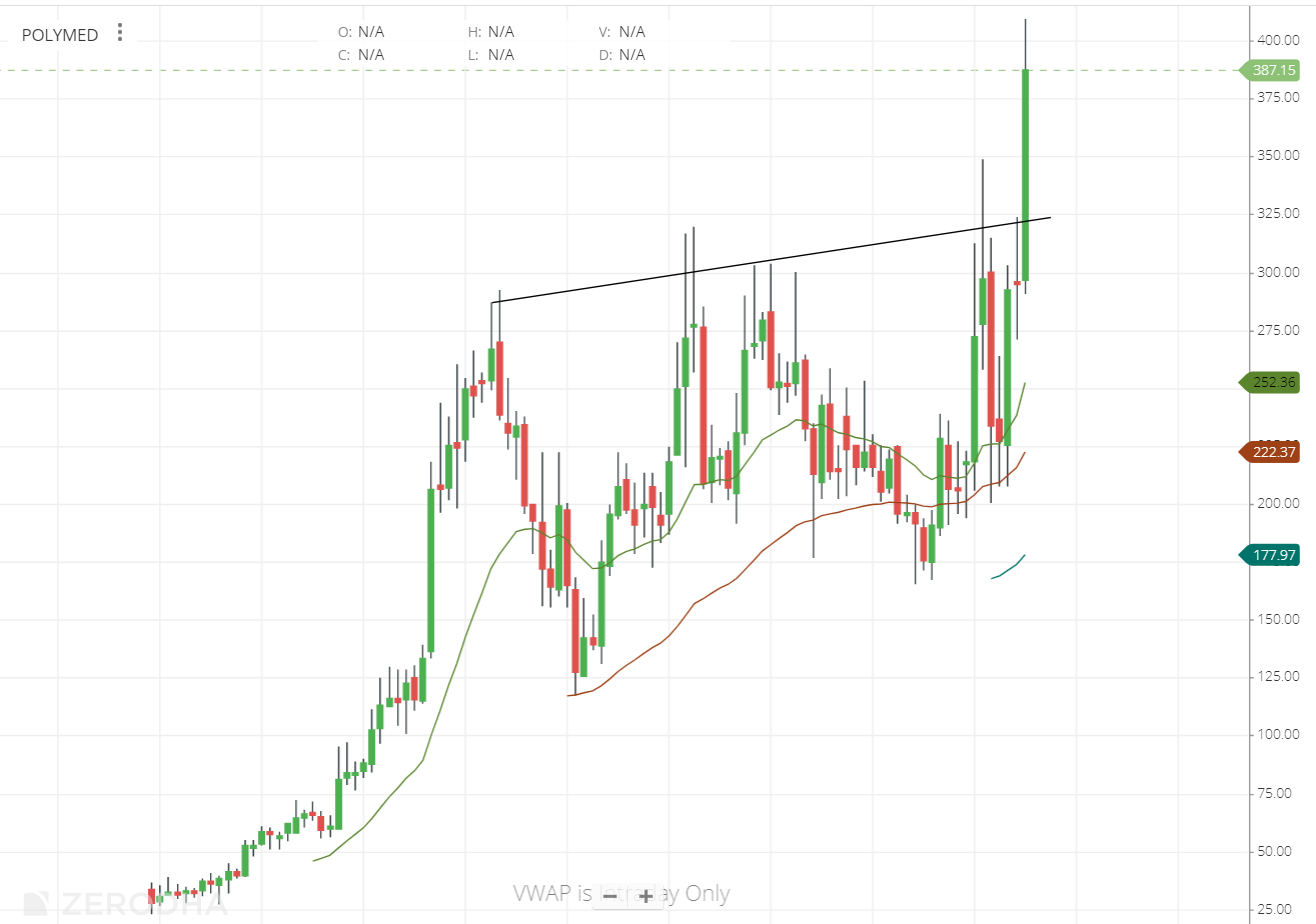
Polymed, Monthly - Long-term breakout. This is a fundamental, long-term position for me and the thesis is detailed in the Polymed thread.
Sequent, Monthly - Out of the resistance around 95 odd levels. Don’t follow this business fundamentally but price-action shows accumulation.

Disc: Have positions from around 620 levels in HCL Tech from last week. Polymed from around 230 few months back. Sequent from 95 levels.
9 Likes

Hi @phreakv6 , revenue growth in q1 of HCL Tech is around 10 % which seems decent in this type of environment . But are management giving rev growth guidance of 1.5% to 2.5% revenue growth in dollar terms? I did not find any article such. Can you please clarify?

In IT services companies revenues are usually compared on a QoQ basis as services accounts added/lost during the quarter will contribute incrementally and there is no seasonality in revenues. Constant currency terms shows the performance the company expects without accounting for exchange rate fluctuations. So a 2.5% QoQ revenue growth guidance will work out to 10%+ revenue growth YoY. In terms of last quarter results, it is tepid on QoQ as it is usually measured but is still extremely good on YoY. According to the company the blip is temporary and hence the optimism. Also they have maintained/expanded margins which is very positive. I think their margins will further go up if WFH becomes the norm.
Recent quarter guidance can be found here.
4 Likes
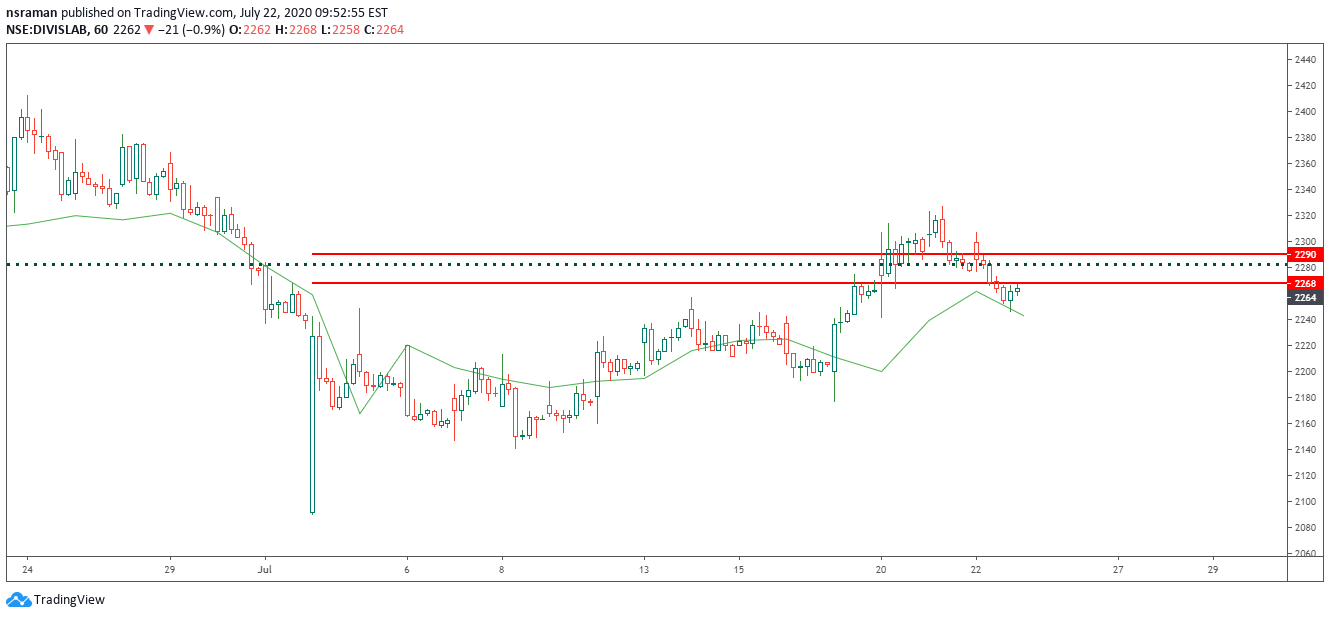
Please see Divis Chart It is sustaining Green zig-zag line. The moment it crosses the red channel a new uptrend is in place and probably worst is over for the stock
1 Like
Please see my post on EW thread
What’s EW thread? Can you share a link…
Thyrocare, Monthly - Hasn’t run up as much as Lalpath. Valuations have remained attractive for awhile now but perceptions can change with price. Appears to be breaking out of the long-term resistance trendline. Fundamentally while chronic could do badly in the short-term, the company has added Covid RT-PCR and antibody testing to its arsenal and I expect the latter especially to contribute in the future as people get curious to see if they have encountered and have the antibodies for Covid-19.
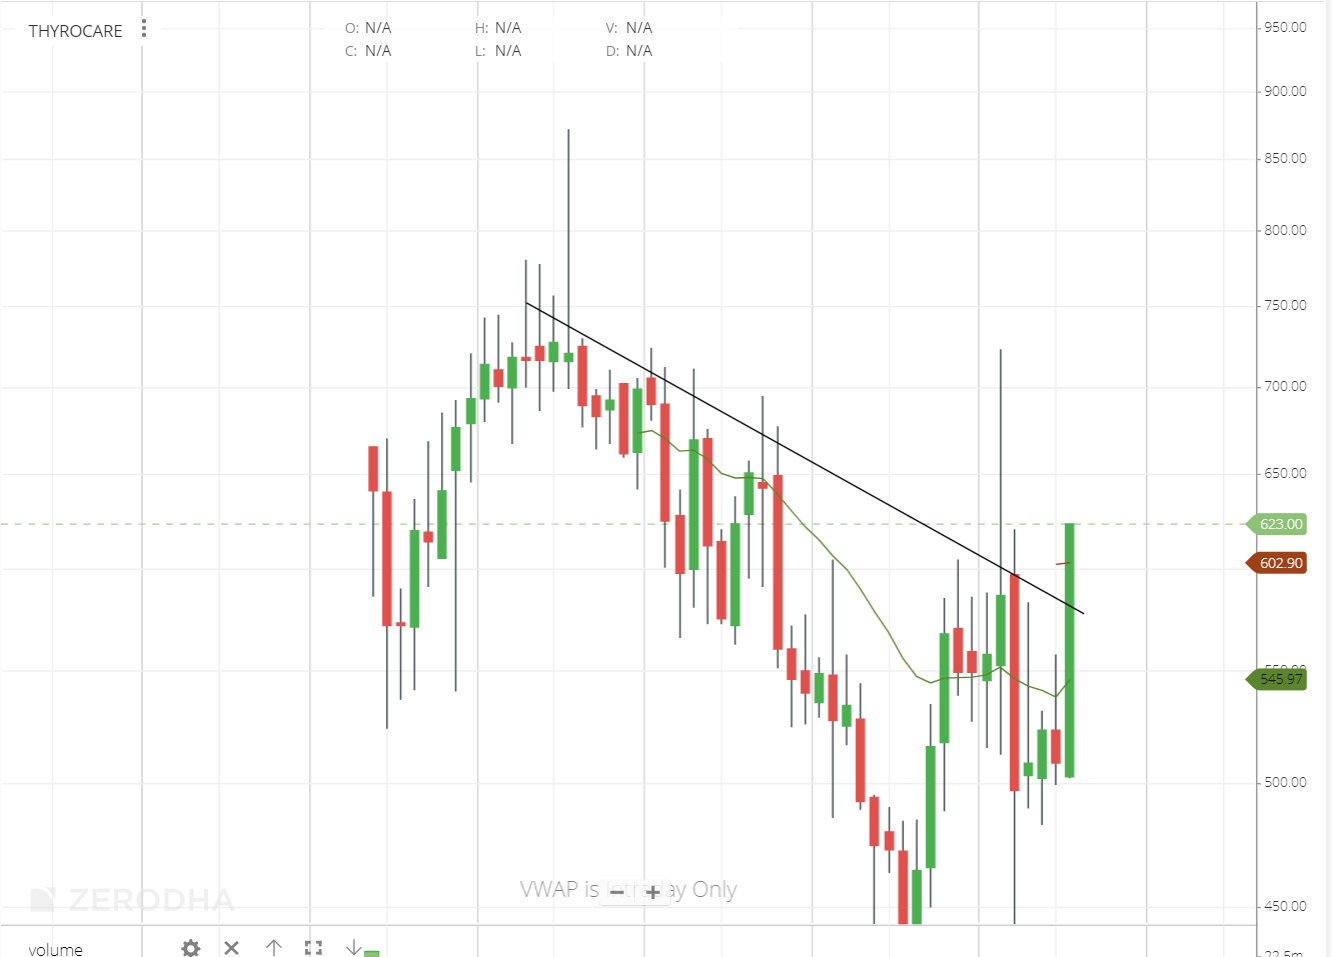
Disc: I have fundamental positions from 450 and added some as technicals improved.
3 Likes
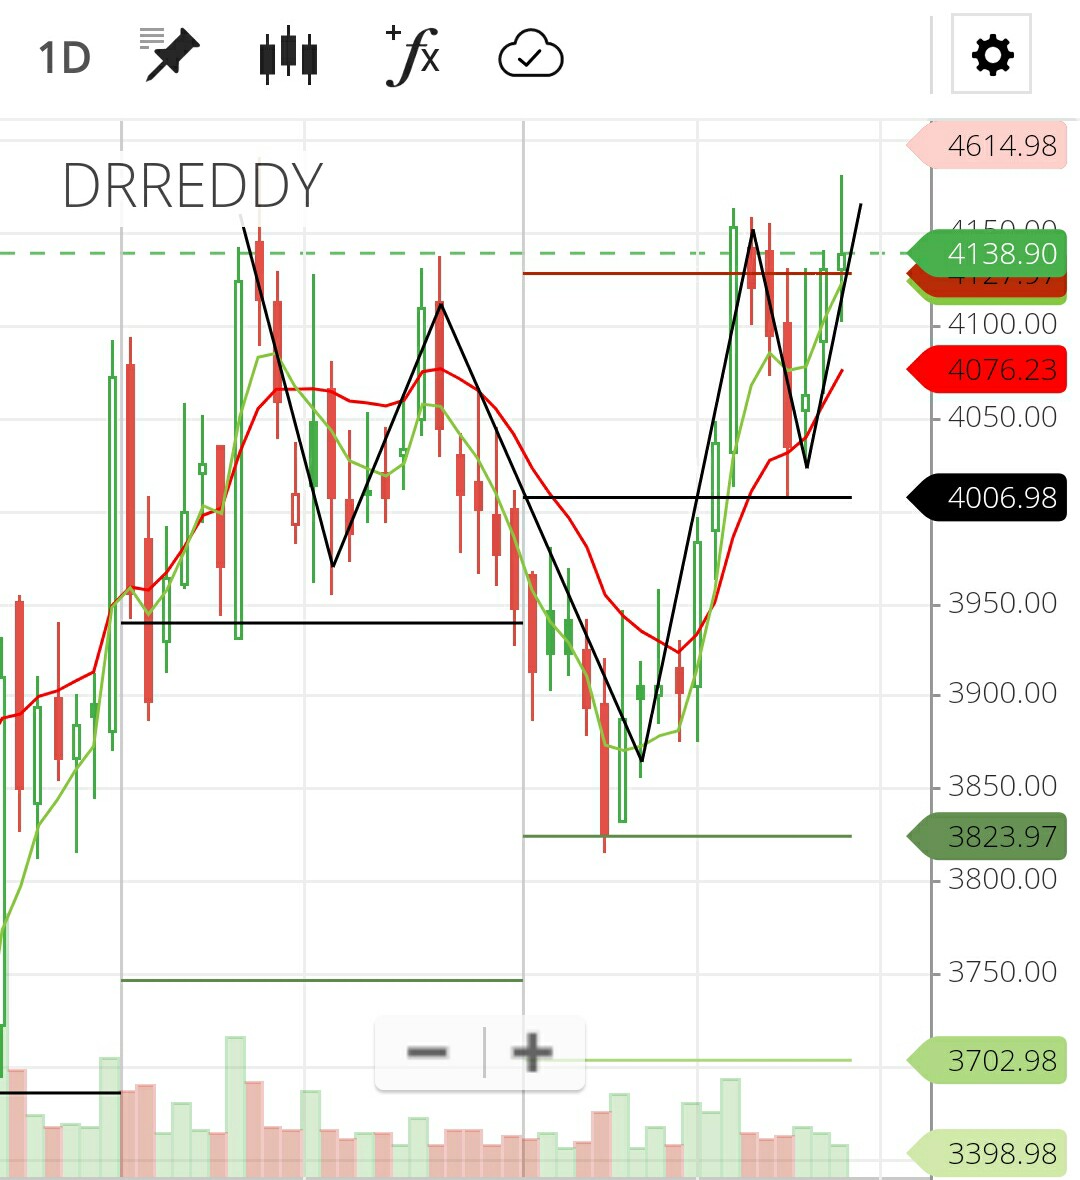
Dr reddy is making reverse head and shoulder pattern.
Bullish sign and the sector is also trending.
Near crucial zone above 4100 for targets around 4350.
Started some positions with strict stop loss.!
3 Likes
Going through the chart of bharti airtel. Same type on pattern on daily as well as weekly charts.
Look for the breakout above 590 - 595 levels with good volumes. Taking support near bottom trend line. 52 week high is also 612.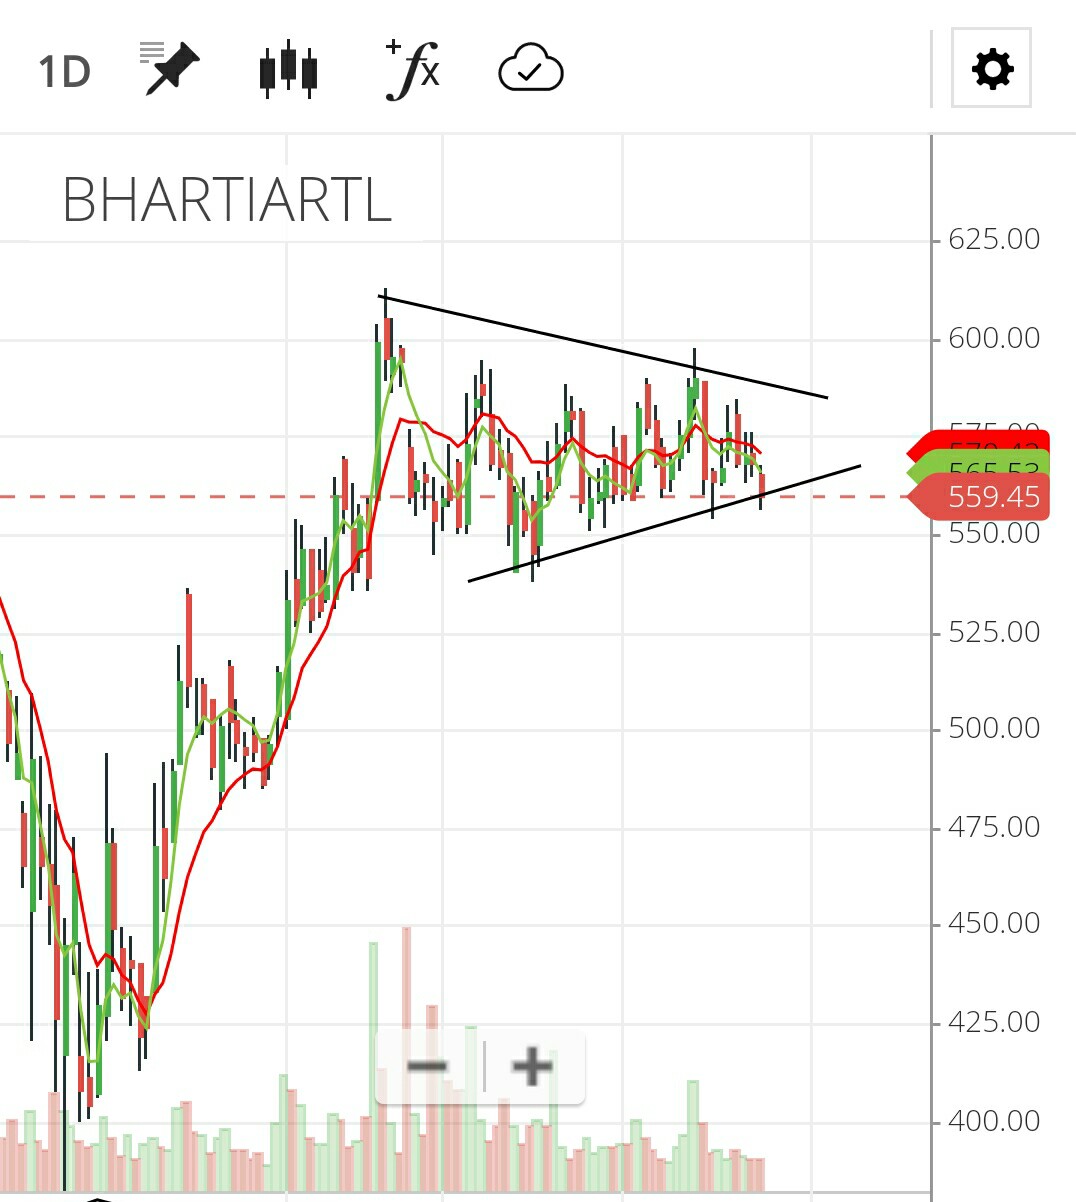
I think telecom sector is having good tailwinds and with vodafone regularly loosing customers airtel is bound to benefit from that. Best ARPU in sector with practically 2 players.
Recently I have been to mobile shop and no mobile was available (even old models) due to huge demand arising due to study from home. Every parent is buying mobile phone as it is very cheap alternative to laptops. Also each smartphone will require internet connection and hence more revenue for sector. Even poor villagers are forced to buy smartphones for study of their children.
Recently with the type of rally seen in reliance based on jio platform even though it is not separately listed, if any good investor information comes in airtel that would be a huge trigger for next round of rally.
Here is the chart. Watching for breakout.
Respected seniors may please share their views and comment on chart.
6 Likes
I was looking at airtel on monthly charts …I can see a negative divergence in rsi …and this is happening very near to the 12 year resistance …I think going long above 630 monthly close would be safer