
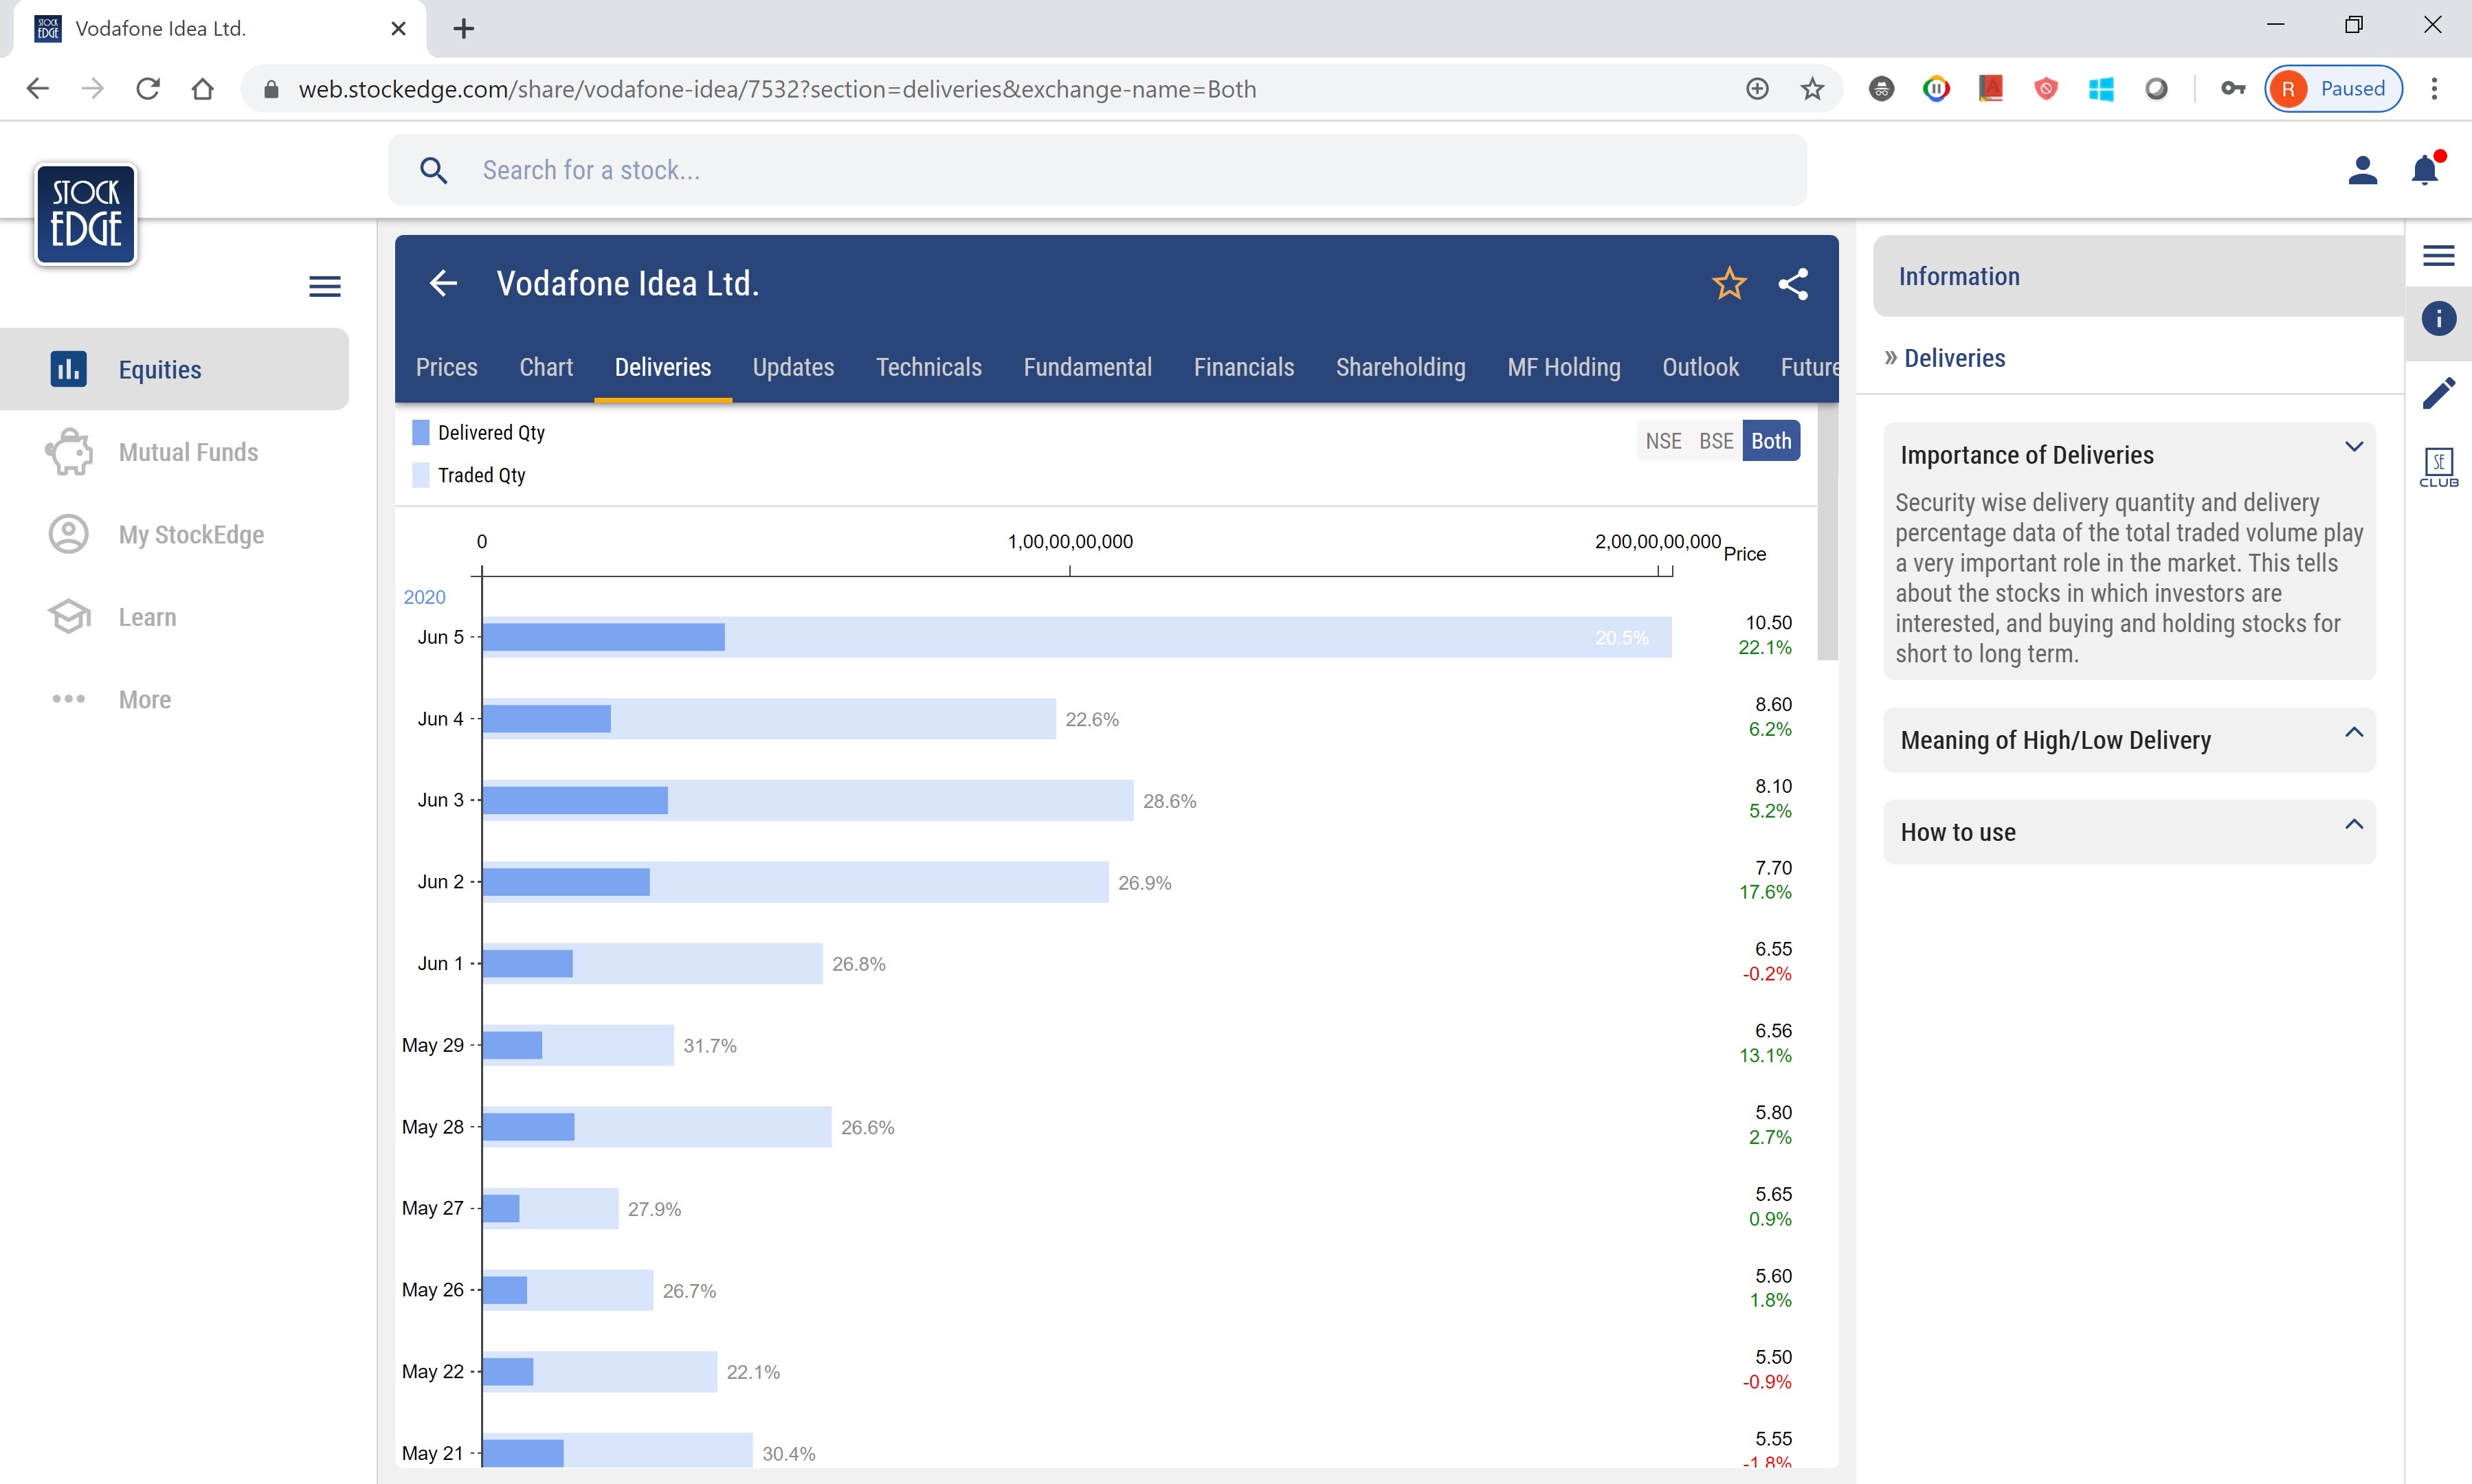
stockedge has volume, Delivery of NSE+BSE
2 Likes
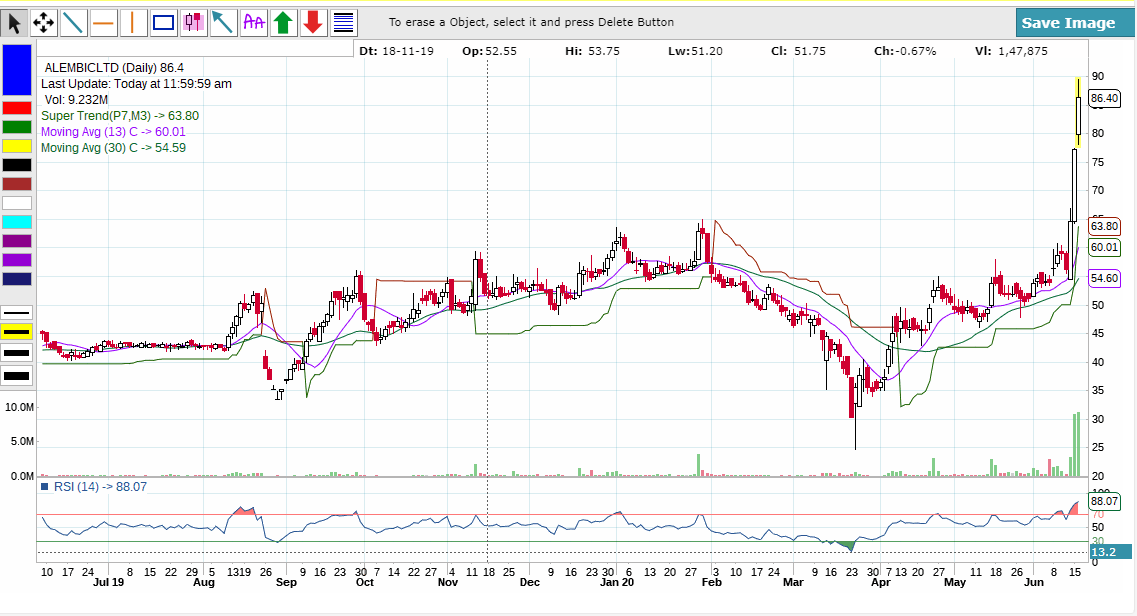
Gujarat alkali - Cup and handle pattern
This doesn’t give it along with the price chart like the one given by rajanprabhu above
I have checked the delivery% only in NSE
https://www1.nseindia.com/products/content/equities/equities/eq_security.htm
What i have noticed is from 09-Mar-2020 to 05-Jun-2020 the ‘% Dly Qt to
Traded Qty’ has reduced from 40.27% to 5.75%
% Dly Qt to Traded Qty on 05-Jun-2020 was 5.75%
I plotted it myself… But its not difficult to do. You can get the data here… Excel plotting would be good enough.
https://www1.nseindia.com/products/content/equities/equities/eq_security.htm
My observations:
In the plot that I posted above c.volume is the cash market volume. As you can see it spiked up when price started falling. Avg. trading volume was below 5 M and its 20M now. With delivery volume down, this means lots if intraday trading. But one need to confirm if the delivery quantity ( in absolute terms ) remains the same. Because trading volume went up 4 times, so lesser delivery percentage ie number of shares take as delivery could still be same ( if you compare absolute numbers). I haven’t checked this.
When price started falling it fell with high delivery volume. Normally this mean long positions got sold ( senior members please correct me if this interpretation is incorrect).
Bajaj finance is a FnO stock, so cash market alone may not give complete picture ( though I may be wrong here).
1 Like
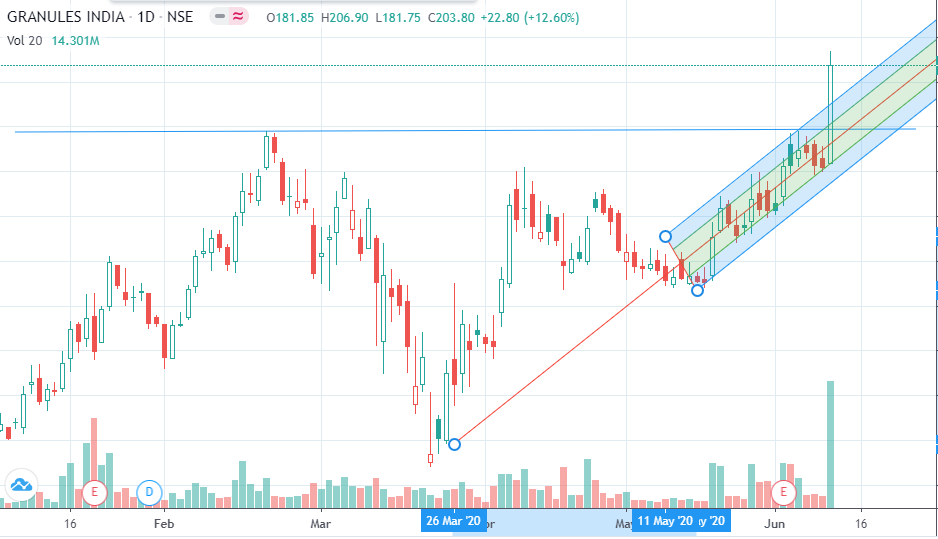
Both volume & price breakout. What does it suggest technically
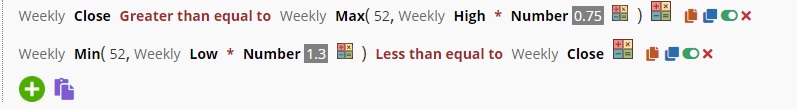
As per Mark Minervini Trend template
- The stock should be at least 30% higher than 52W low
- Not less than 25% lower than 52W High.
Is the below filter in Chartink correct/ in line with Minervini template ?

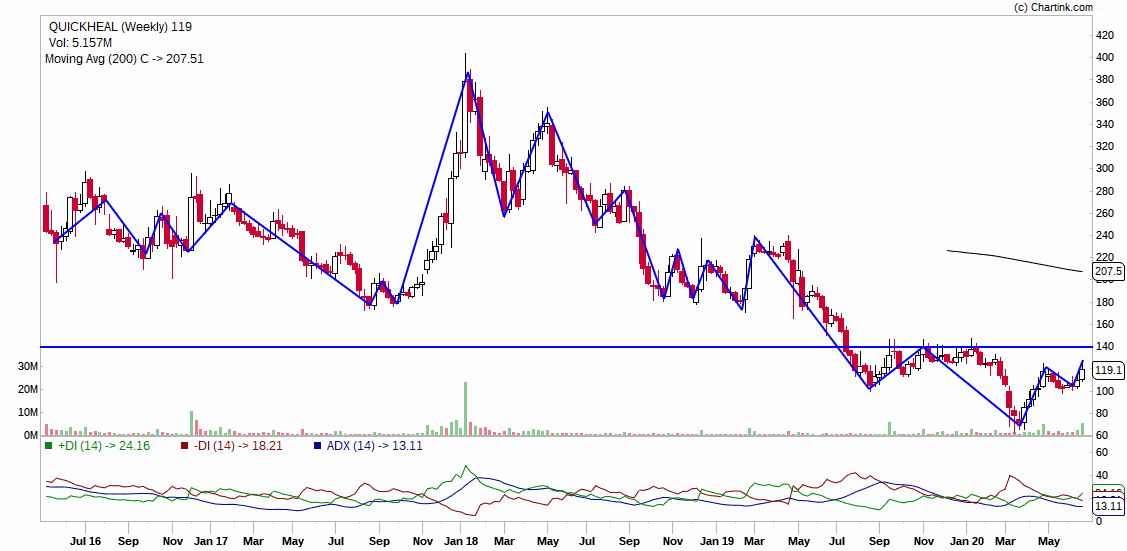
Strong resistance near 139…
time frame of chart posted is all data…weekly…200sma…adx…
its way below 200sma as per all data chart…
only big volume for 2 days will not define next path…deliveries have to be seen for long player entry…delivery percentage on 25th june is 19.4% of total traded volume…delivery on 26th june is 22.8% of total traded volume…
first chart analysis posted on forum…open to to correction or improvement if any…thanks
1 Like
The way Chinese hackers are going bonkers, it will hope to get some much needed lime light sooner than later. Ramesh Damani has been bullish but there is absolutely no traction in sales growth.
Update Nifty formed a higher low at 8807
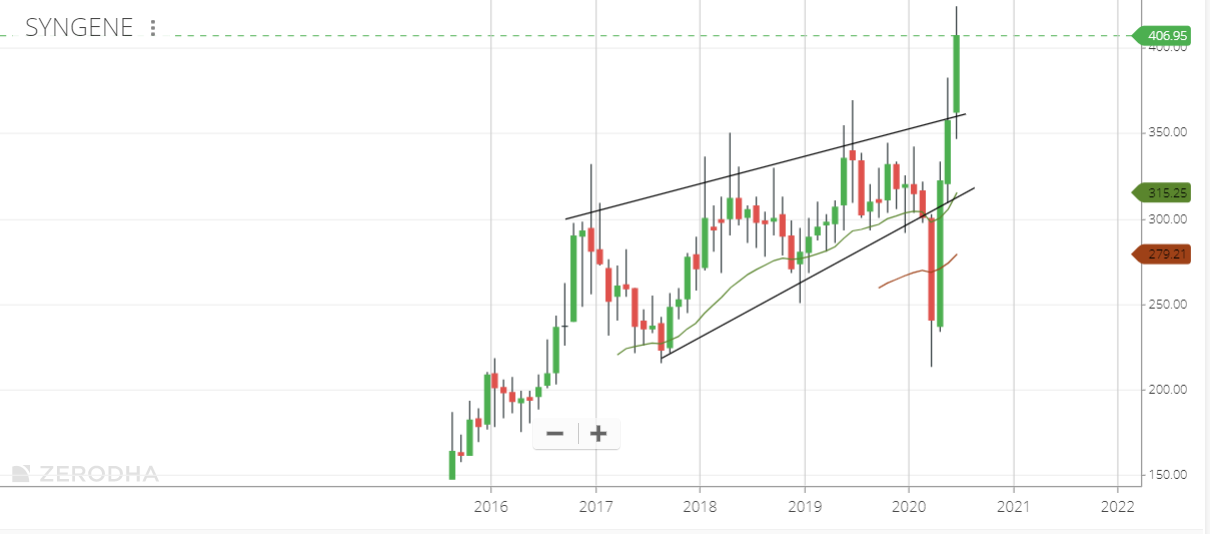
Syngene, Monthly - Broken out of 4 year consolidation. This is a chart I have posted couple of times last year in this thread. The breakout has finally materialized in the current month. There should be more follow-through here based on the contributions from the Mangalore plant which was recently commissioned in Q4.
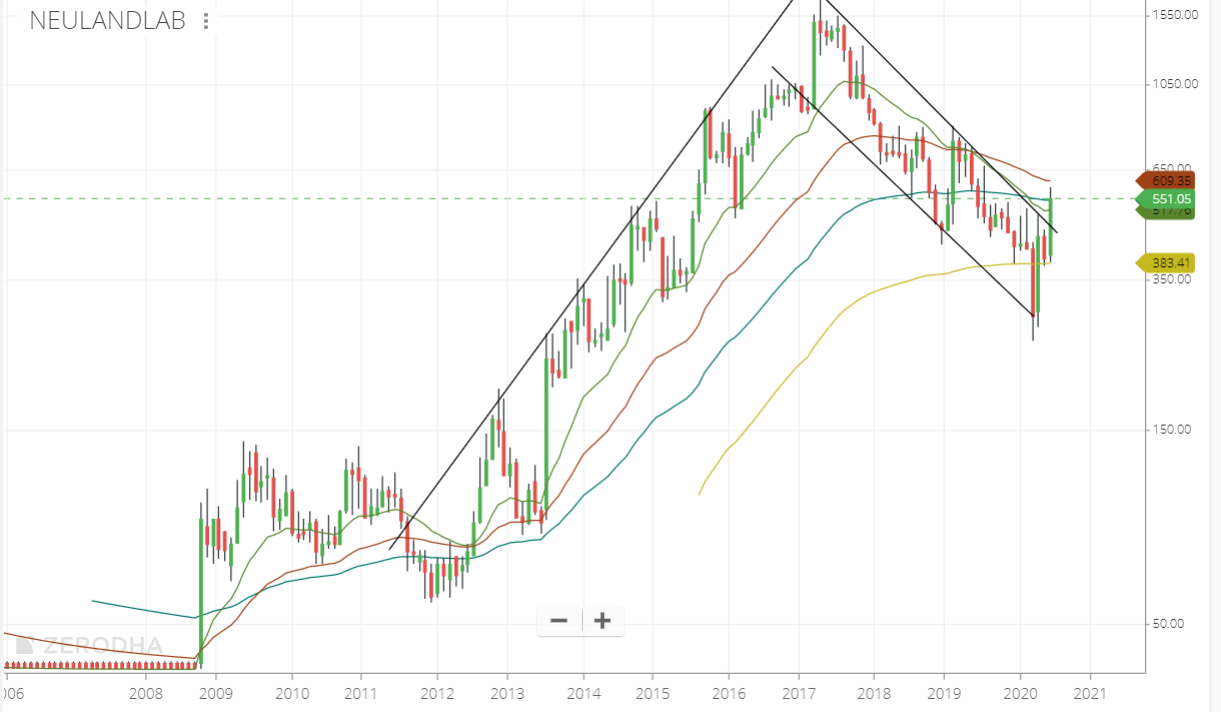
Neuland, Monthly - This is a long, sort of a flag formation (or one of those wave thingies), but if you take near-term which is last 3 years, it was in a downward channel which it has broken out from this month. Fundamentally appears very strong and is trading very cheap on a EV/EBITDA basis or on a Mcap/Sales basis compared to CDMO peers. PAT appears subdued as they are switching to a new tax regime and there are one-offs.
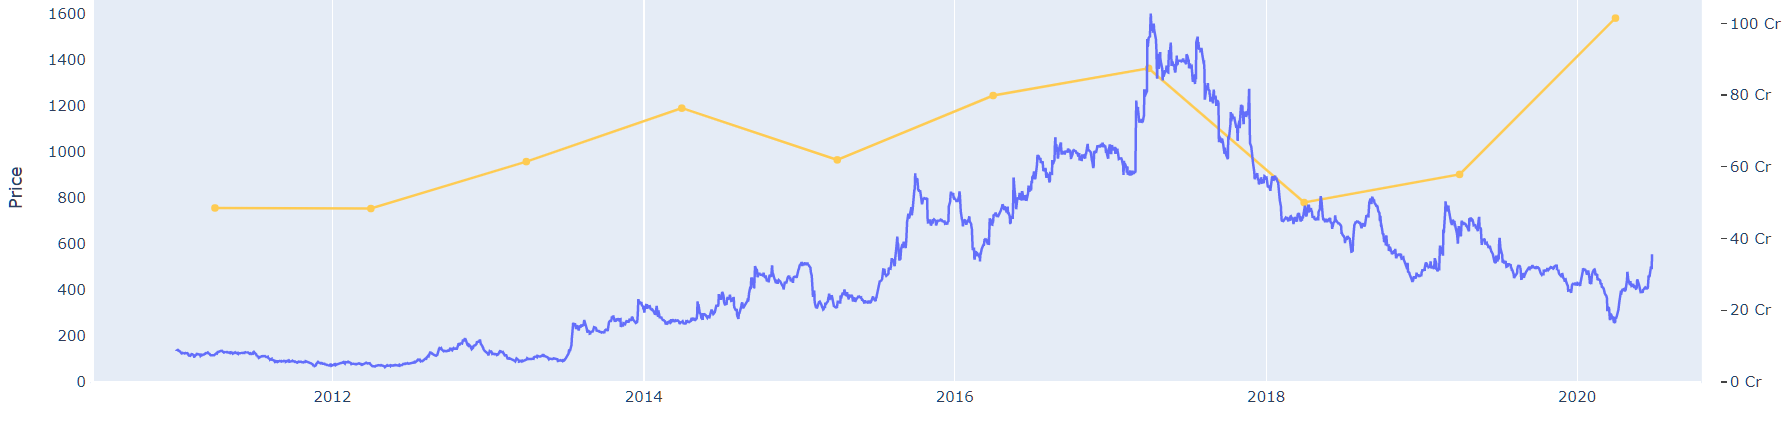
If I have to make a case for Neuland in a couple of charts. Check EBITDA vs Price - Market beat it down at a time when the performance was at their best and so the gap between expectations and reality is at the widest.
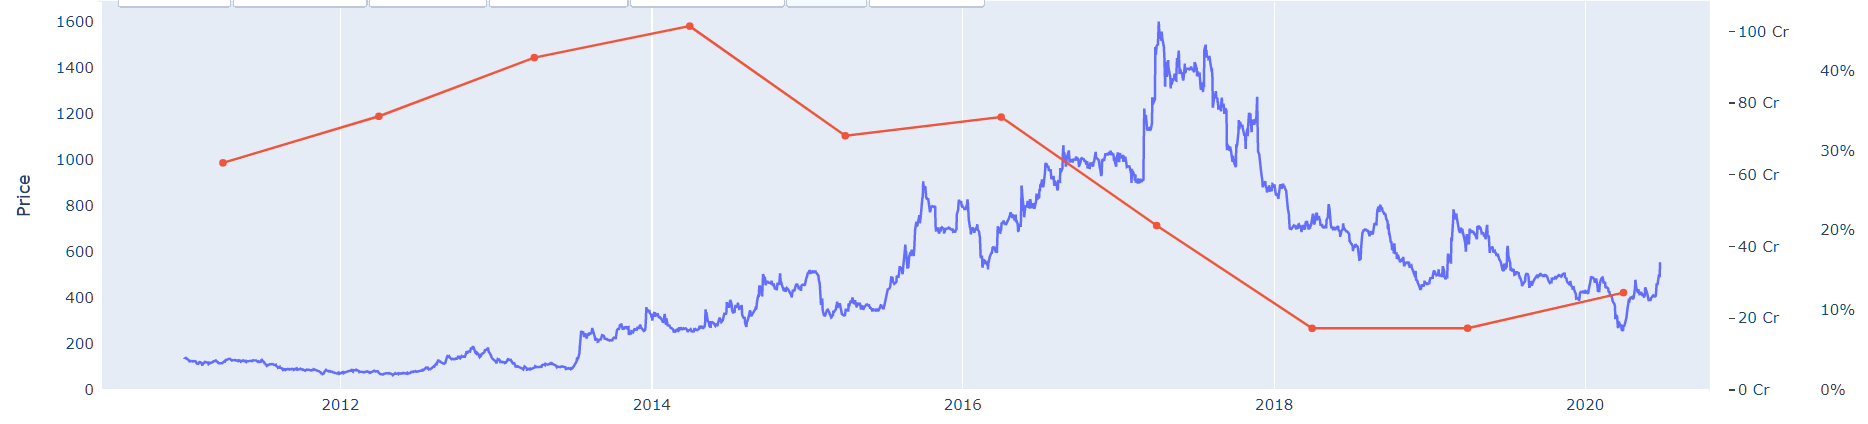
This is how the RoCE has moved. Its always nice to buy businesses that are seeing an upswing in return ratios from single-digits - especially so if they have had 30-40% range in the past.
IEX, Monthly - Re-testing a medium-term trendline. Fundamentally lot of good things happening with the Gas Exchange IGX going live, as well as traded volumes in the DAM segment going up, introduction of real-time market and so on. There is a real possibility of power being purchased via exchanges a lot more than via long-term PPAs, due to large variability in interest rates, throwing IRR calculations off, as well as changes in technologies over the period of the contract causing availability of cheaper power etc. and the recent issues where PPAs were not honored. IEX may benefit if regulations dont play spoilsport.
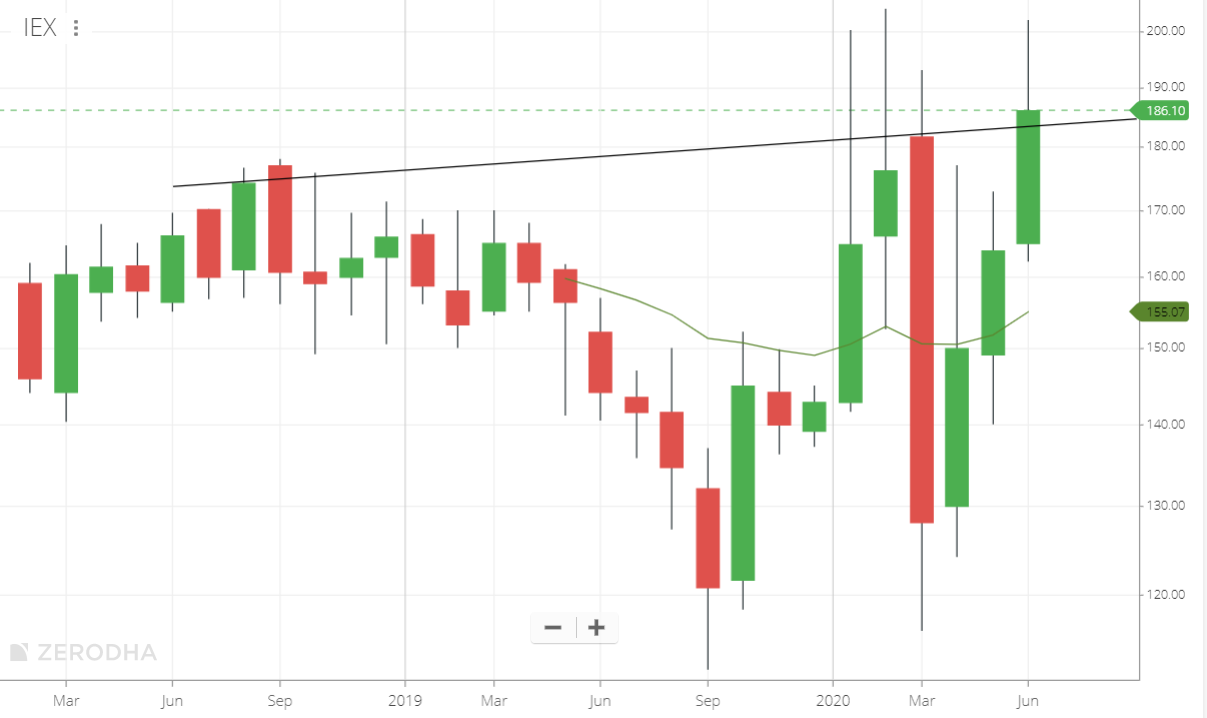
Disc: Have positions in all three - Added Syngene & entered Neuland from earlier this month. IEX from April. Not a SEBI registered advisor, please do your due diligence.
22 Likes
Relative newbie to technical analysis (but not new to market).
I did my first technical buy yesterday late evening - AstraZeneca at 3600
I bought it because it looked like a breakout from the VCP (volatility contraction pattern) with very high volumes. I am planning to stop loss it at 3239
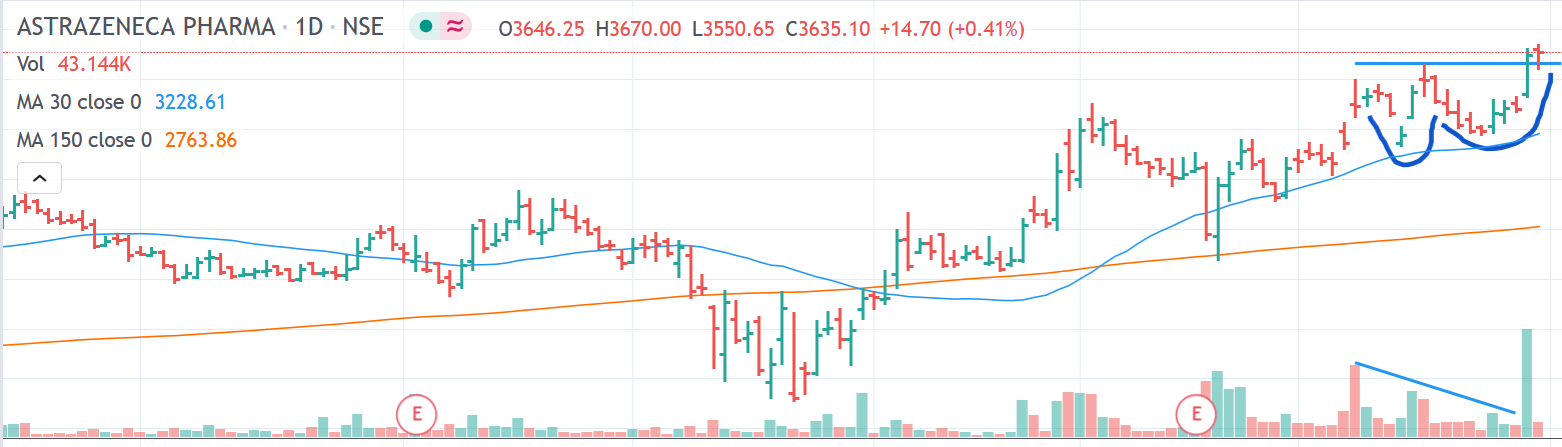
Experienced traders - any comments/suggestions on this buy?
Sometimes FIBO comes handy in taking a broader view I calculate FIBO based on my lines not based on the usual calculation method High/Low Expect reversal from here One can also apply mean reversion theory View negated if #Nifty sustains above 10460

1 Like
