
@phreakv6 What are your chart settings?
EMA : 52 period ( - - - - -)
EMA : 22 period (. . . . . .)
We are seeing a high volume for the NBFC - IFCI and the stock has moved a great deal

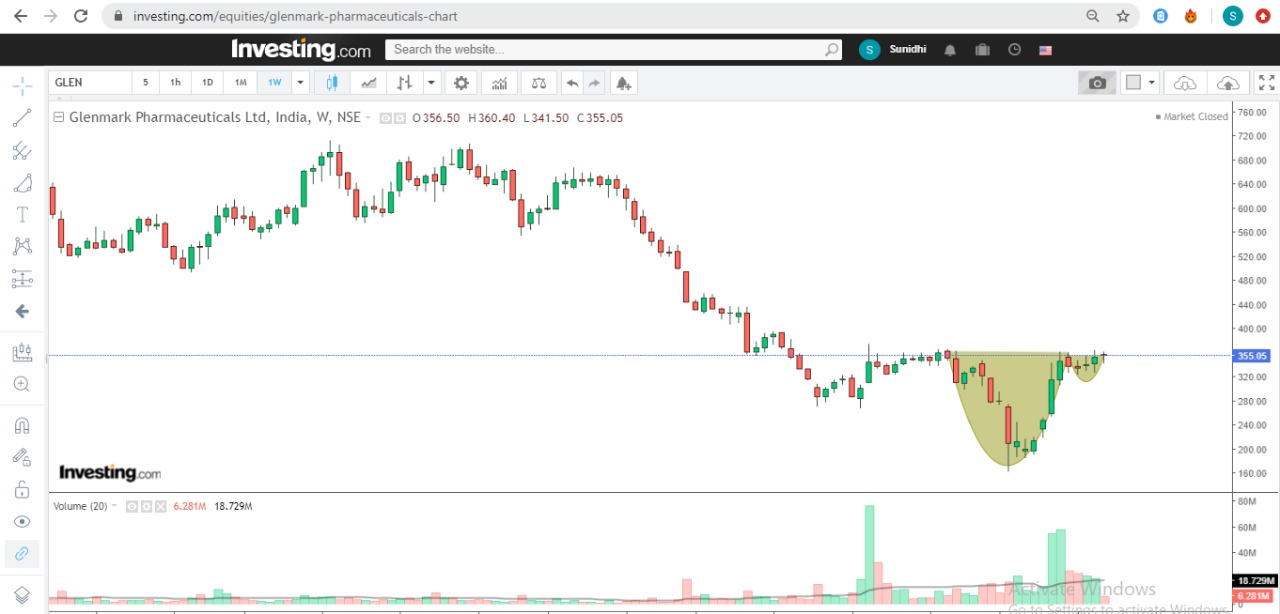
Glenmark showing cup & handle - weekly
Came across this chart on twitter and want to understand… If pattern is correct or not and how can this be looked from volume perspective along with price
My understanding is weekly is stronger than hourly and daily charts…so there are more possibilities of getting resistance of 360-370 broken here
4 Likes
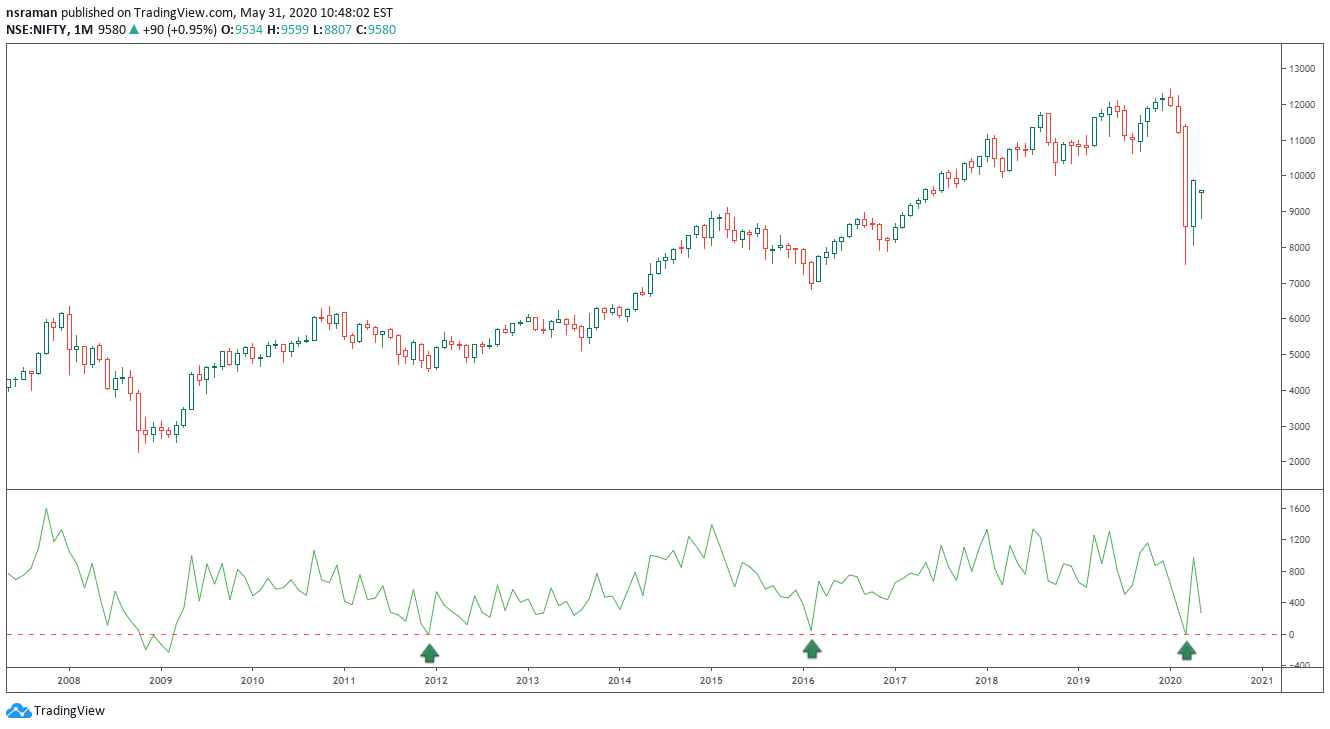
May ended Updated Long term chart for Nifty . My 2 cents 7511 may be the low. I came to know that PFAS fully invested at that level.

Is this Cup & Handle formation?
source - https://www.equityresearch.asia/entries/general/outlook-for-tuesday-nifty-stares-at-imminent-consolidation--risk-reward-skewed-at-higher-levels
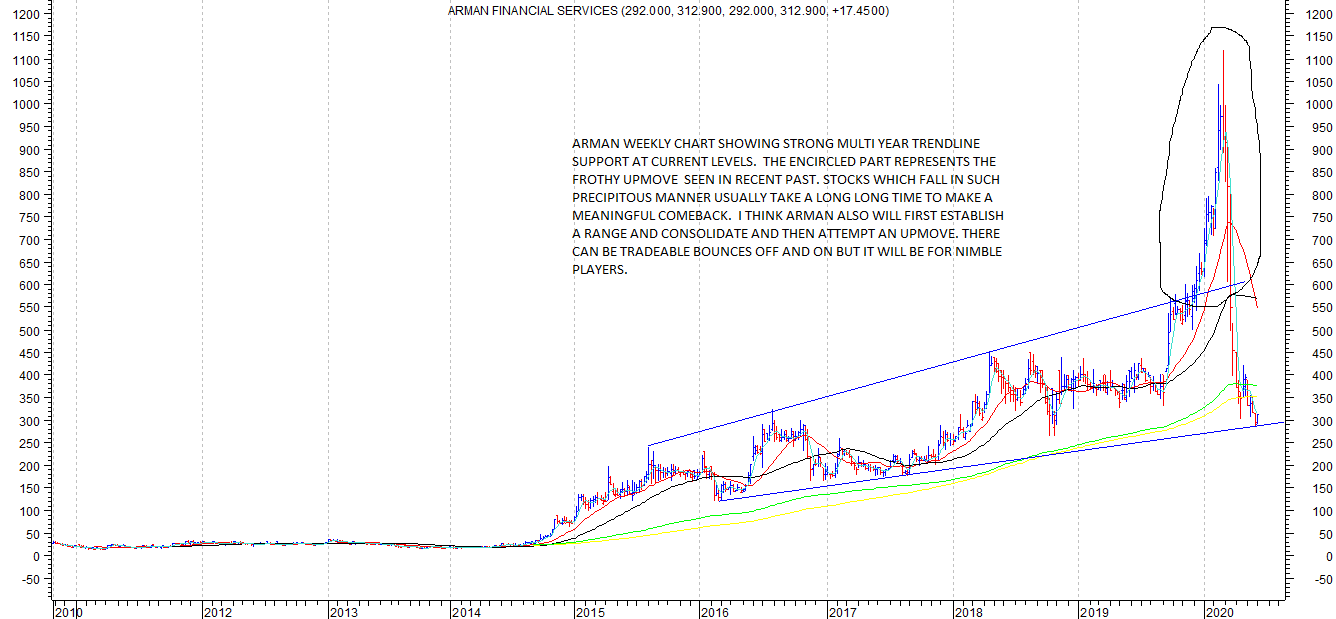
Arman, monthly - At around 1.5 times book, maybe the worst is the price? Management has handled things well during demonetization in terms of stopping disbursements and focusing on collections. This though is a different situation where their usual strategy of door-to-door collections may be having trouble due to Covid-19. Since they lend predominantly to rural which is relatively less affected, it may be able to bounce back sooner relatively. It fell 40% during demon and consolidated for a year. Now it has fallen about 60% (It was very expensive to start with, so the actual fall looks exacerbated). As a good business with decent management, its probably worth looking at. Technically at long term support and available at 2016 prices when their book was about 1/3rd.
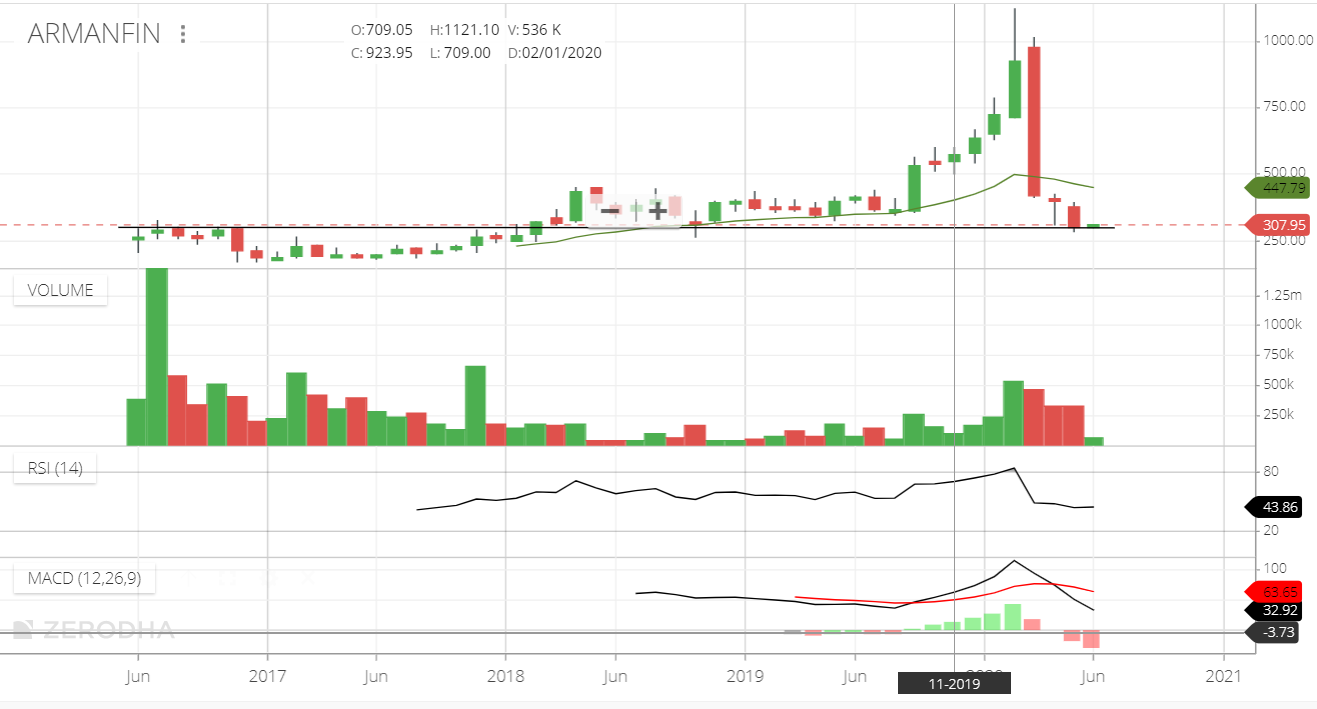
Disc: Have positions from around 300.
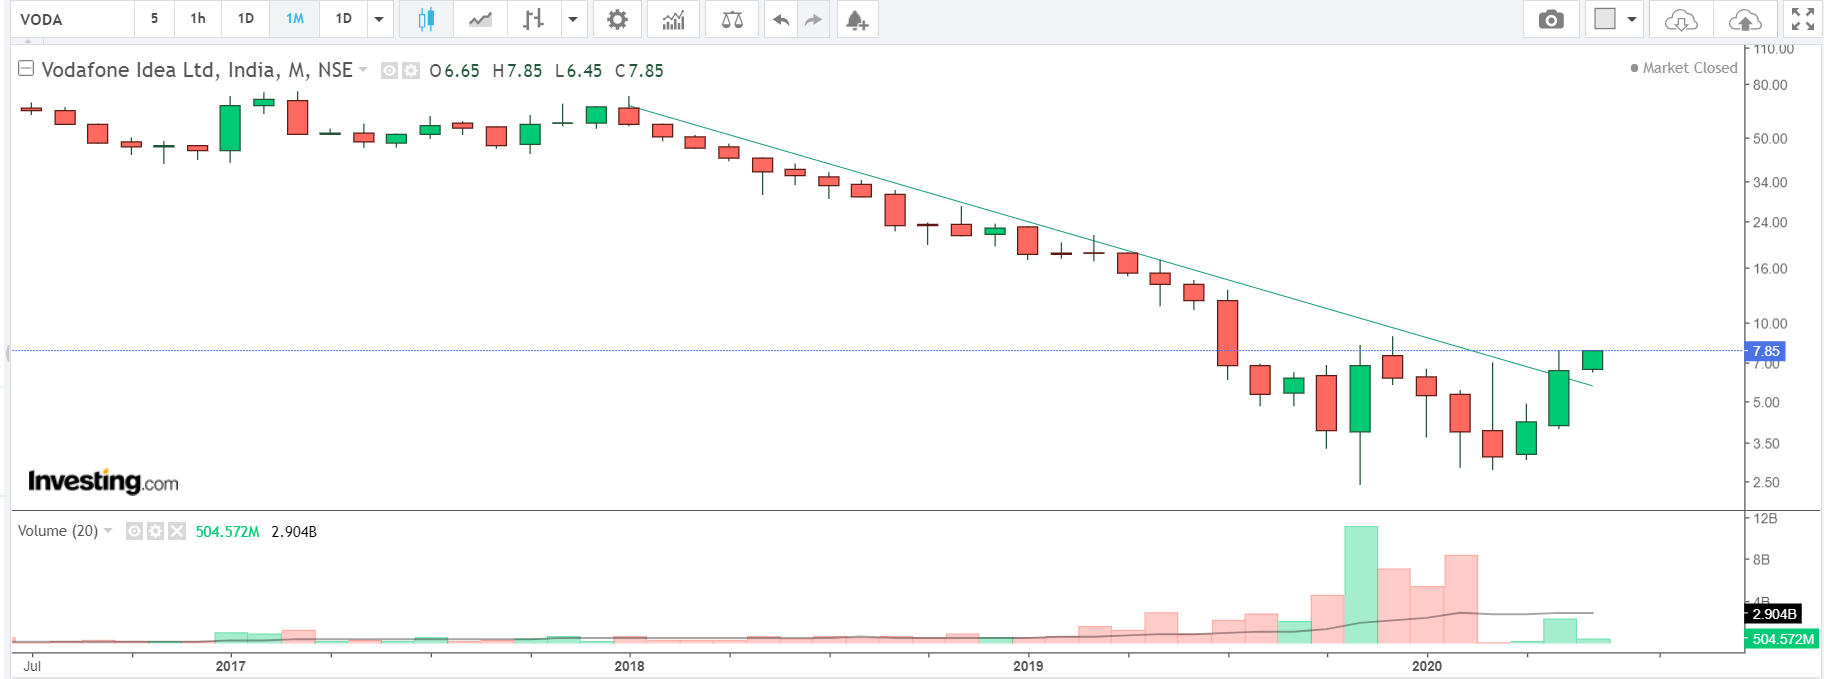
Update: Voda might be breaking out of a long-term downtrend on the monthly. My earlier chart appears to be bit flawed - @value_investor - I think this may have been the reason you asked for my chart settings. Looks like Zerodha’s data has a large incorrect gap down on Mar 29th, 2019. Investing.com’s chart looks to be more accurate. This is in log-scale (I use log-scale for large changes, as it gives a more accurate picture of the psychology).
9 Likes
ARMAN WEEKLY CHART SHOWS A VERY NICE TRADING CHANNEL WITHIN WHICH IT USED TO TRADE BEFORE IT TOOK OFF AND WENT INTO A BUBBLE PHASE AND SUBSEQUENTLY AS HAPPENS WITH ALL BUBBLES, IT BURST BADLY. REST OF THE COMMENTS ON CHART.
12 Likes
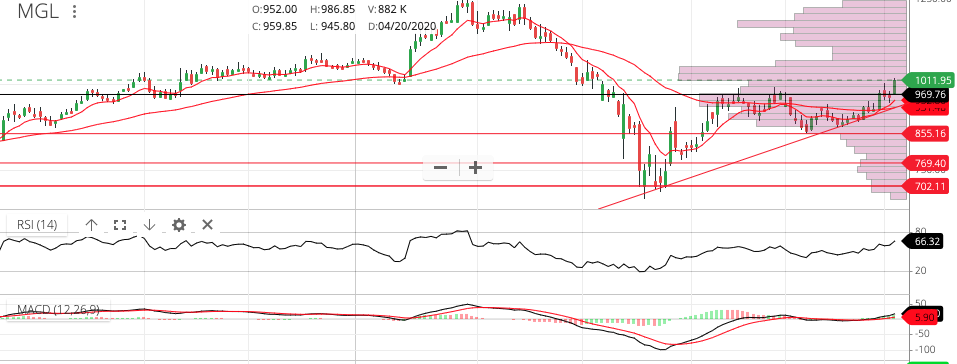
MGL breakout from triangle… RSI > 50 and MACD signal … volume profile buying at 960-70 and support at 960
1 Like
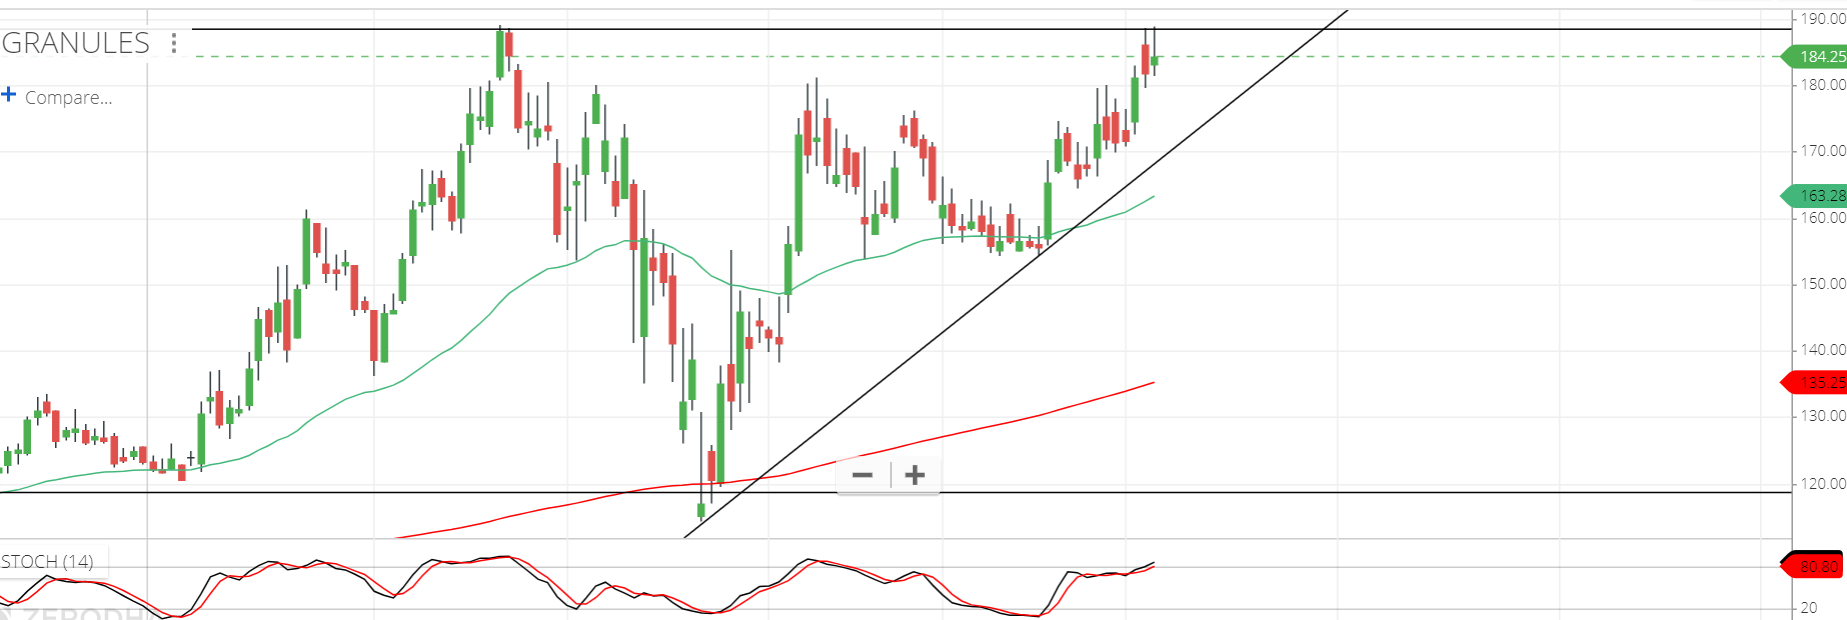
A ascending triangle is getting formed in Granules . Closing above the line which is also their all time will give the big breakout. @hitesh2710 sir your views ?
2 Likes
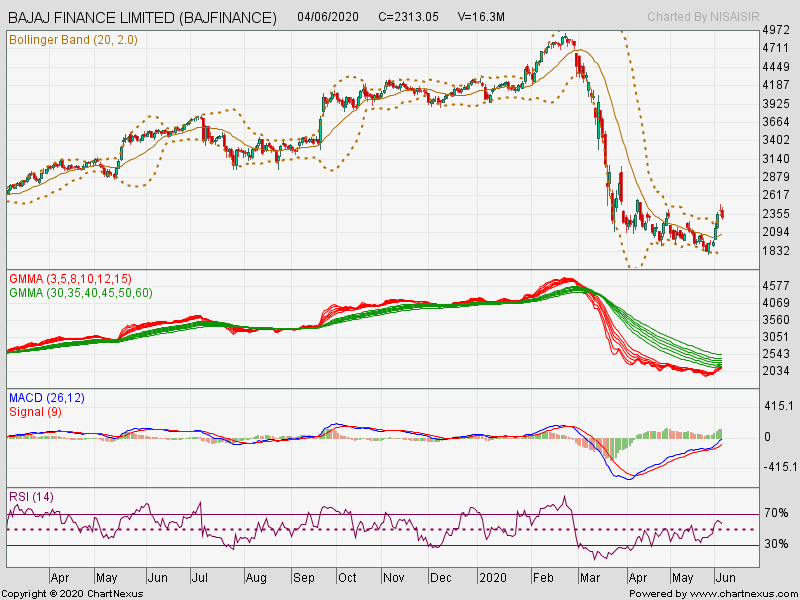
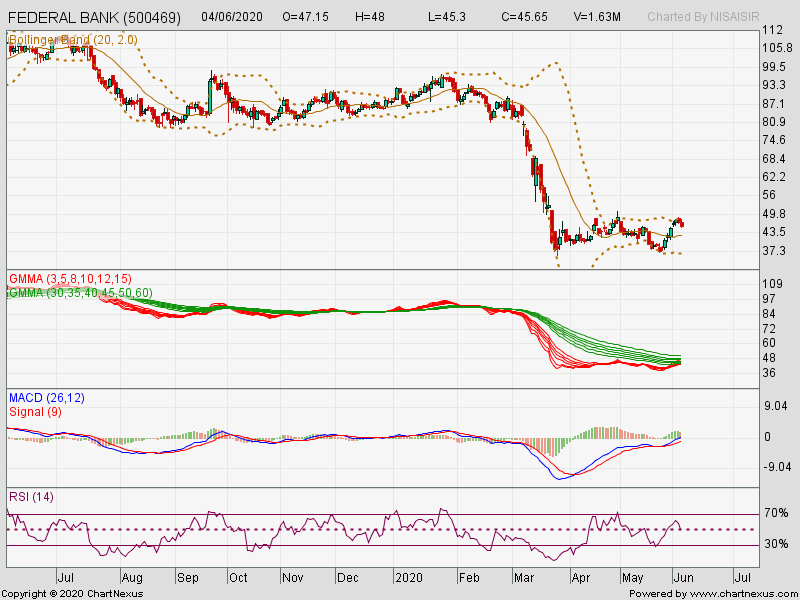
Bajaj Finance and Federal bank are moving in a very narrow price range.
Is it because of accumulation by big players ? How do we confirm whether there was any accumulation in the stock?
I find Bollinger bands and Guppy Moving averages to be useful .
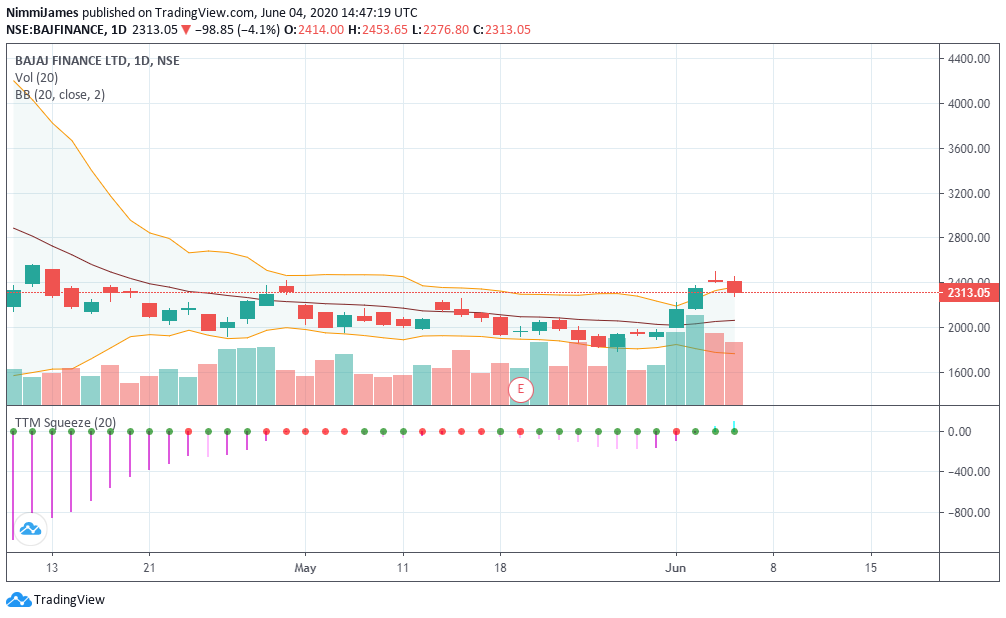
What are other technical indicators that should be looked for Volatility Breakouts ,if one has to play it? Is TTM Squeeze helpful?
My understanding is limited kindly correct me if am wrong.
Disc: Have trading positions in Bajaj Finance
1 Like
bajaj finance seems to be testing multiyear RSI trendline support , i feel there is not much downside left in the stock as technically it seems bouncing off the support line.
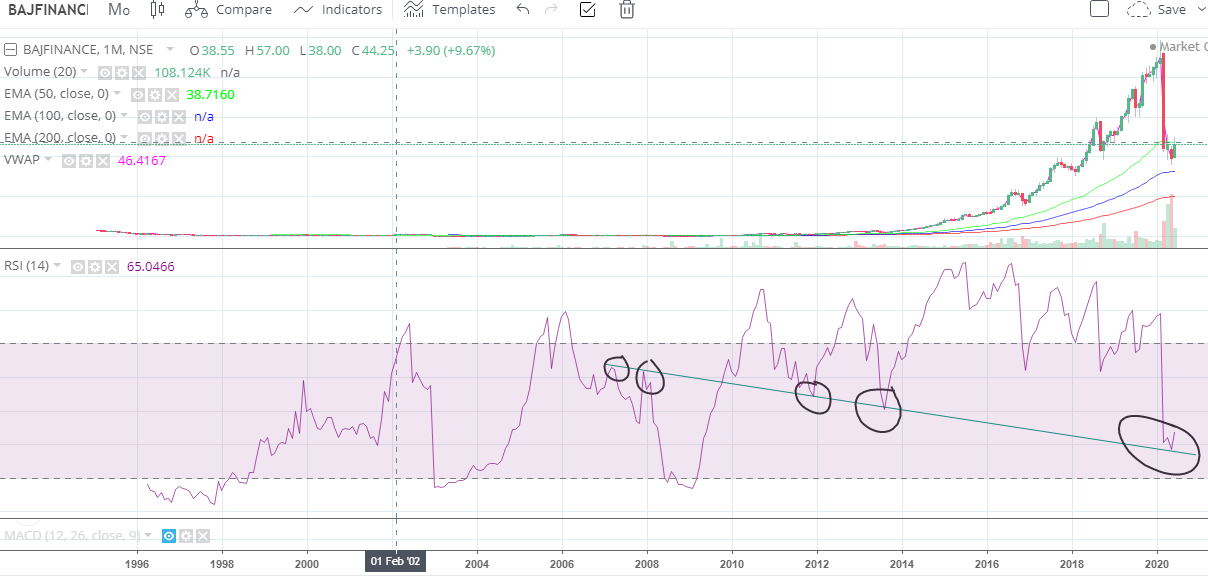
also if i zoom in those two bouncing point from 2012-2014 only then it had monthly MACD bearish crossover.
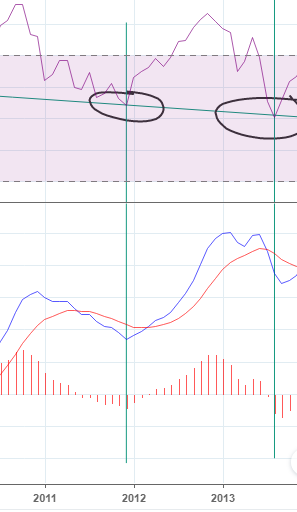
from then the no monthly bearish MACD crossover observed and the current pattern can be the same.
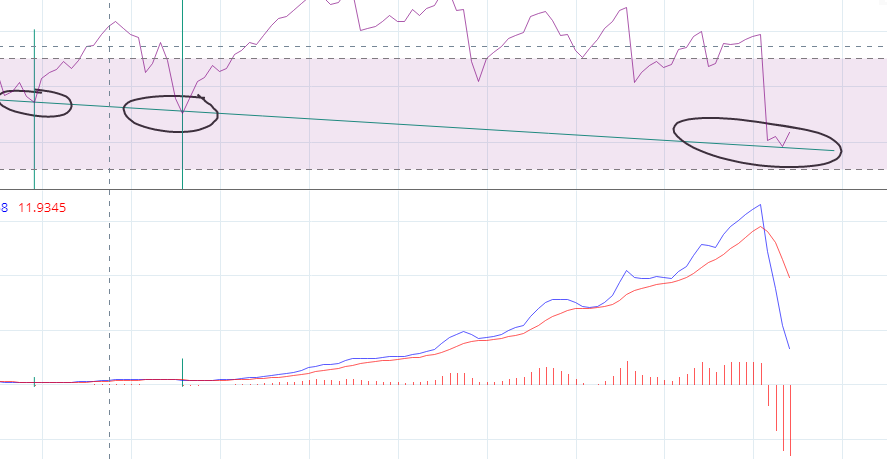
disc- dont have any position just tracking for my analysis.
2 Likes
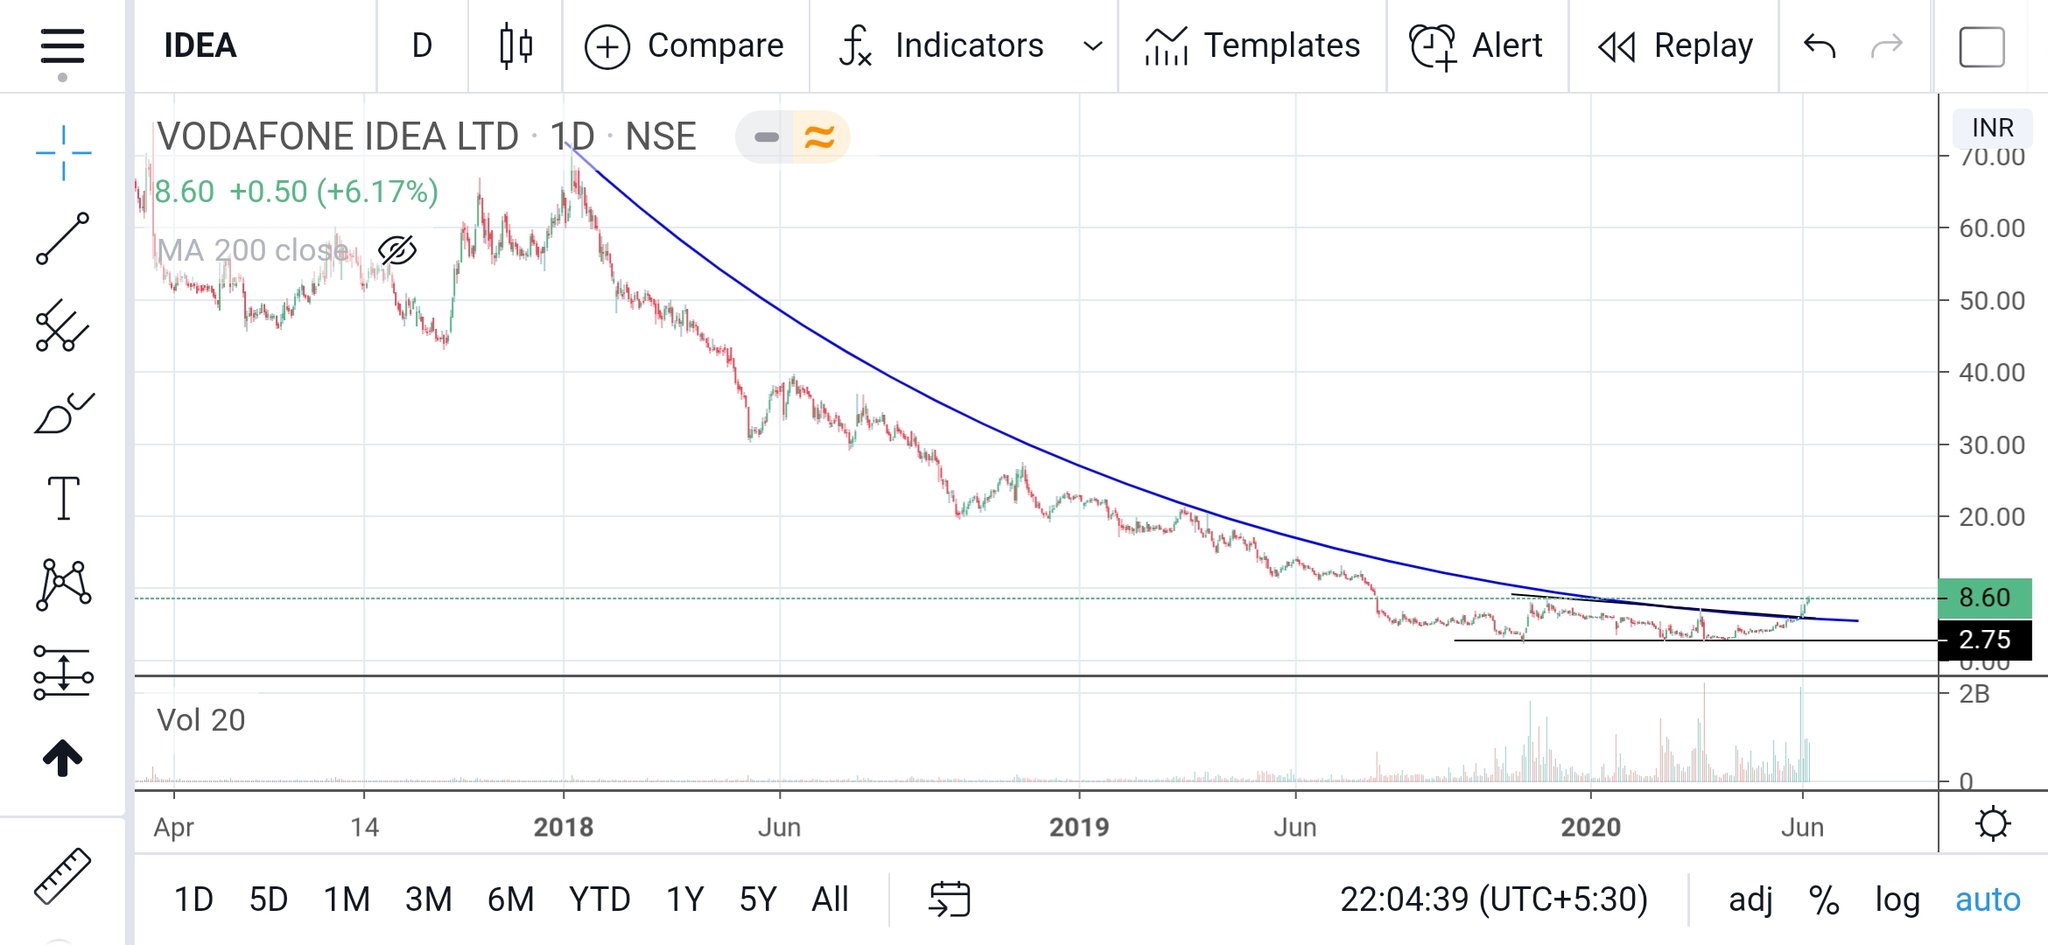
My 2 cents on Voda Idea:
- Triangle breakout- logical target- 12
- Broke inverted parabolic resistance since Jan 2018
- Broke above 200 DMA
Views invited
Disc: Invested
2 Likes
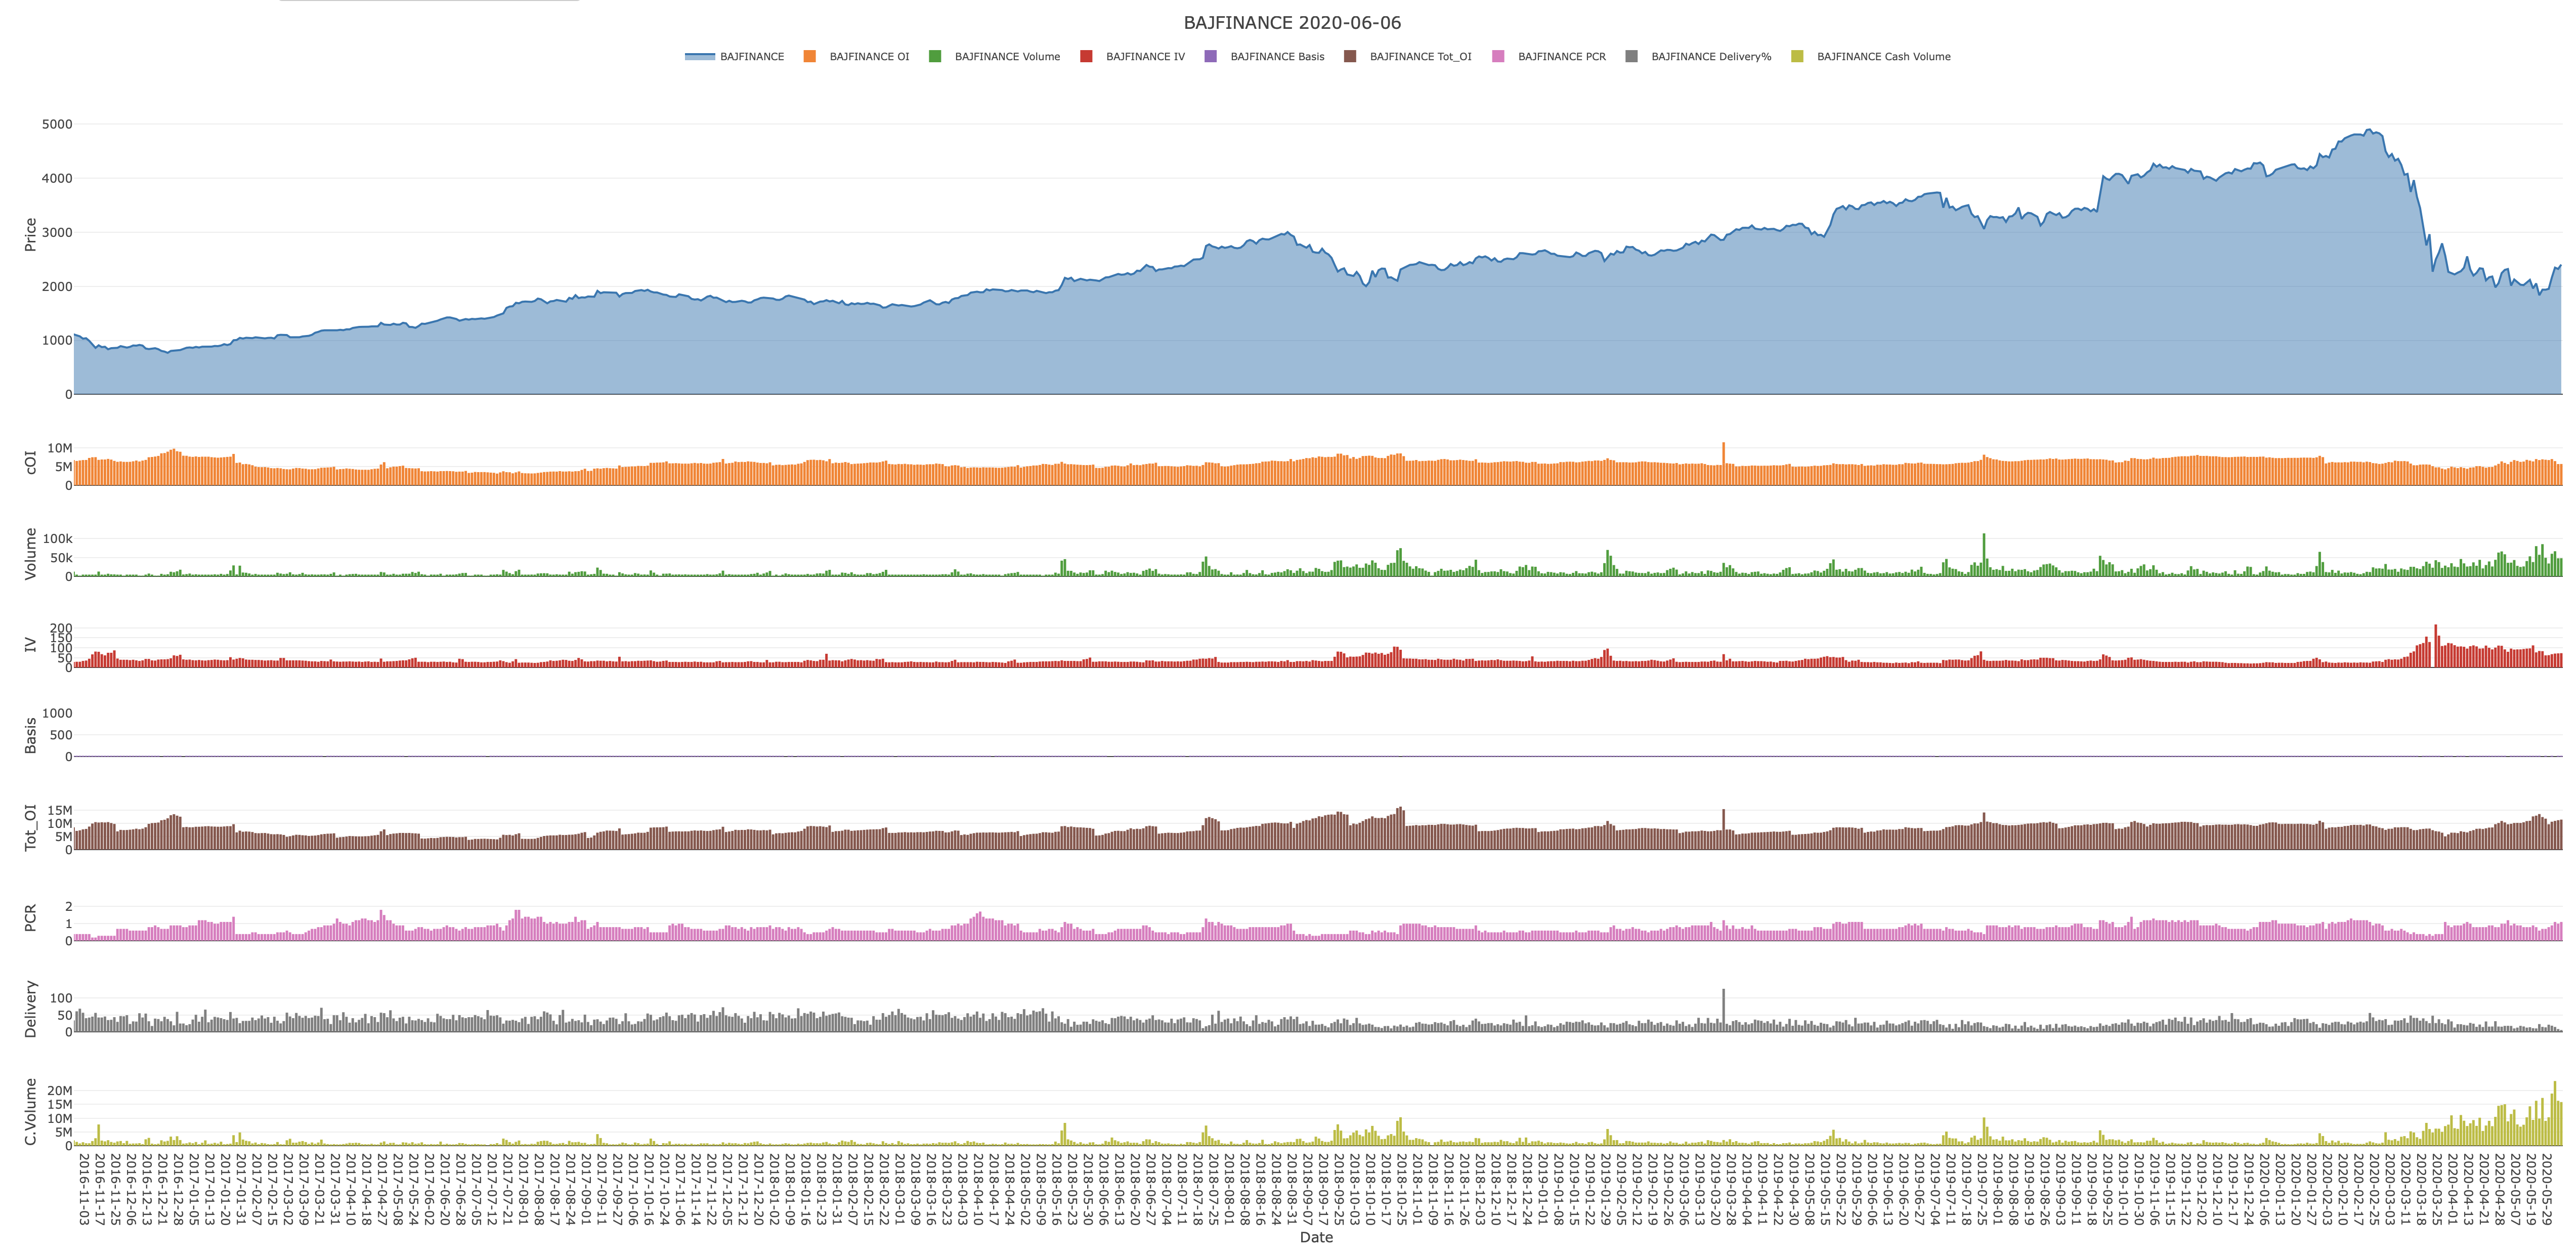
Delivery% in Bajaj Finance is very low. Less than 20%
Not symptomatic of a bottom formation.
4 Likes
@jamit05
This area of consolidation, is a place where more traders will participate so, isn’t it normal for delivery % to go down?
What if the big players are accumulating in small volumes?
I have searched a lot but couldn’t find a way to identify accumulation by big players.
@Ashishk07 Key support level is a area to watch out.
what will happen after this support level get tested, should be observed (based on my understanding).
Thanks for the analysis
My understanding is limited kindly correct me if am wrong.
The long term view for Nifty. Looks like bottom is established . The only caveat nifty should not go below the LT Channel 9048-8578. Updated Nifty chart

3 Likes
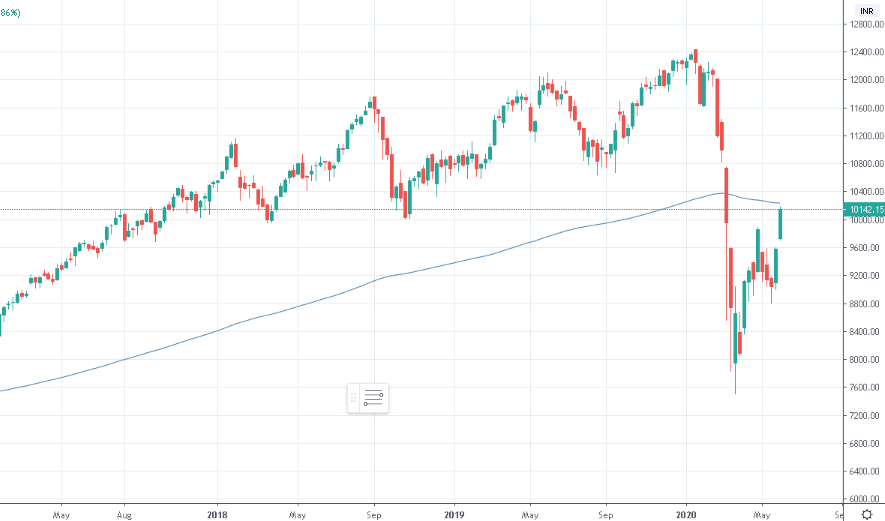
Nifty is finding resistance from 2018 and 2019 lows and, more, importantly the sacrosanct 200-Week Moving Average will be a resistance. But, with the world markets flush with liquidity lets see how Nifty holds-up.
On the downside, there is a big unfilled gap from 8083 to 8446, which might get filled. The case in favour of a strong downmove is that Indian government has not chosen to give flood of monetary support, like the Western Govts have. Plus, the rate of Infections is picking up all across the country, this may cause a round of second lockdowns, which, I believe, Chennai, has already implemented.
Yes, a round of second lockdown could put Nifty into a tizzy and a deeper correction till 8k could happen. At any rate, even if Nifty doesnt go as deep, individual scrips, especially non-Index ones afflicted by the pandemic may continue to correct.
But, generally speaking a fresh low, lower than 7511 might not happen unless there are more surprises.
2 Likes

this video basically shows compilation of few severe falls , it shows that anything can happen so we cant be too positive nor too negative so we can follow a simple approach of timely imvesting smaller amount instead of a large chunk at once and keep in mind that the final market direction will be upward(its just we have to optimise our avg. buying price for max returns and least risk).
3 Likes
Thats the historical delivery percentage of Bajaj Finance… It averages 20-30 %… recently it was high mostly probably long term holders were off loading…
5 Likes
1 Like