Going through Mark Minervini’s book. He has many criteria for screening for stocks one of which is the below
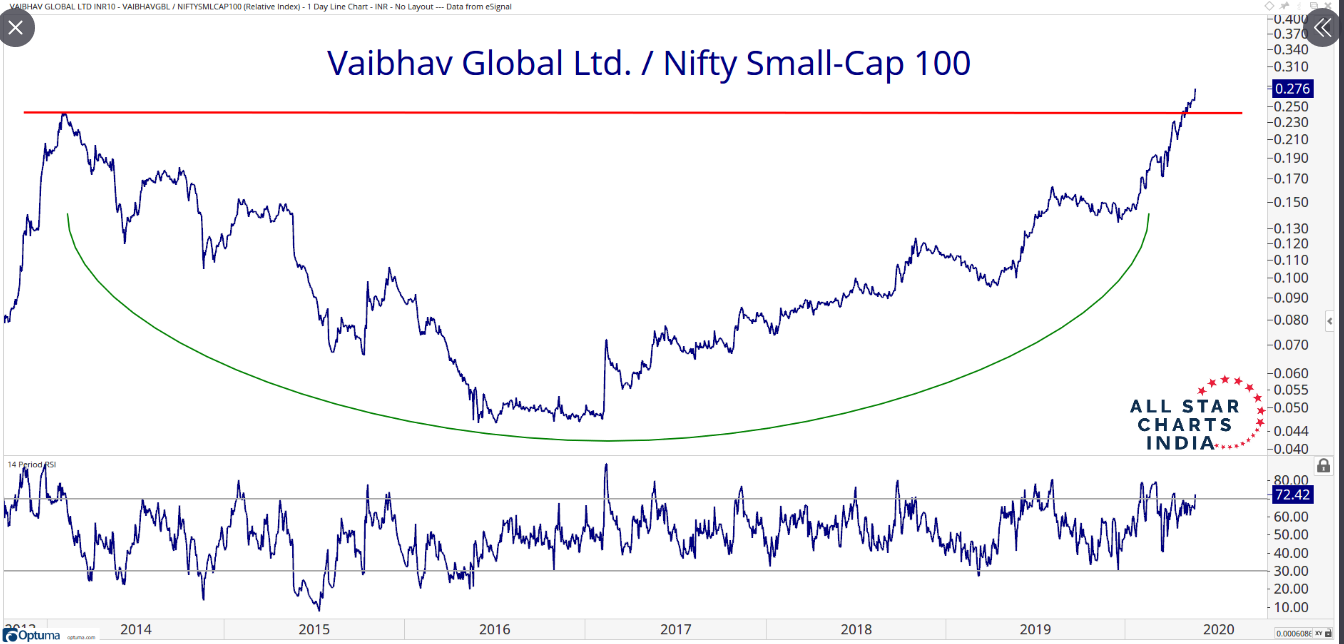
The relative strength (RS) ranking (as reported in Investor’s Business
Daily) is no less than 70, but preferably in the 90s, which will generally be the case with the better selections. (Note: The RS line should not be in a strong downtrend. I like to see the RS line in an uptrend for at least 6 weeks, preferably 13 weeks or more.)
How can I look up something similar for Indian stocks?
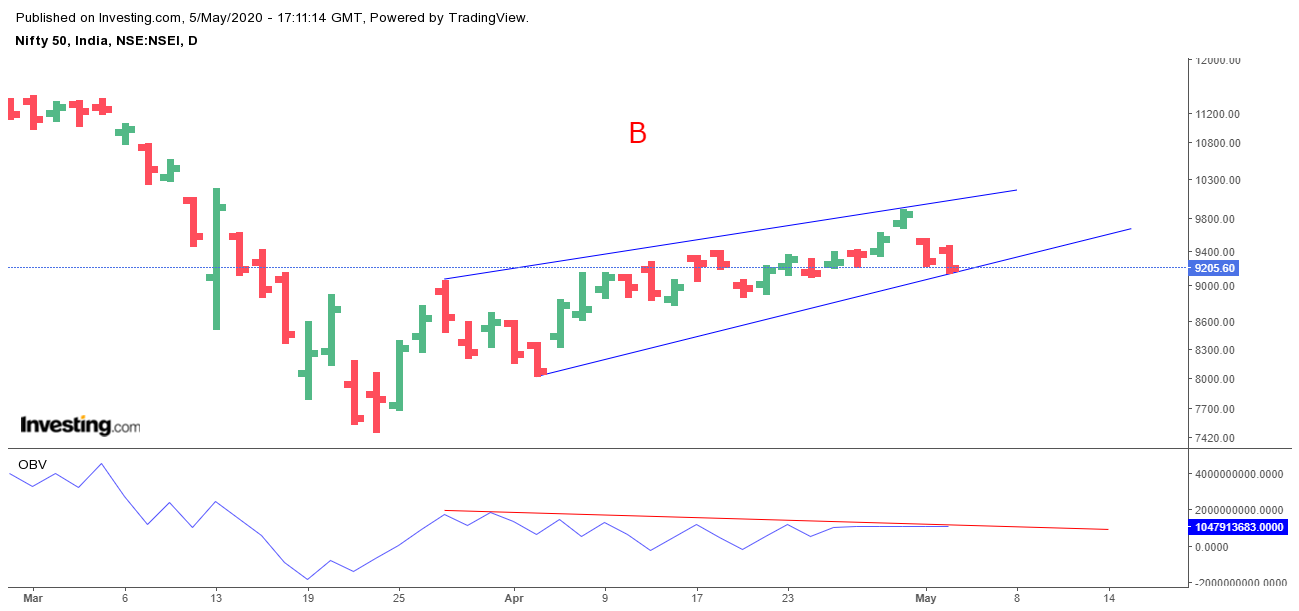
Hii, Can anyone help me with the application of OBV…i noticed following divergence in Nifty during current rally…does it reflect the weakness of rally??
Secondly, there are no leading indicators in technical Analysis, except the price volume and time, from which every other indicators are derived.
If you are interested in volume based indicators, Klinger volume Oscillator is the most useful tbh, besides being an Oscillator it has a moving average to itself, which makes it a far better performer…
i am sure this would be a cliche , but analysing simple indicators like macd rsi with fibs and price action is more than enough …
price spreads can function as a very good leading indicators, the subsequent rallies , not only took more time to advance progressively, but the spreads had decreased, and the closes were poorer, indicating the weakening demand…
initiating a blind short position at the 50% fibonacci mark, is a good gamble with excellent risk to reward in such a scenario
From scientific studies it is seen that the market is random in short term (< 5 months). Recently we have published a paper in the journal Physica A (https://www.sciencedirect.com/science/article/pii/S037843711932014X). Trades usually applies different types of technical tools in this period to identify short term trends, and average return in this period is zero.
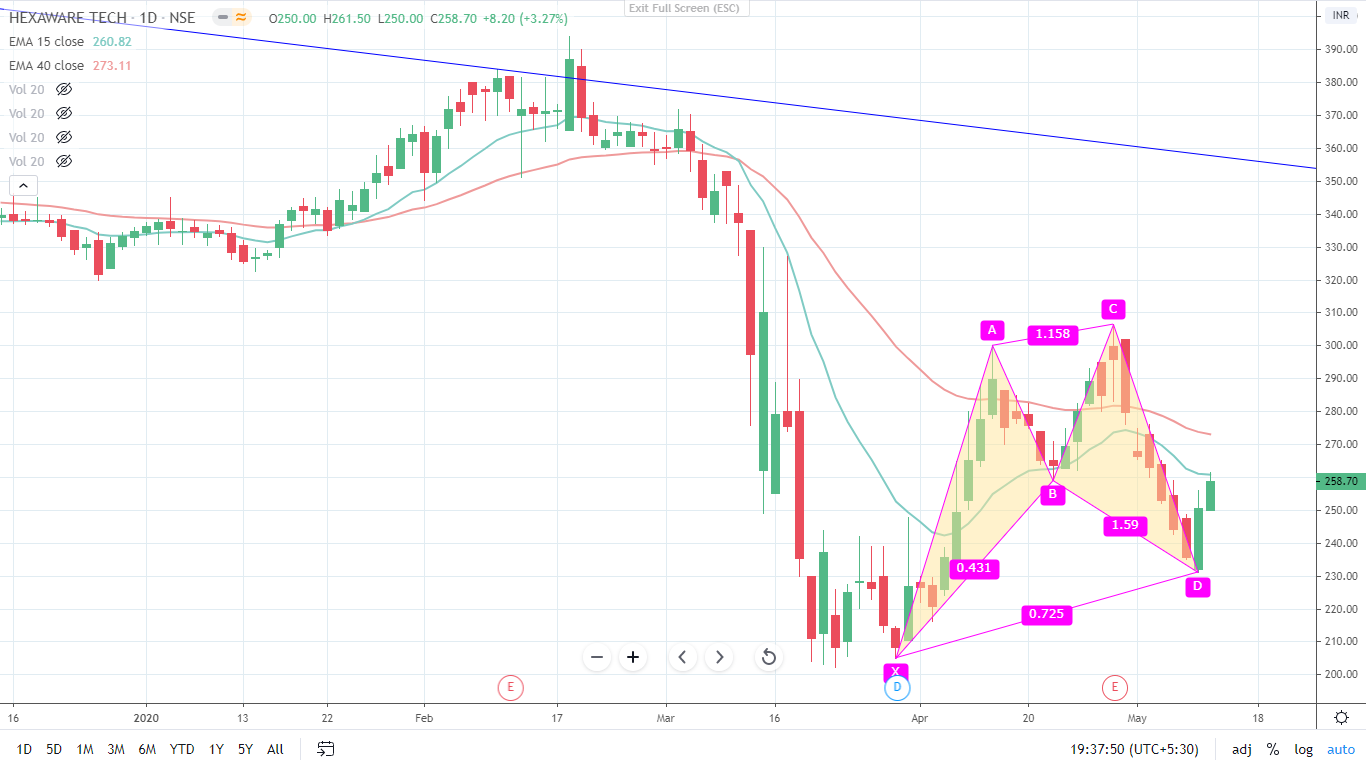
A good bullish harmonic pattern seen on the hexaware charts. Buy point at D and expected price target of Rs 320 which is 61.8% of peak The company came up with good results for FY20 clocking a good growth of 20%+ yoy (in rupee terms) on all parameters with stable margins. The co also had one of the best net new signings for the quarter.
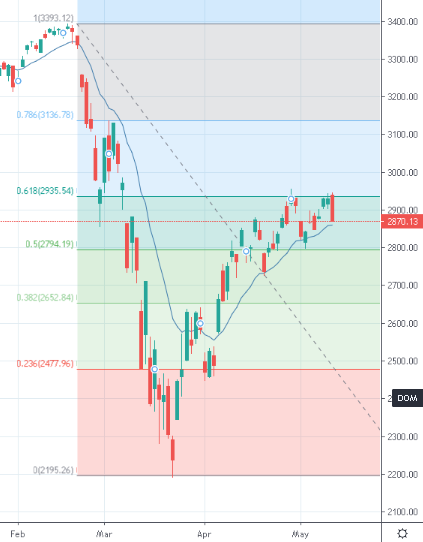
SP500 is taking resistance off its 0.618 resistance. When that happens, the market seldom makes a fresh bottom with any significantly lower numbers. Meaning, SP500 wont break 2200. Thats the bottom for a very long time. (which gives us a broad band of around 2900 - 2200 to work with)
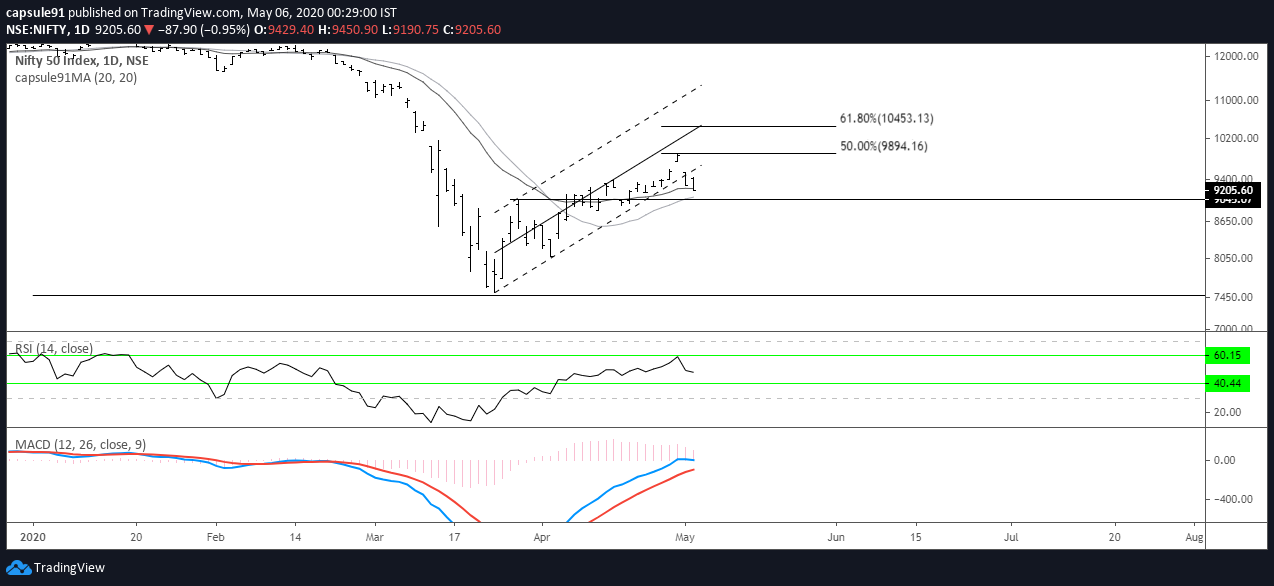
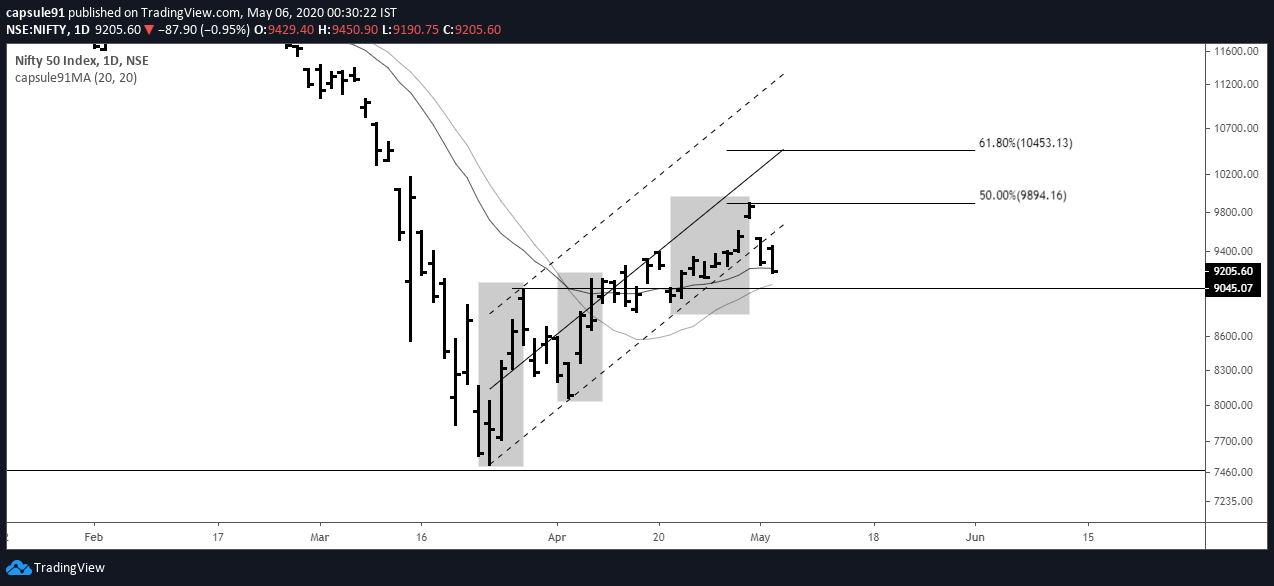
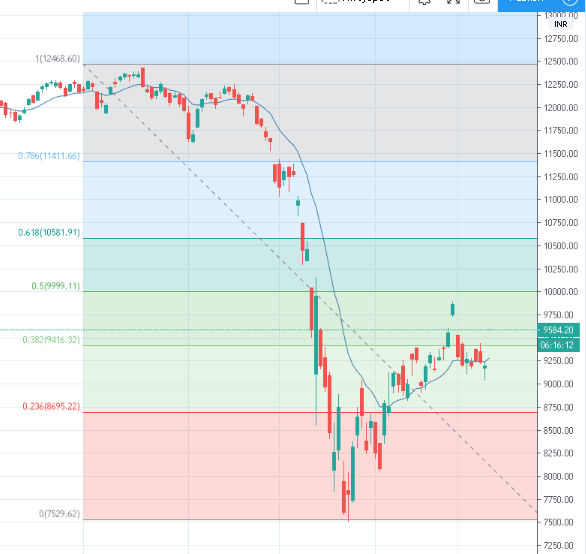
This is a timely notification, because yesterday, bears were in full control, but got beat, and today SGX is 3% up, which makes Nifty open gap up. This might be a start of an uptrend which might last a month, and going as high as its 0.618 level which comes to 10580 (10600 ish). Sarkar has shed 20L Crore to support this theory.
This makes sense, because when the majority is expecting bears to take over because of bad Quarterlies, Corona, and various headwinds, the market doesnt fail to surprise. How else is it going to be a negative sum game?
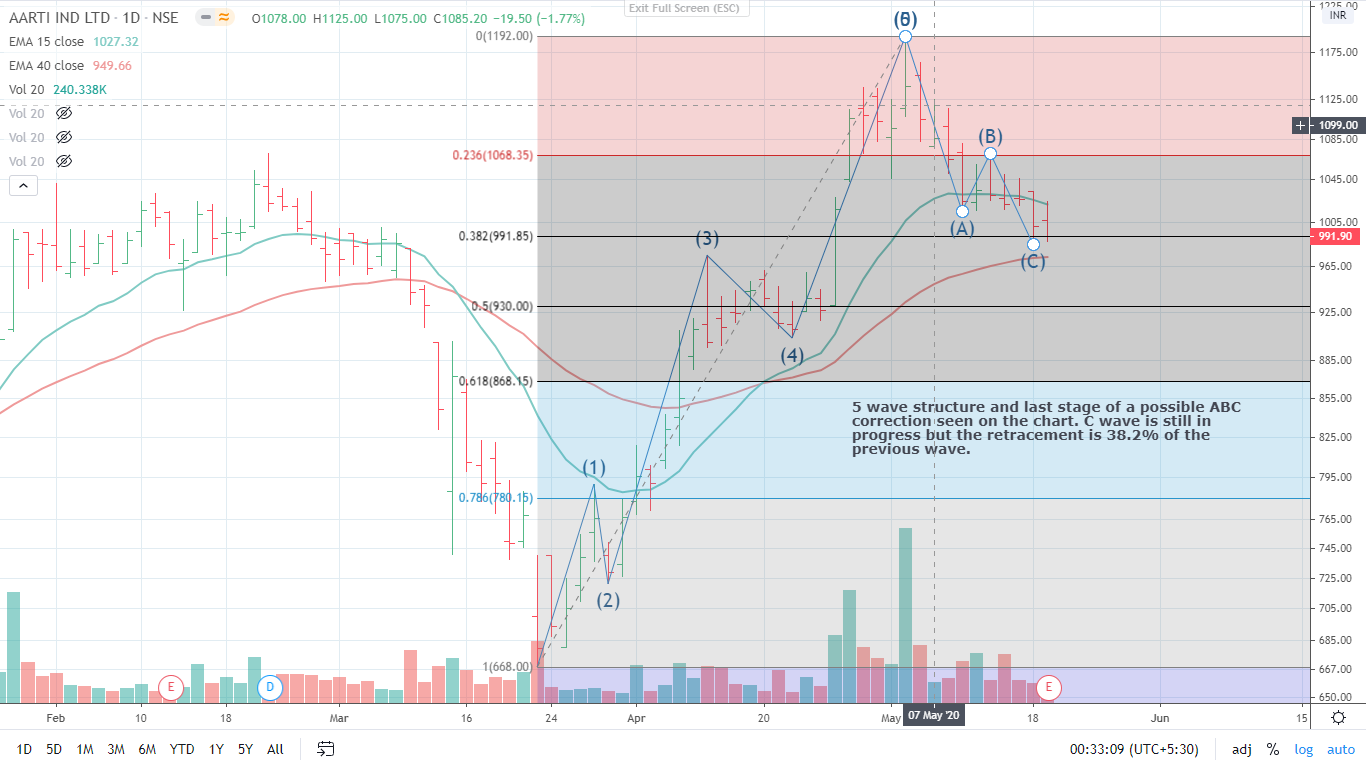
Aarti industries - Comments on chart. Fundamentally, many of the long terms contracts that Aarti Inds had sealed were to contribute to topline from Q4-20/Q1-21 onwards. These are all contracts with superior margins. With marquee clients the co is embarking on an aggressive expansion drive. Covid impact will become clear soon.
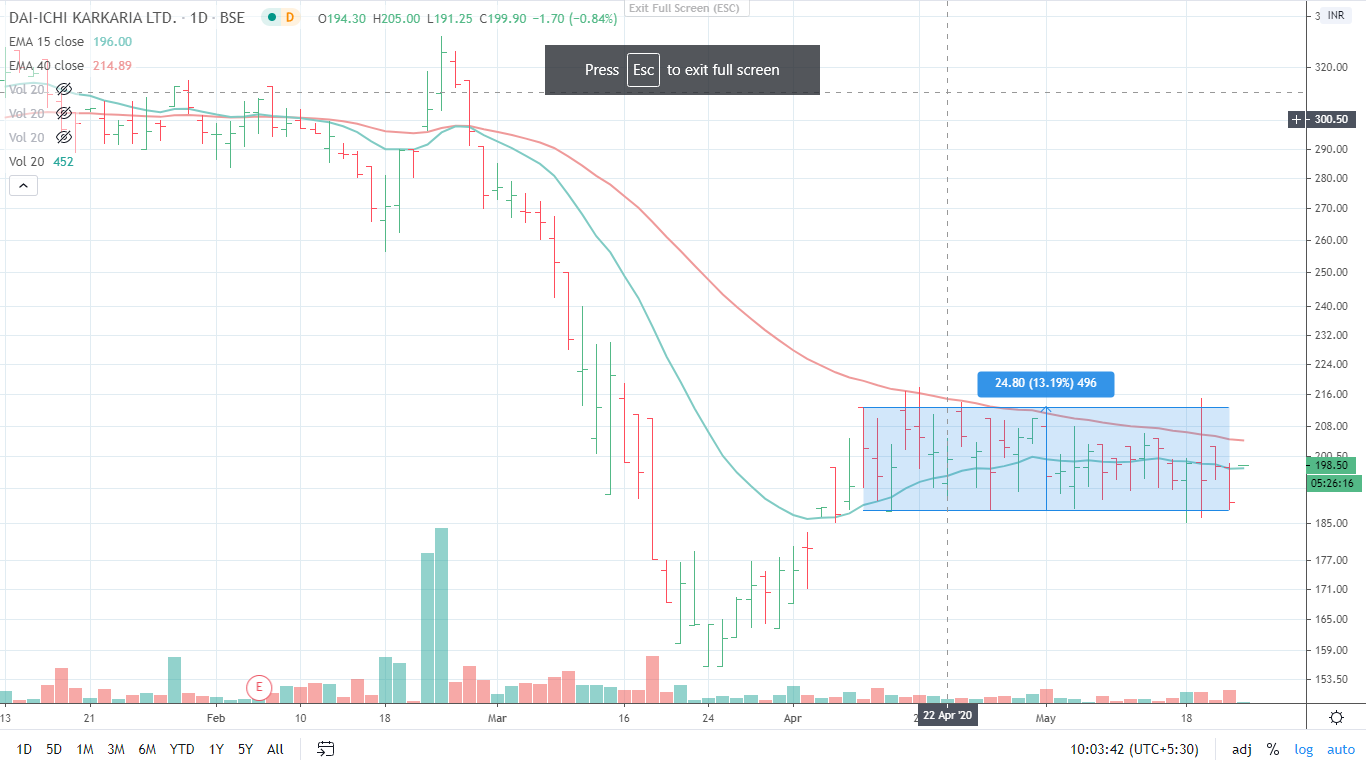
Rectangular consolidation seen on Daiichi charts. Daiichi recently shifted its Pune operations to Dahej by selling a major part of its premises located in the prime areas of PCMC, pune to a Pune based real estate developer. This move could not have been more fortuitious as much of Pune is under lockdown while Guj has already started resumed operations some time back. The co earlier was working at 100% capacity and doubled its capacity at the new Dahej plants
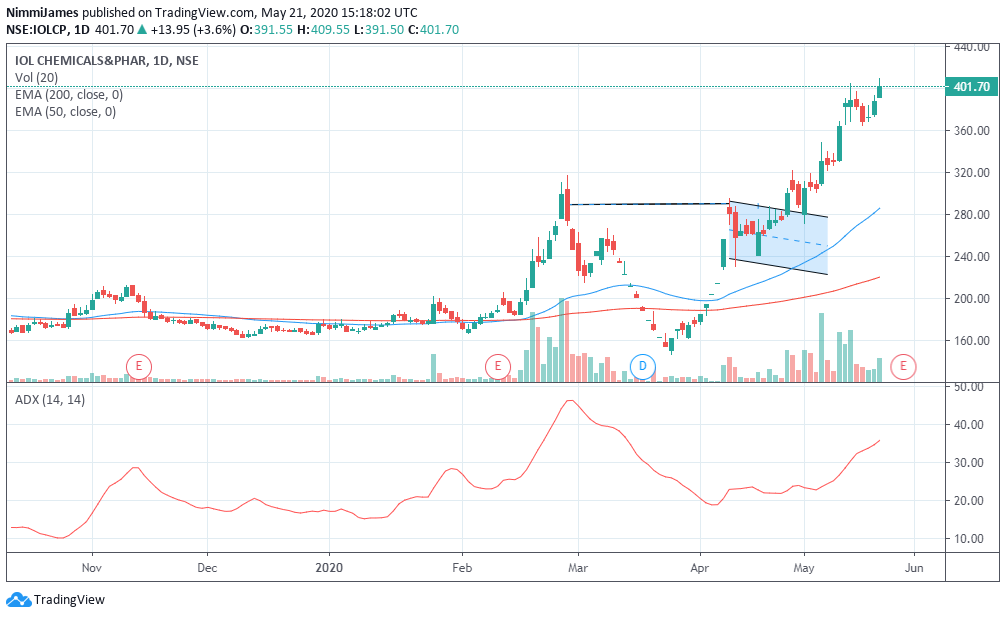
I am a newbie in Technical analysis, have noticed cup and handle patterns in IOLCP and Gmm Pfaudler .
IOL Chemicals and Pharma Ltd
The stock was going though a consolidation face in long term (weekly chart) and breakout happened with the cup and handle pattern.
Height of the cup =140.Target price will come near to 420.
Stop loss can be near to 270 (in case the pattern is not working).
Fundamentals Triggers:
Company has just started paying dividends and has reduced debt.
Good profit and sales growth.
Few of its products has increased demand due to coronas crisis.
Disclaimer : Not Invested ,but tracking
GMM Pfaudler ltd
Cup and handle formed during an uptrend.
Height of cup =1600
Target price will come near to 4800 to 5200 .
Stop loss if the pattern wont work out will be near to 3200.
Fundamental Triggers:
Order backlog increased.Not much effected due to lock down.
Finalized few large orders recently.
company is setting up another facility Hyderabad(after lock down), which will help to get better reach of its customers.
Disclaimer : Not Invested ,but tracking
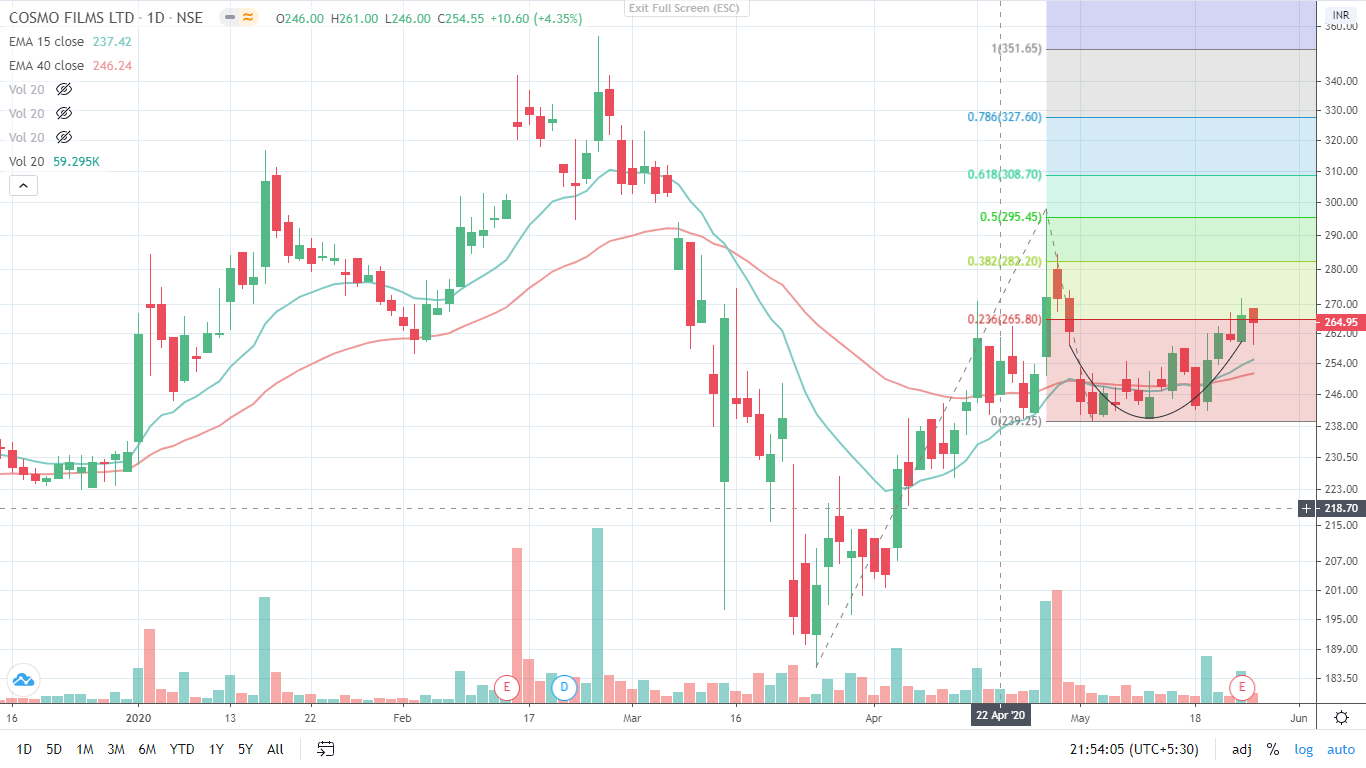
Cosmo films - rounding formation at the 50% level. expected move up to 350 levels. I have posted my views on cosmo in its thread. Though BOPP is a cyclical business, the cycle was improving before Covid with improving margins. There was no major capex addn planned for the next 2 years at least however post covid we are seeing improved capex ( for e.g Vacmet India launching both BOPP and BOPET lines in Indore) indicating more tailwinds to the demand scenario
Alembic pharma has been worked on extensively on VP with management meet notes, deep dive, stock story and the thread itself being well populated with learned opinions. Fundamentally it seems to be on the cusp of strong growth. Putting up a long term monthly chart with guppy multiple moving averages plotted. This type of chart tends to take out the whipsaws and provides a clear pattern if there is any. more comments on chart. disc: invested and added recently.
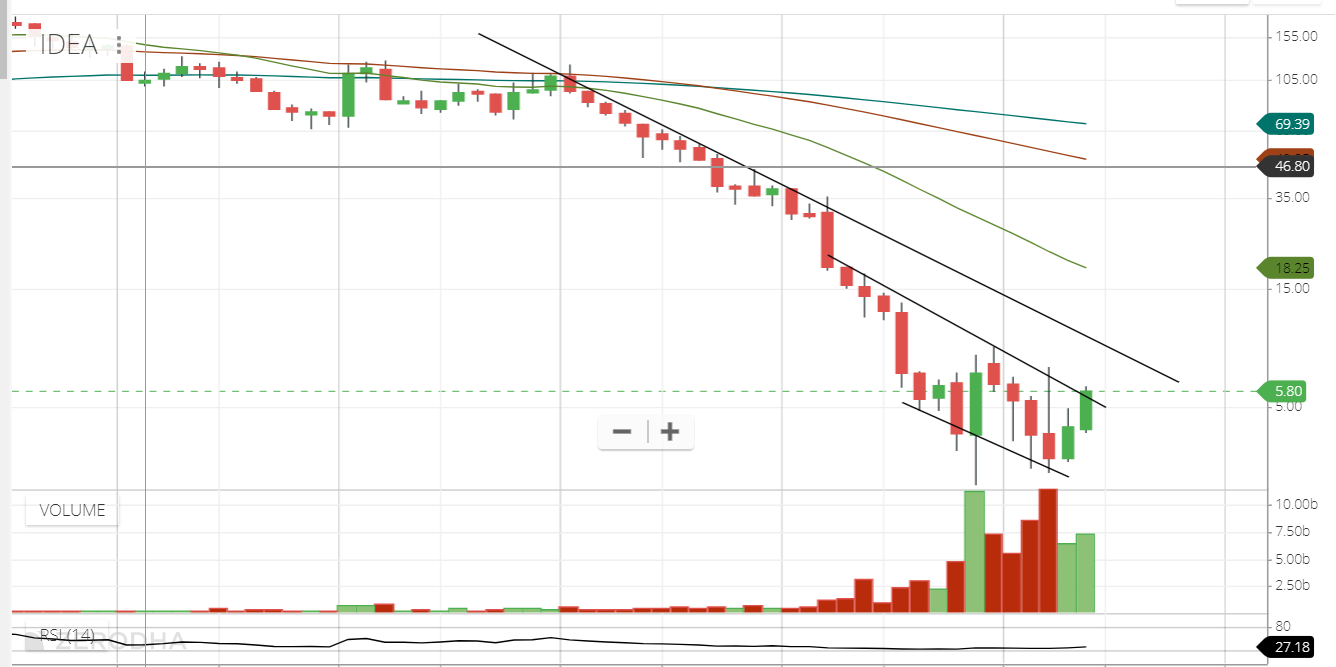
Vodafone Idea (Monthly) - Technically trading in the channel that I like to call the ‘Solvency channel’ About to break out of it. Fundamentally, 90k Cr debt and 10k Cr equity - EBITDA could be 15k Cr this FY - making it trade at about 6 times EV/EBITDA. Any incremental increase in EV will have disproportionate gains on the equity. First it has to remain solvent - Fund infusions from the parent, if it happens or from other parties, can ensure this. After this, its a matter of SC approving govt.'s request to allow for deferred payments. This will dramatically improve cash-flows in the near-term allow for thriving from a struggle for survival.
If I correctly read ur words then U’ve tried to mean (i.e- Above upper channel of downtrend line it’ll try to become solvent).Now we need to see the genuinity of the news of alphabet inc.(since Mr. K.M.Birla made statement of shut down option) which is the whole reason of this spike.
@Jiitt007 My thesis was purely fundamental when the EV was around 95k Cr or so (Around Rs.4/share levels). If someone was willing to buy the entire company, they get an EBITDA about 1/6th what they put in, in the first year. The reason why no one would do it is of course the AGR liabilities, regulatory risk, currency risk and poor laws (if the money comes from abroad that is). All these still remain and even the parent had very recently pretty much written off their equity in the company. So the main question was, can the company survive? If it does what will I make and if it doesn’t, what do I lose?
All this has to be seen from a game theory standpoint - It has been one bad news after another to Airtel and Idea in the last few years as they lost market share, battled with the AGR dues and struggled with servicing debt. In this situation, the parent doesn’t want to send good money after bad and that’s perfectly understandable. See this from the perspective of the govt. - Can they allow Voda to sink and make it a 2 player market? They clearly can’t and that’s why they agreed for deferred payments but SC put in a spanner in the works. At the same time, the price-war in the sector is over. Now none of the players are ready to play the price-war game and they are increasing prices like a cartel and it shows in the ARPU.
This considerably improves the odds of a survival as money coming in, has less headaches to deal with and that’s what is currently being priced in (before today’s rally). Now if the SC decision goes in favour, cash flows in the next few years will improve considerably, and then from surviving, it will be a matter of thriving. I bought because the risk of ruin was minimal (mostly in the price) and was curious to see if the thesis played out. I feel there are lot of things which can possibly work out and as the market sees this news incrementally, slowly EV will keep increasing along with the other two players. Here though a 10% increase in EV will double the Market cap (at least at the time of my initial thesis), so the risk:reward was tremendously favorable. We must also consider the cost of capital elsewhere in the world. Large tech companies have large capital without any avenues to invest and interest rates are negative or zero in most economies as a consequence. Odds of someone taking a bite in an opportunity like this is somewhat high.
These things don’t always work out and they especially will not work out if the regulatory risk is too high (as in this case) and the interest coverage ratio is abysmal. Here interest coverage ratio is improving and sector dynamics is getting buyoant and any incremental topline, flows directly to operating earnings (Interest monster still stays ahead of the bottomline) which makes the odds of survival relatively higher. Even now things can go down south if SC is adamant and is intent on killing the business (for what joy though?), but the valuation gulf between which way that decision goes is too wide and it will slowly get priced in, along with the sector dynamics.
As for the technicals, there is one which I see as price-war trendline and another which I see as solvency trendline. The one which it has broken today is what I consider the solvency trendline. If you follow shifts between these and the news that has come out in the past, you will see why that is. Sorry for the long-winded answer.