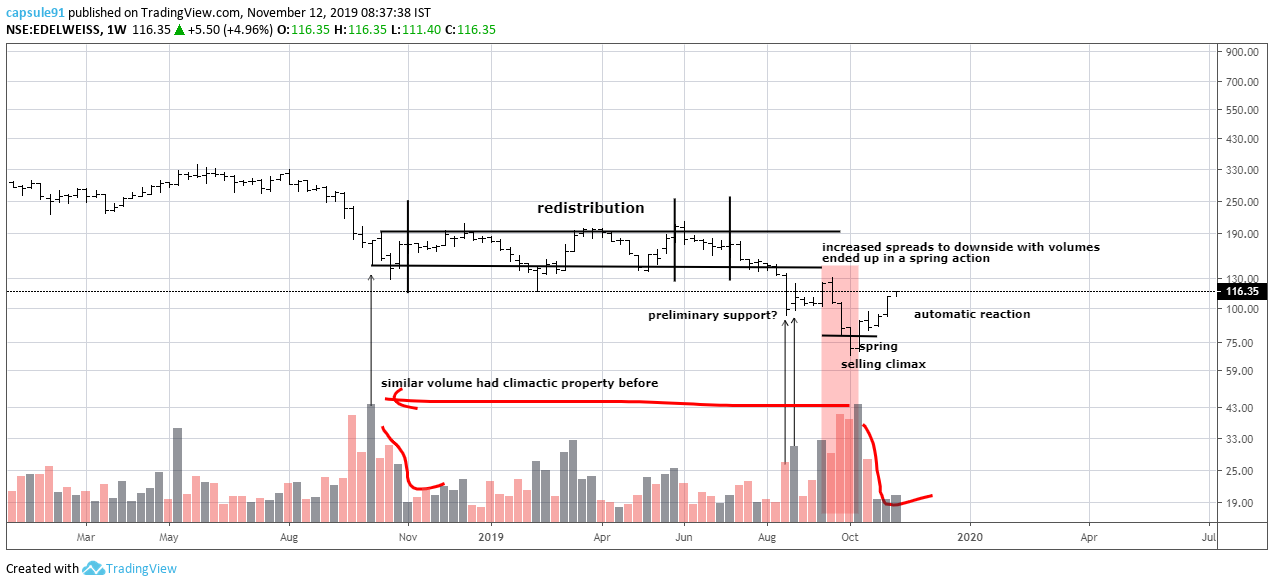
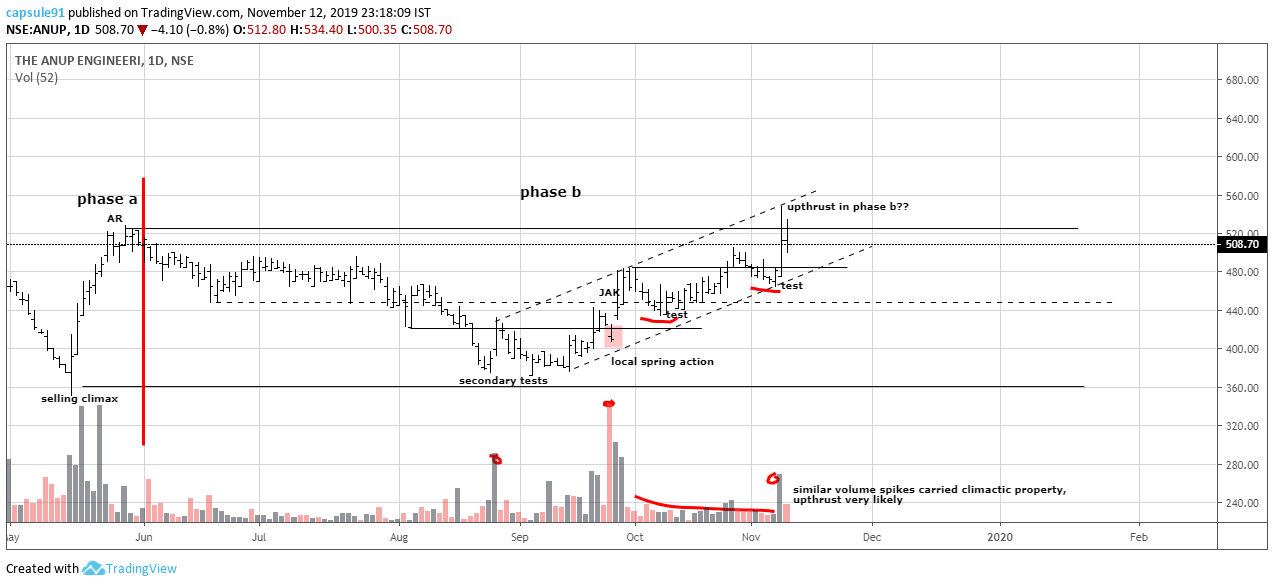
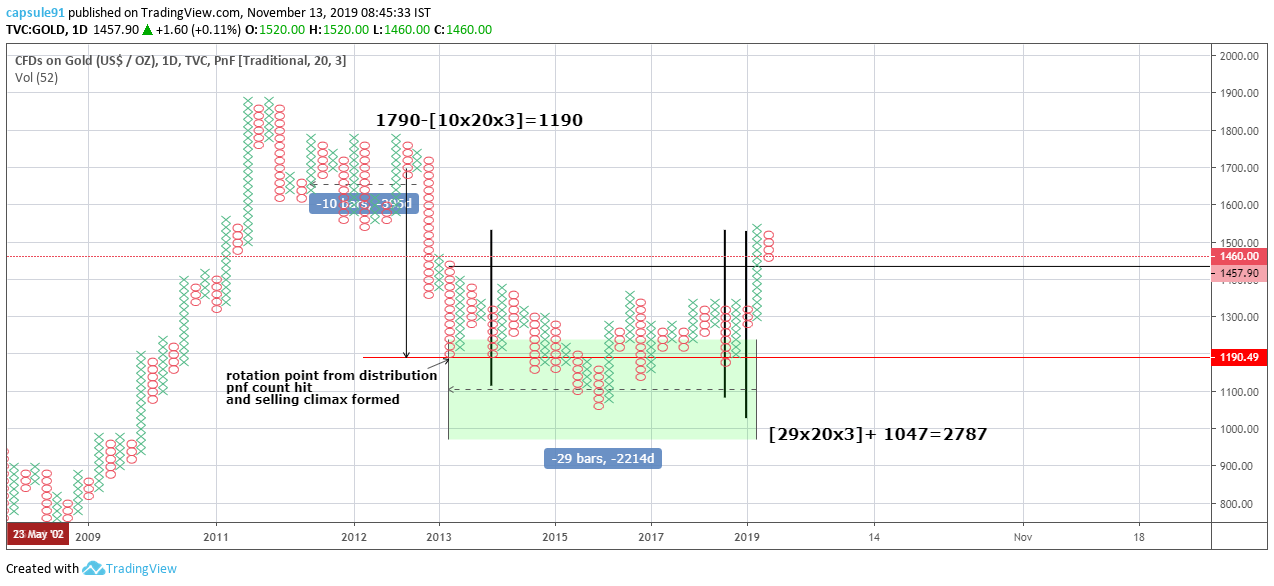
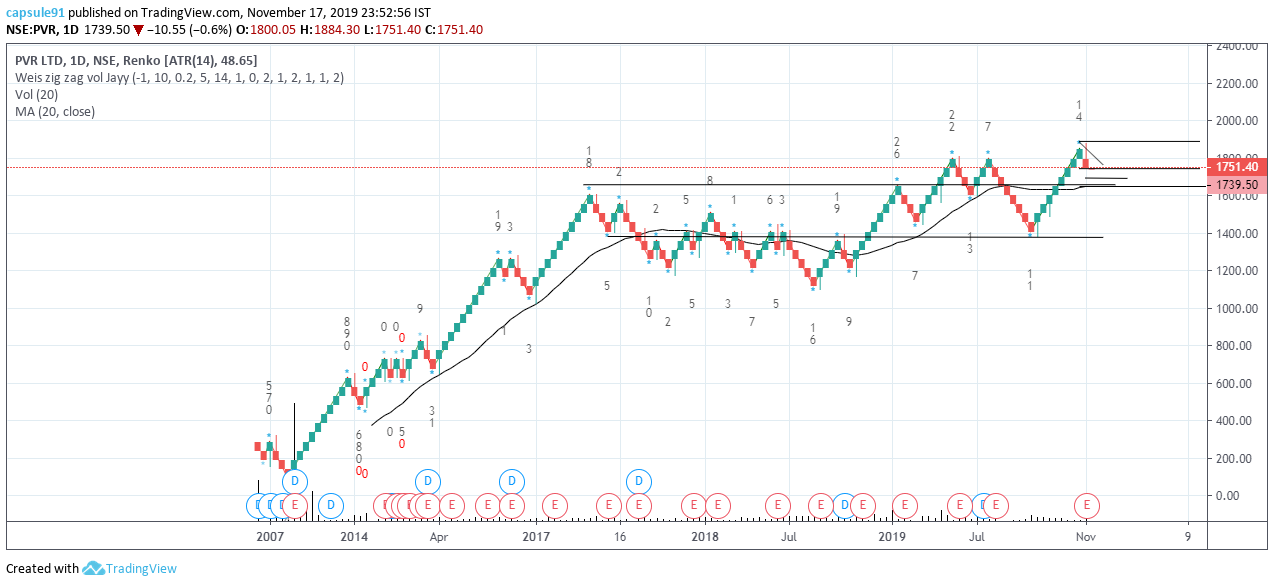
looking at the quality of the automatic reaction, after the climax, this scrip might be starting a base formation …
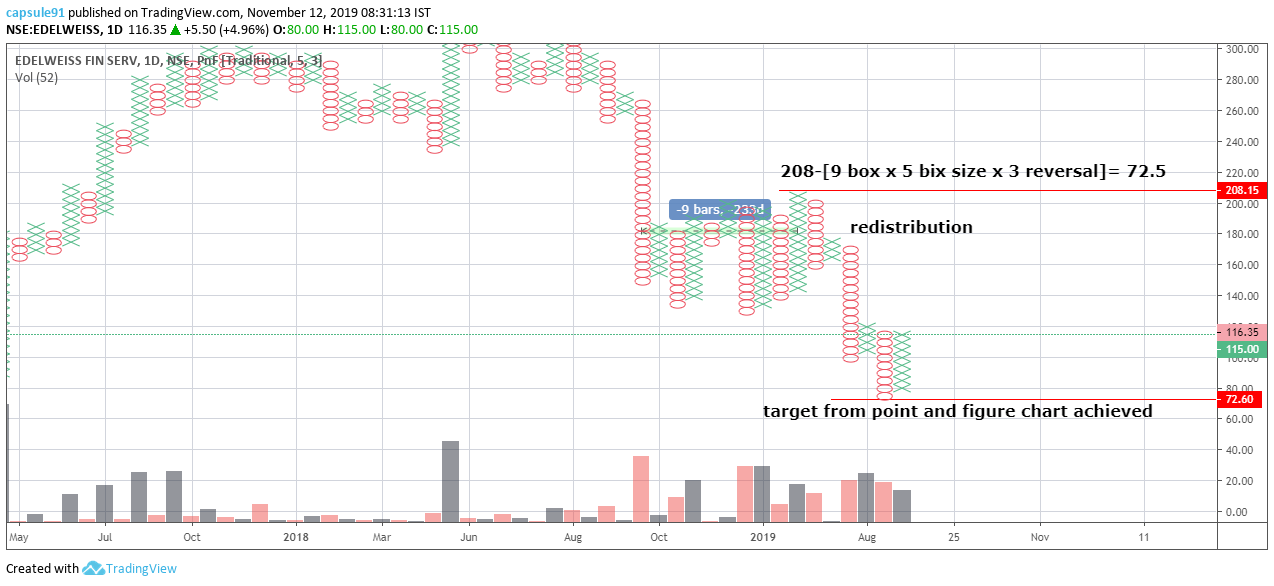
the point and figure targets from the last redistribution has been achieved…
rotation should occur
something should be very wrong here or this is a missvalued stock…
trades at 7pe ratio, 0.19 peg, 1.2 times its book value, market cap to fixed asset of sub 1 , market cap to total reserves in the BS is 2, ev/ebita 4.8
has a bit of debt though d/e ratio 1.28
total borrowings to opm= 2.47 [as of march 2019]
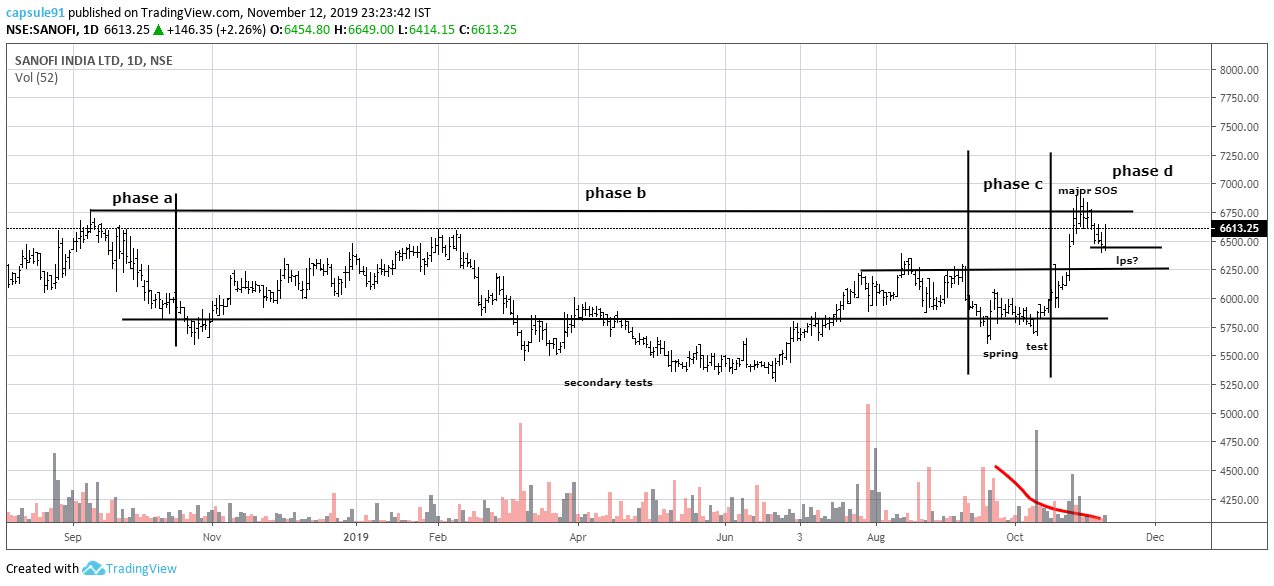
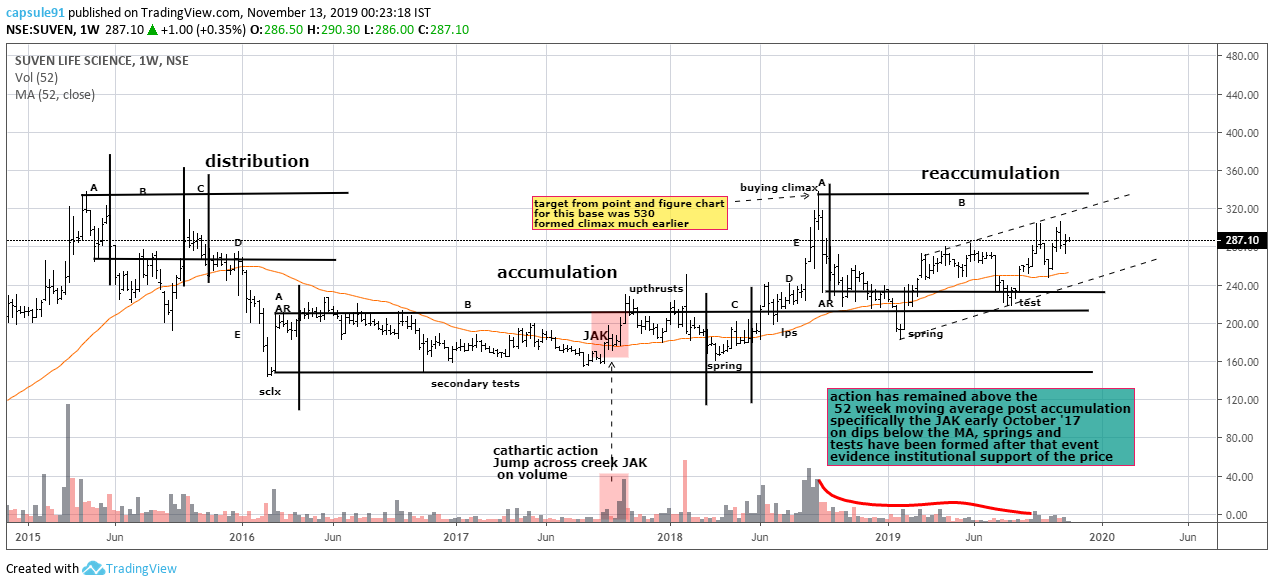
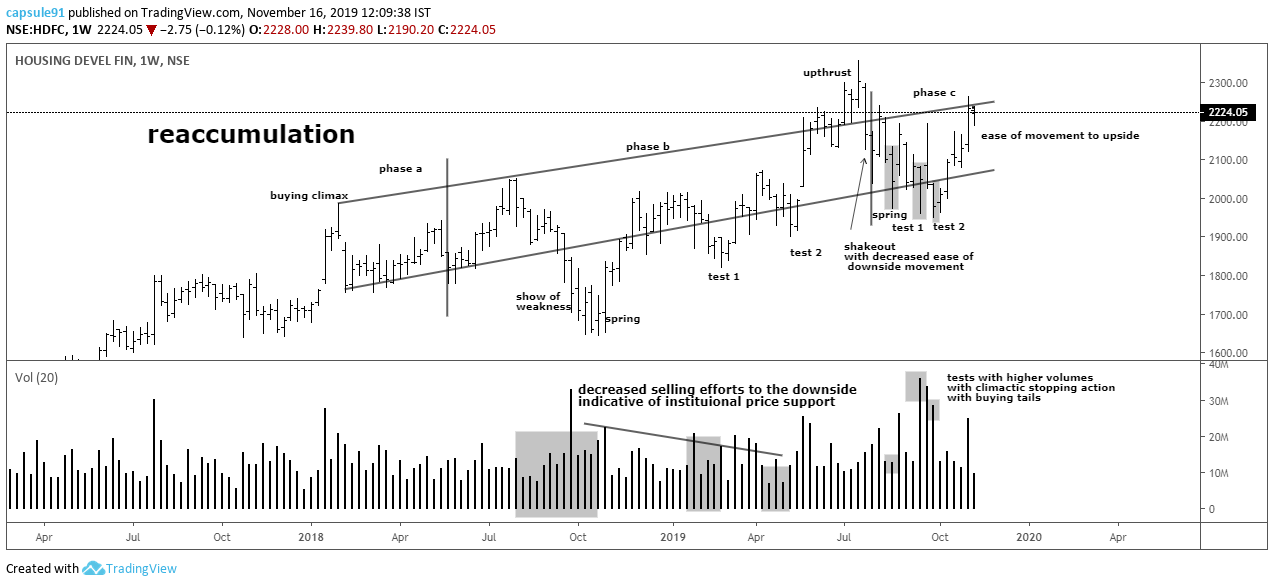
action in phase d
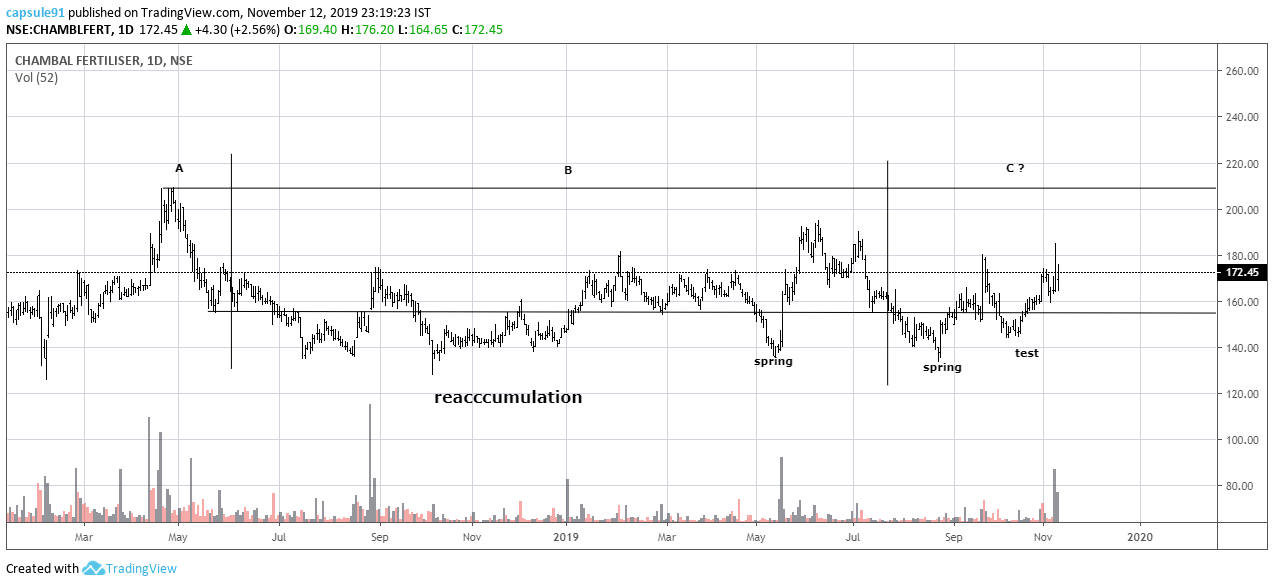
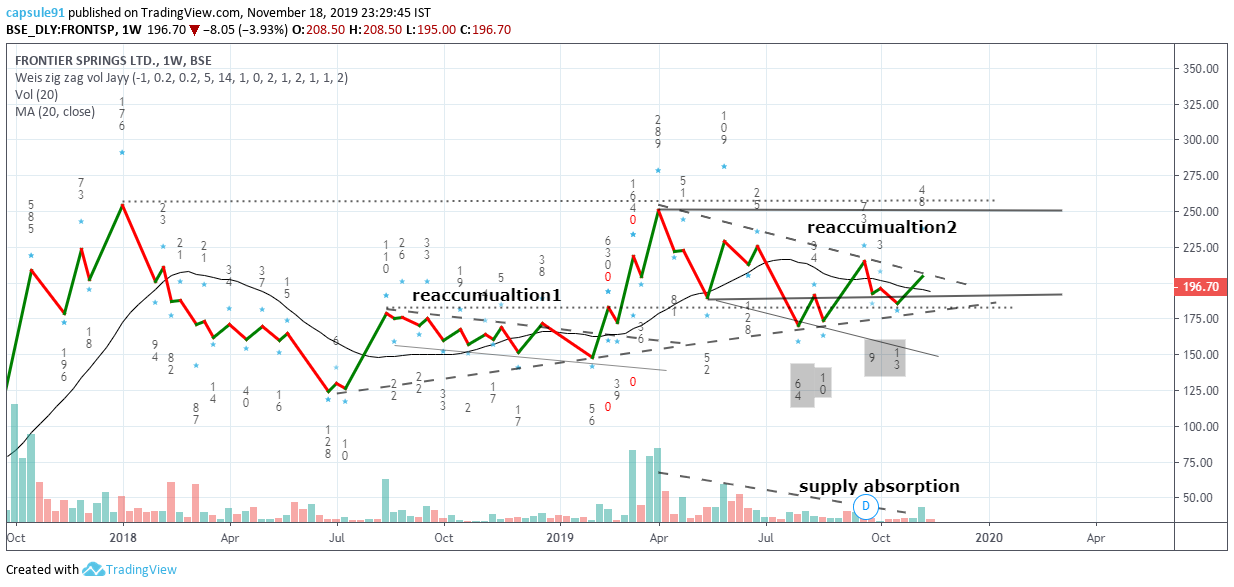
this is a classical example of stepping stone reaccumualtion
still maintains the trend channel, the buying climax for the current reaccumulation was formed on trow over out of the supply line
suven seems to be going for a stepping stone reaccumulation…
last year, i was the last seller at the high, 337.8…! one of my few good exits, gann square if can be properly analysed is a black magic, insanely accurate… question is, if properly analysed, its too complex a system and very easy to mess up…
Thanks for the above. Re gold investment, curious to understand how did you invest? ETFs such goldbees? Can you please mention the instrument you hold. Also, if it not too much to ask, would it make sense to buy into your instrument for someone who has not invested so far according to the charts? Please let’s know your opinion. Thanks.!
Better to buy sovereign gold bond of RBI. If u want to buy for long term say 4/5 years buy any series of 2018 where u get discount to market price of gold.
If u want to move in and out from it fast then buy 2016/ 2017 series with less discount but good liquidity and price moving tandem with actual gold price.
Thanks for the info. How do we buy this. Can we buy via our sharebroker such as sharekhan or buy via HDFC securities app? Would you mind sharing a link please? Please guide
They are listed in bse and nse . U can buy and sell same way as you trade in equity.
Check nse website and bse . In bse debt segment u will get bse script code eg script code of one series is 800253.
About hdfc I don’t know they allow buying and selling in gold bond in secondary market as naturally they loose brokerage commision which is more when u apply thru them directly then buy from secondary market. Other reason may be it requires more knowledge to trade in debt market which their call centre guys lacks .
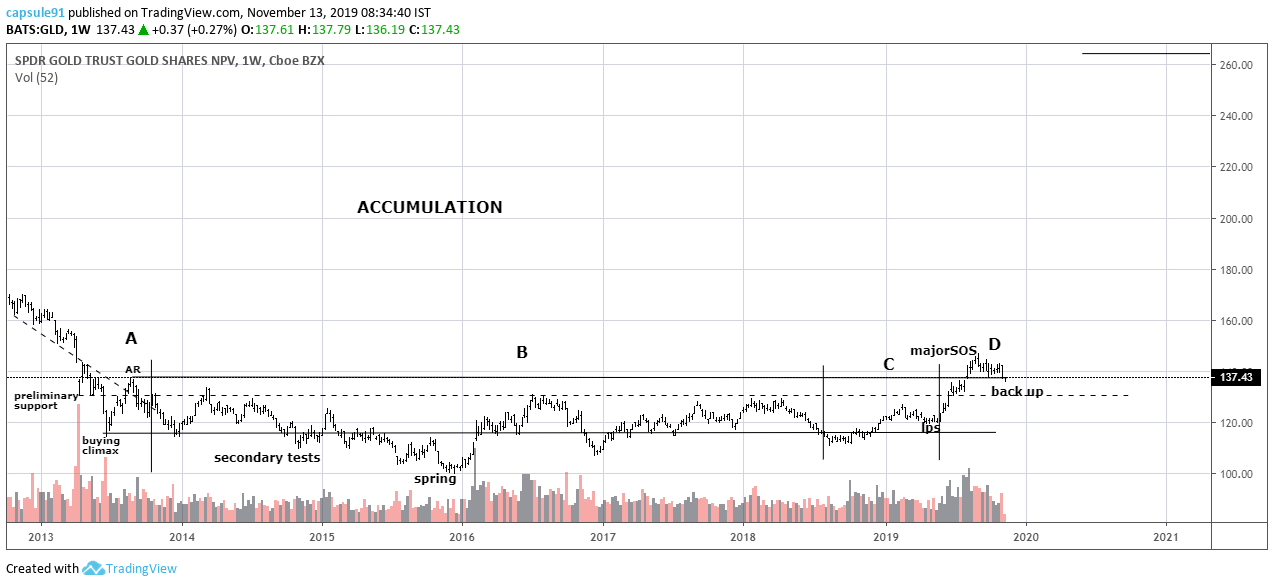
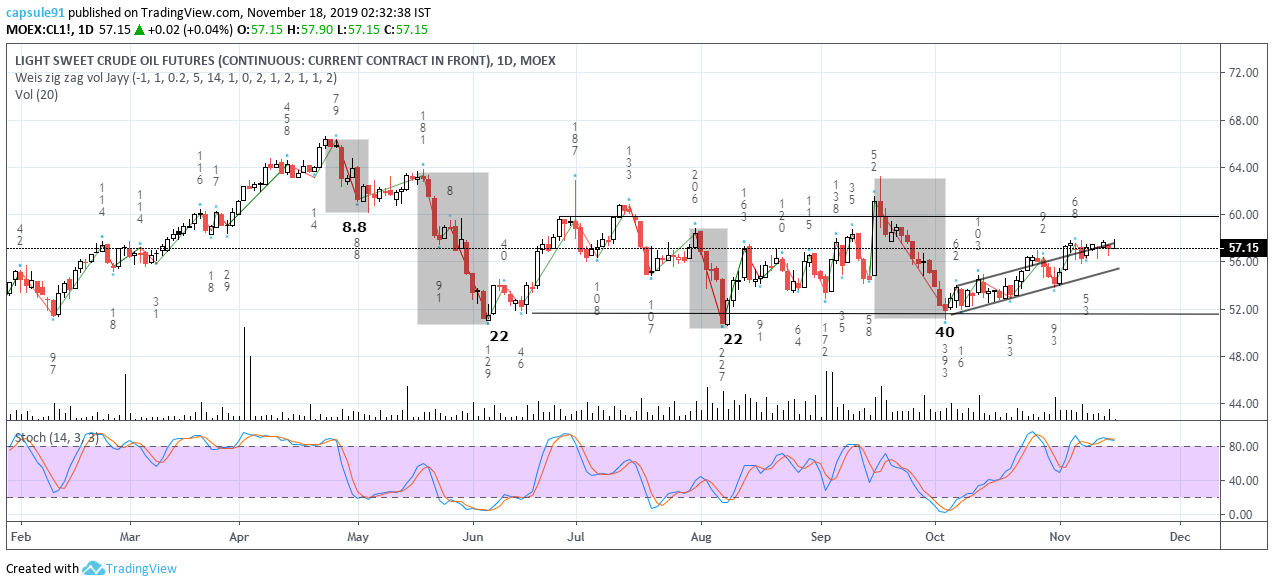
8.8k-22k-22k-40k contracts transactions…
the last downswing was on massive 40k volume, but failed to make a new low…
this is classical “bagholding” that is going on, some one is absorbing all of the supplies without letting the price fall down…
i am talking about the paper market…
this is accumulation in phase b…
margin pressures to come back in a lot of oil derivatives , since most likely prices will make a higher high once this trading range is done with
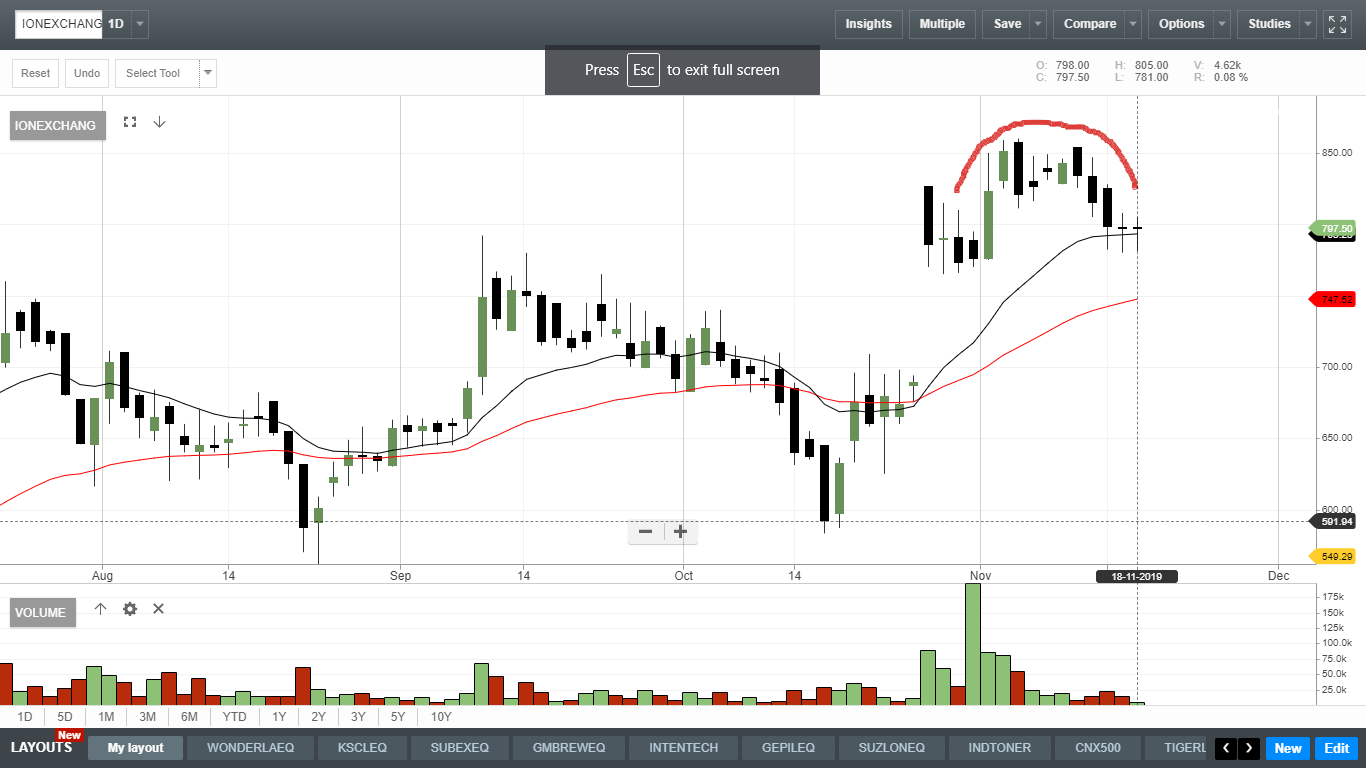
A rounding pattern seen on ion exchange. Rounding patterns at the peak could be a signal for a potential top. The volume also increased significantly just before the rounding top began and seems to be the inverse of the pattern - another signal for a weakness. If prices trade below the 792 support, it would be further confirmation of an impending fall. There is also a price gap that could be filled. In my view a very weak chart if prices close below 792.
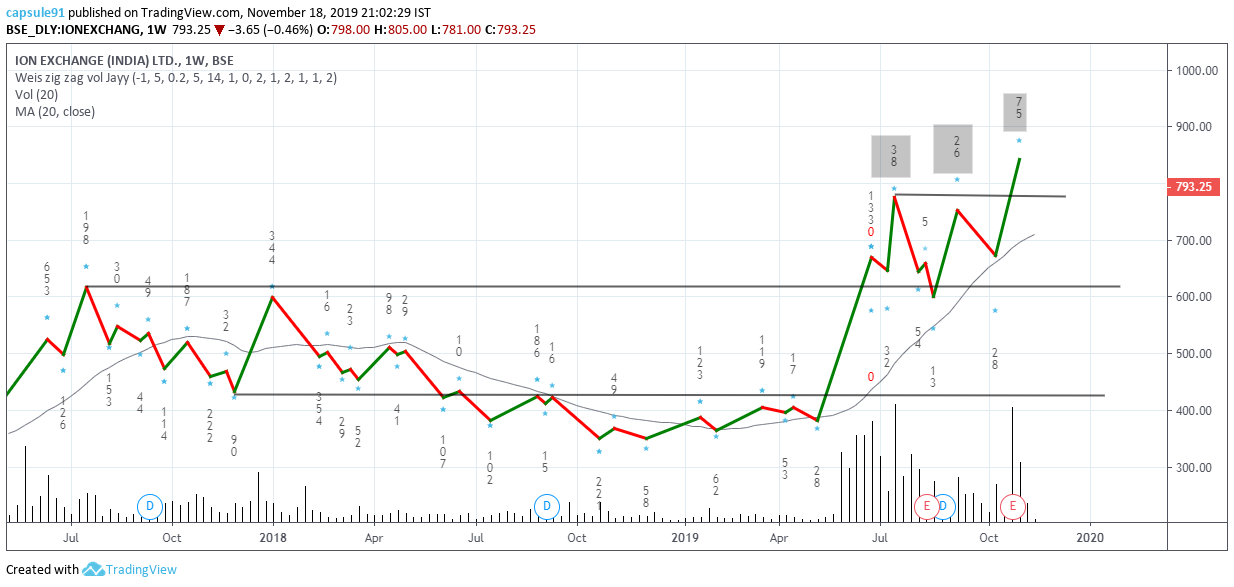
the numbers mentioned are in multiples of 10000 share transactions…
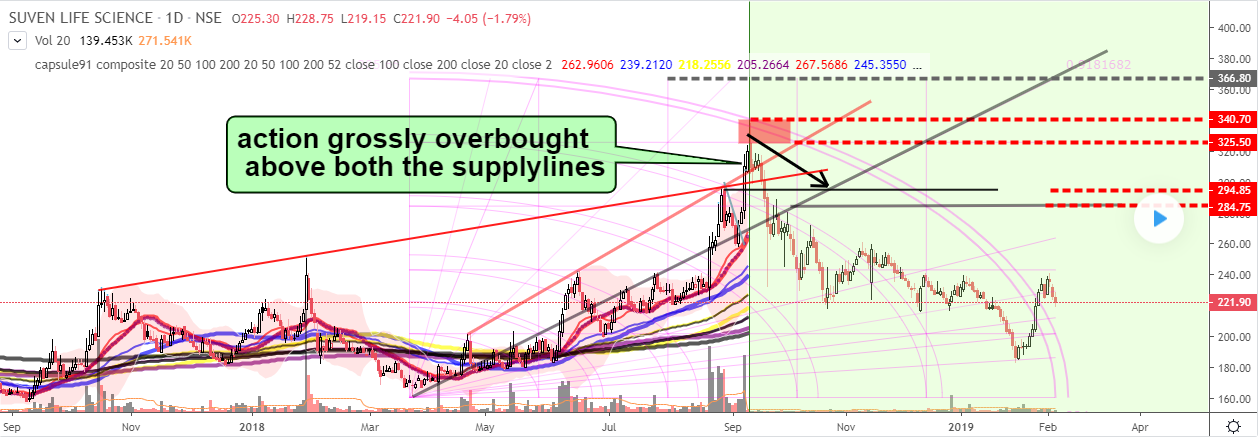
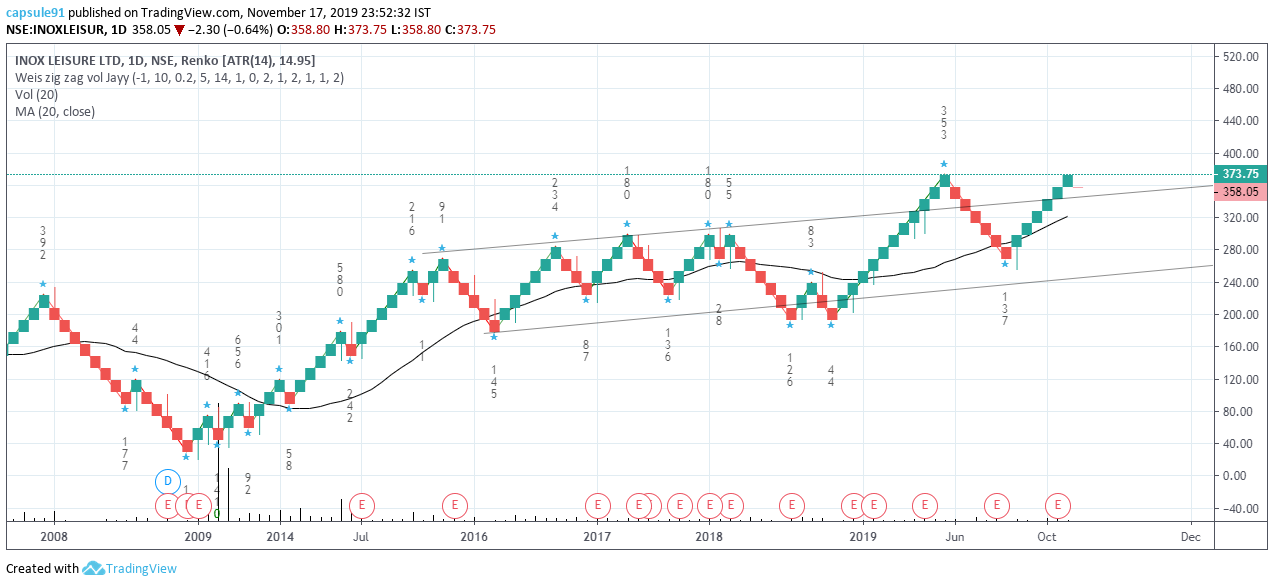
considering the 3 upswings…
first one happened on 380k share transactions, second one on 260k trasactions and the current one on whopping 750k share trasactions…
now what is the result of such a high effort [volume] in the price action?, it barely crossed the high, and is already reversing…
this is a classical case of effort vs result miss match
the price has lost institutional support, and some one is definitely selling …
to me this looks like an upthrust…
a test of 20weekly moving average is very likely…
but looking at the bigger picture, as long as the price holds 600, the structure is definitely positive…
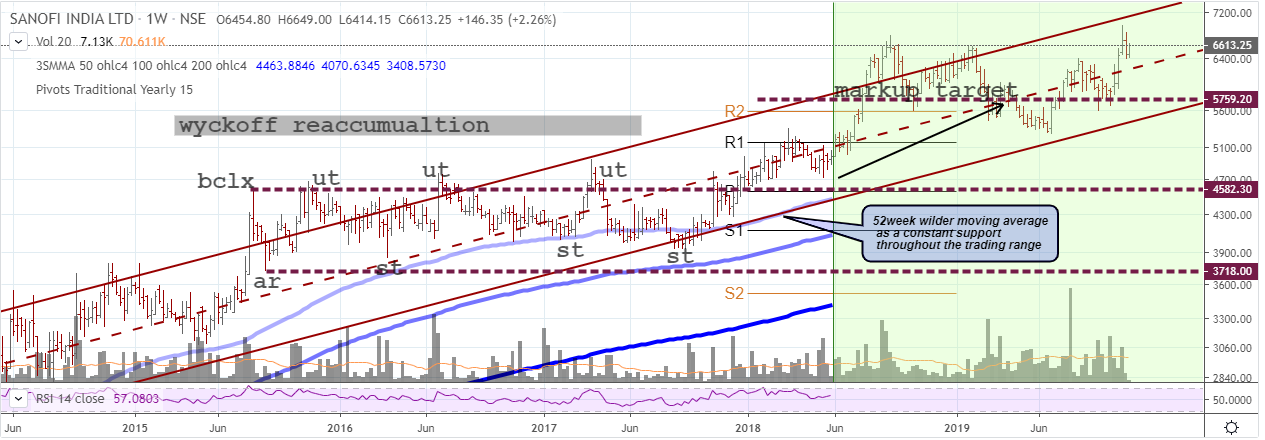
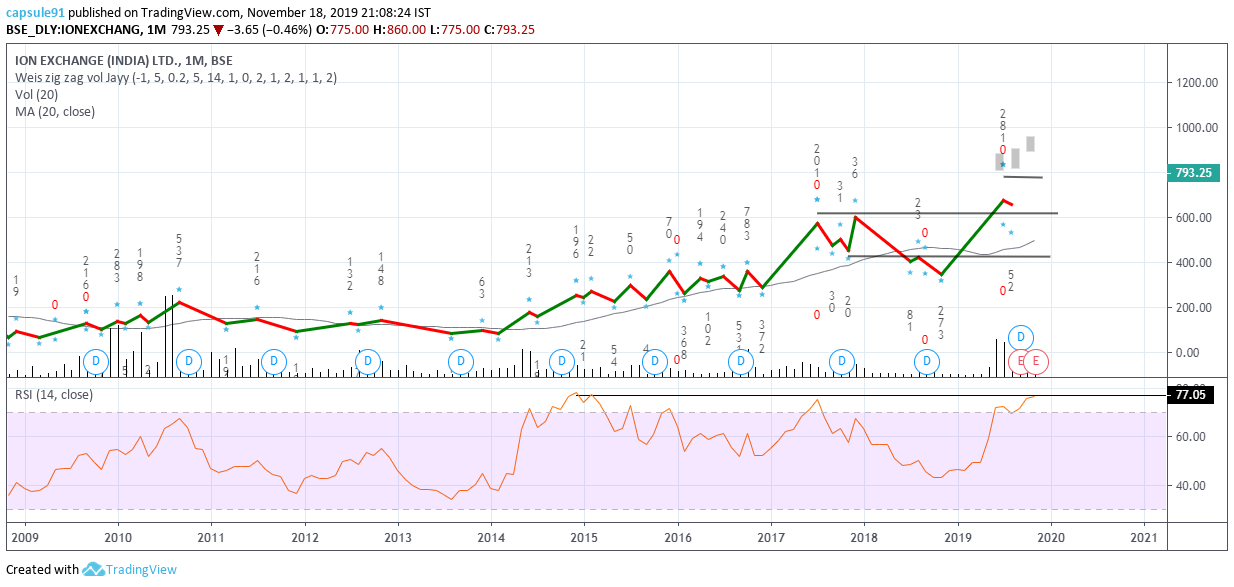
in the monthly the rsi, is at the historic high of 77
while, it might remain so for a long time, but inspite of promising fundamentals, i find this scrip has poor risk to reward technically, at this present price point…