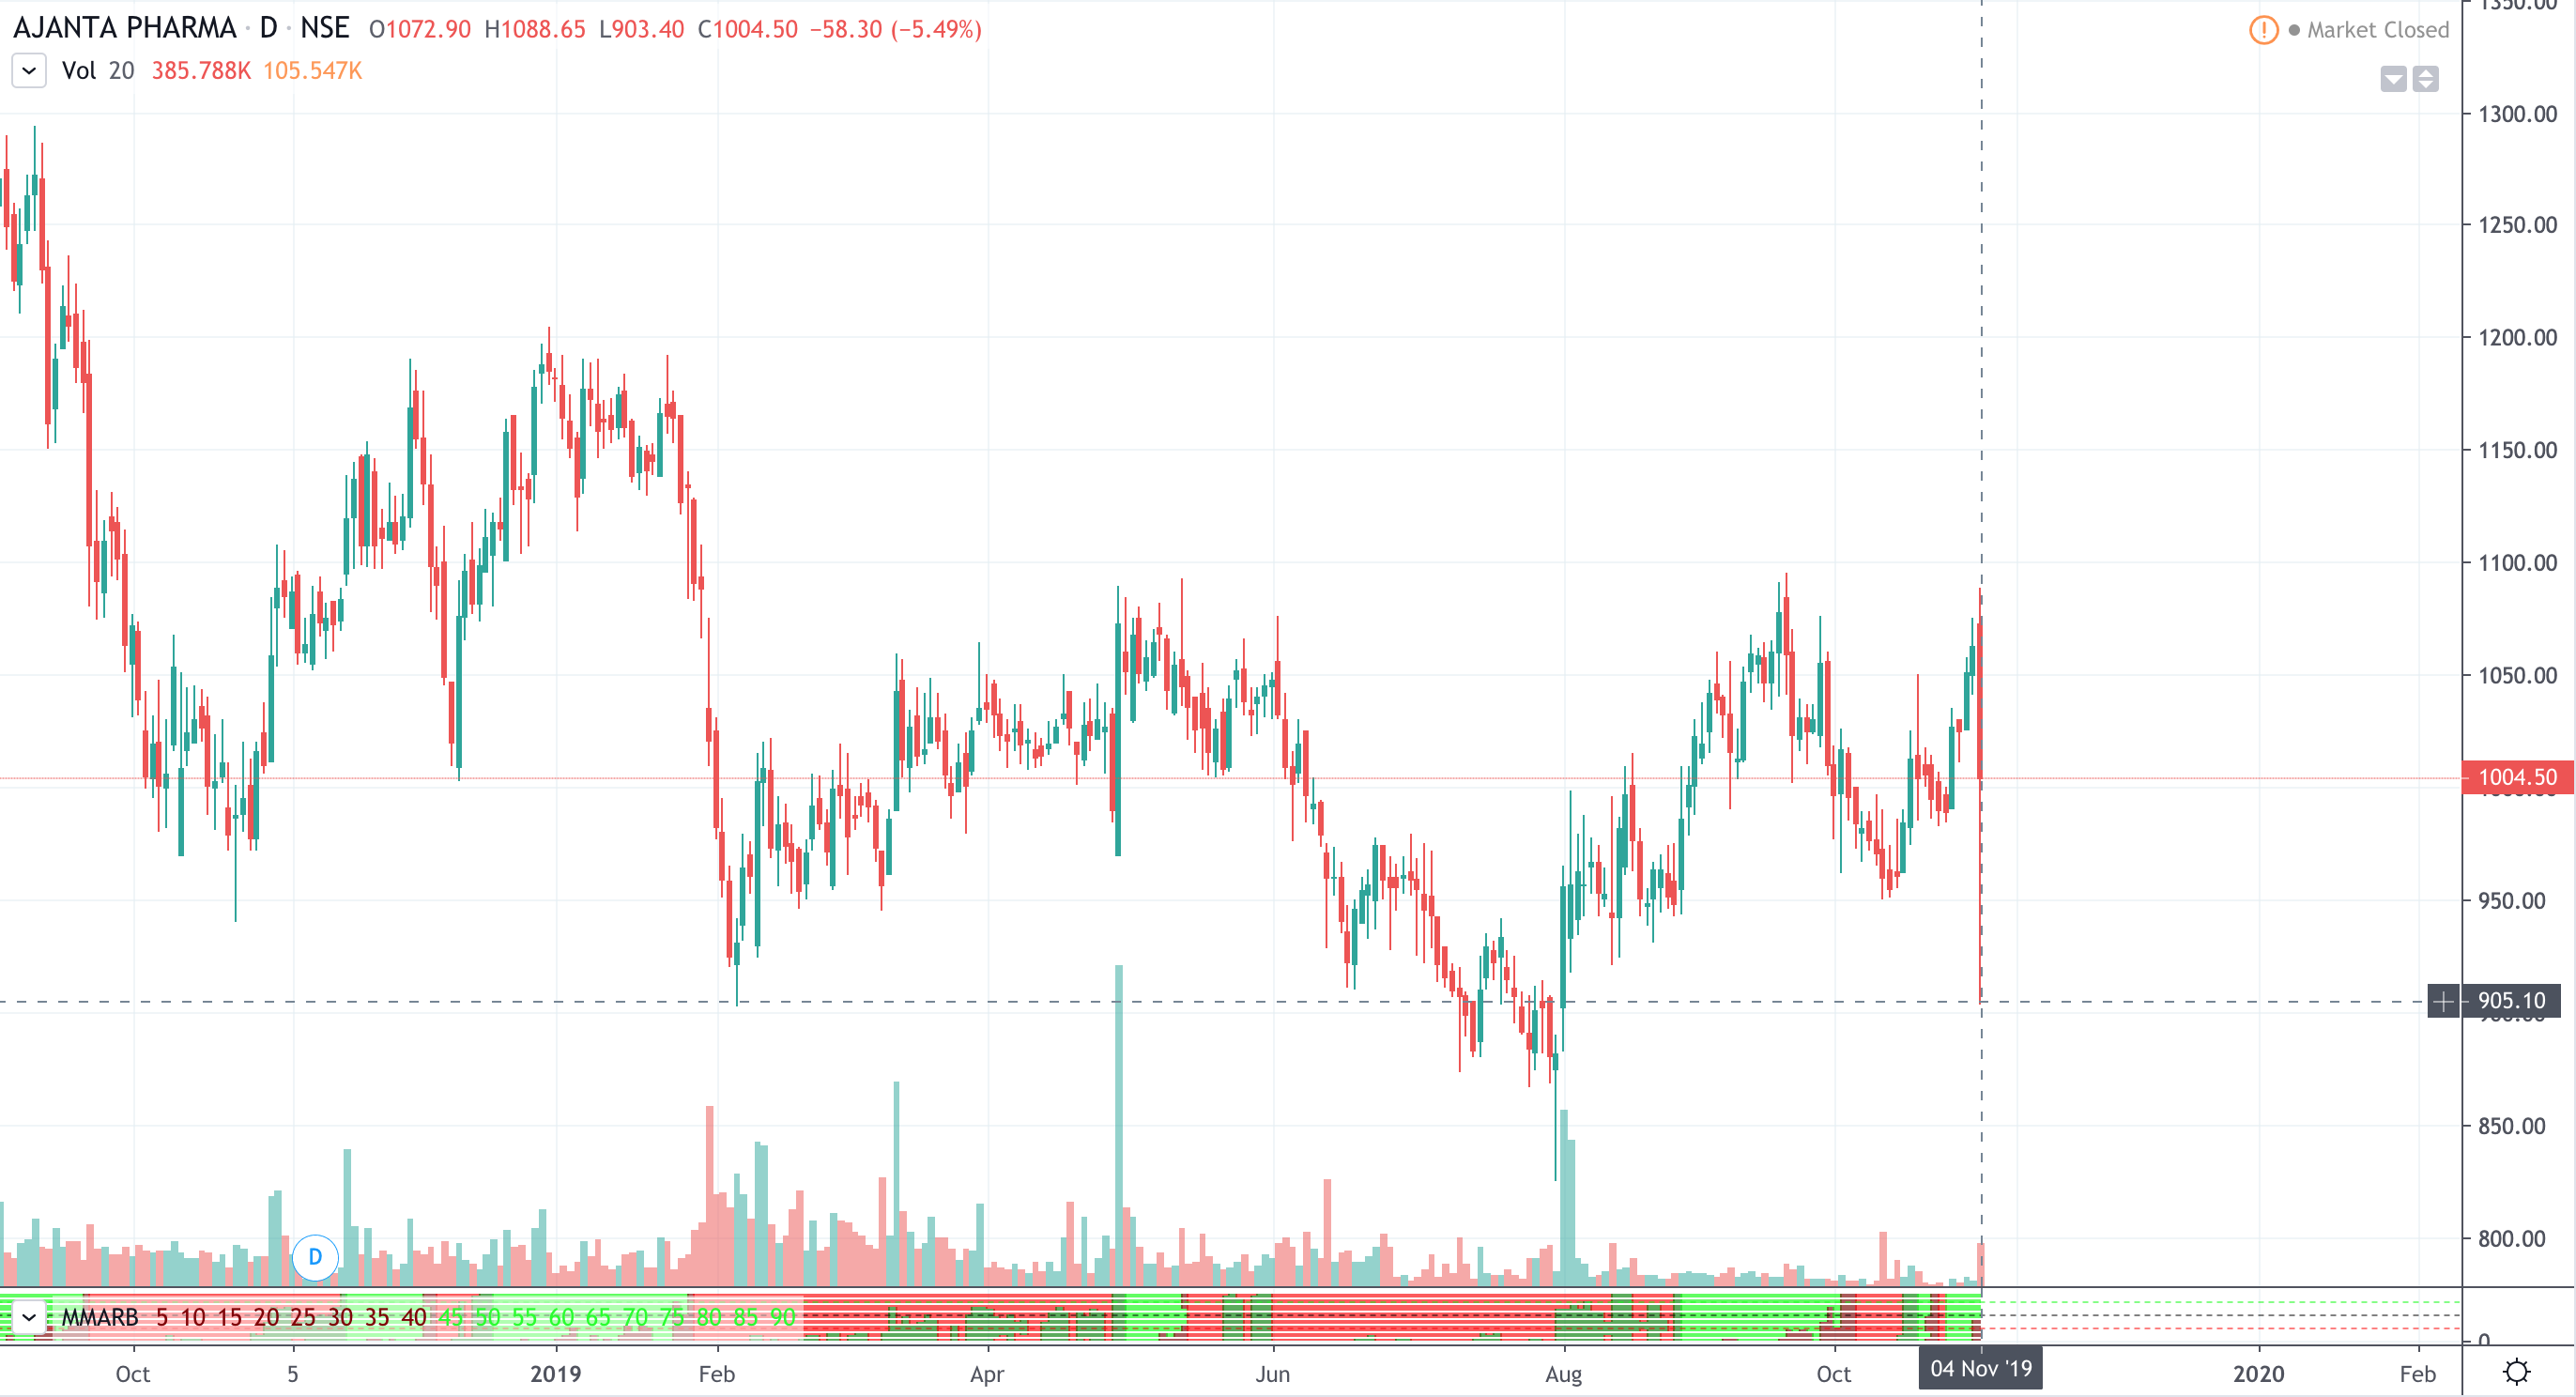
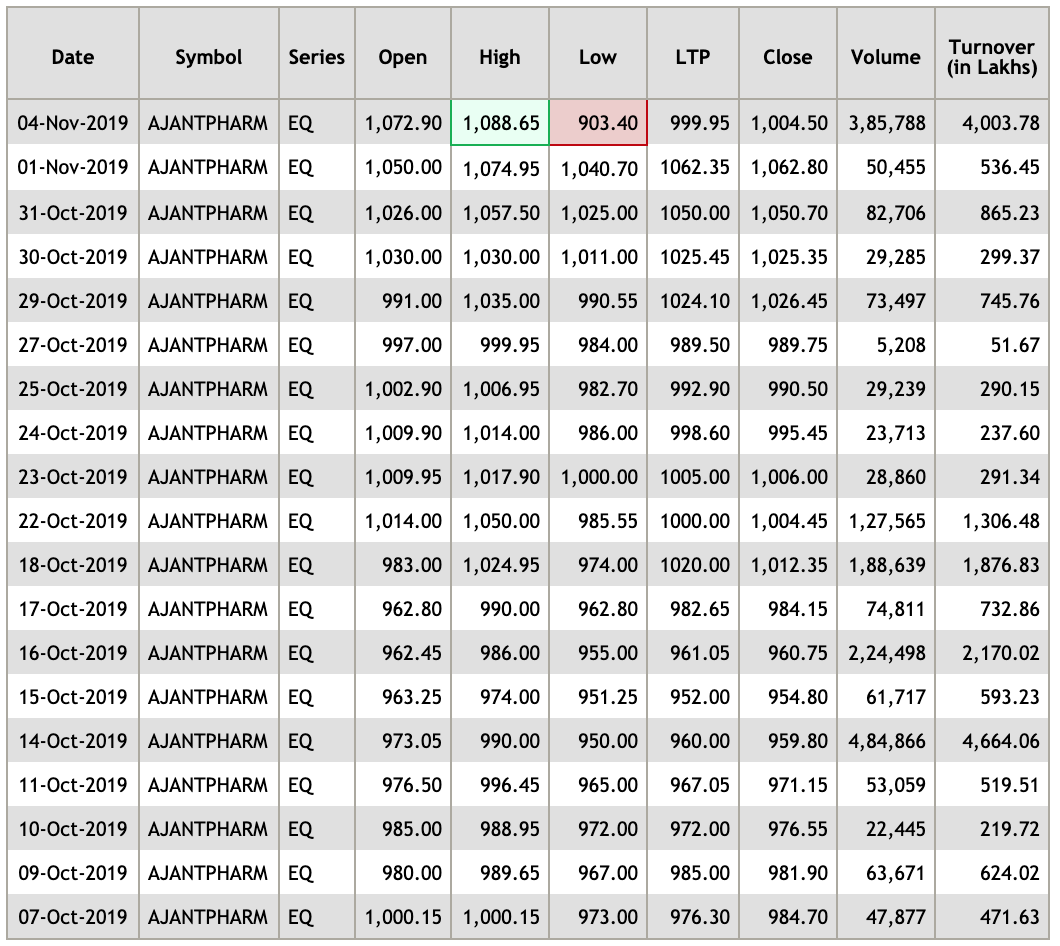
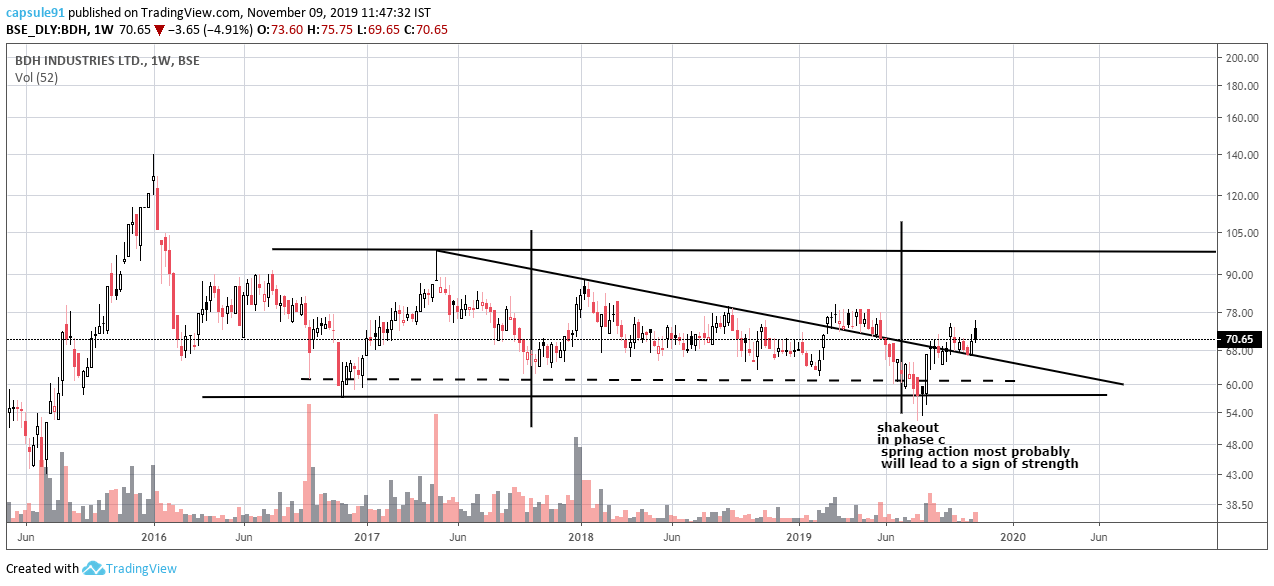
AJANTA PHARMA…
looks like accumulation is almost complete, to enter into phase d with a good lift off to show major Sign of Strength

disclaimer… no positions yet
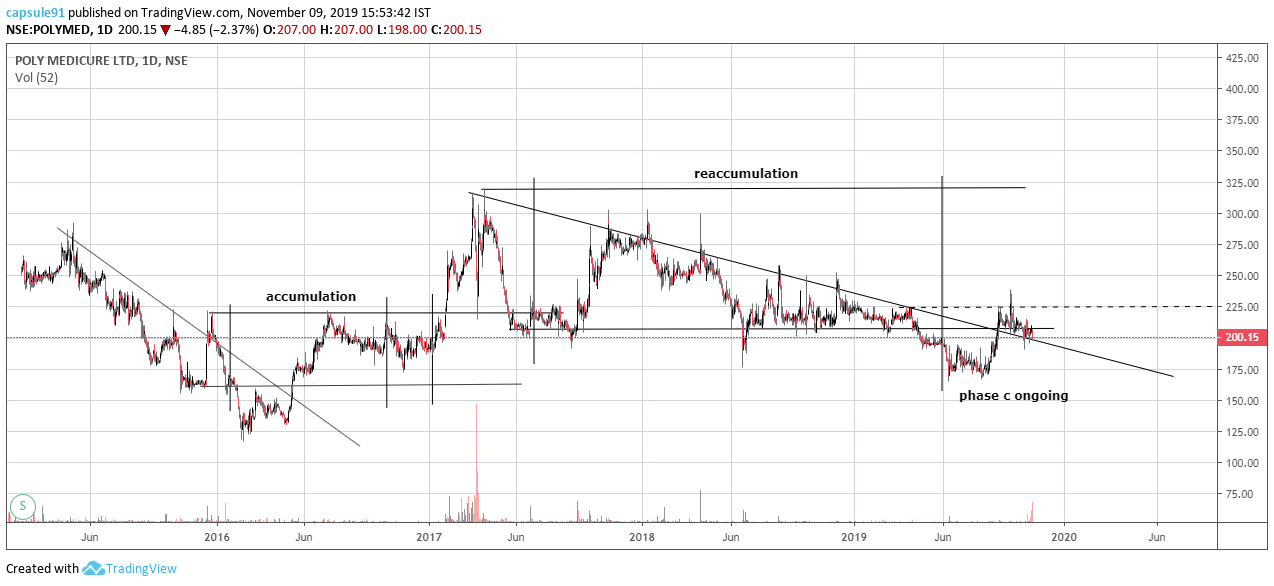
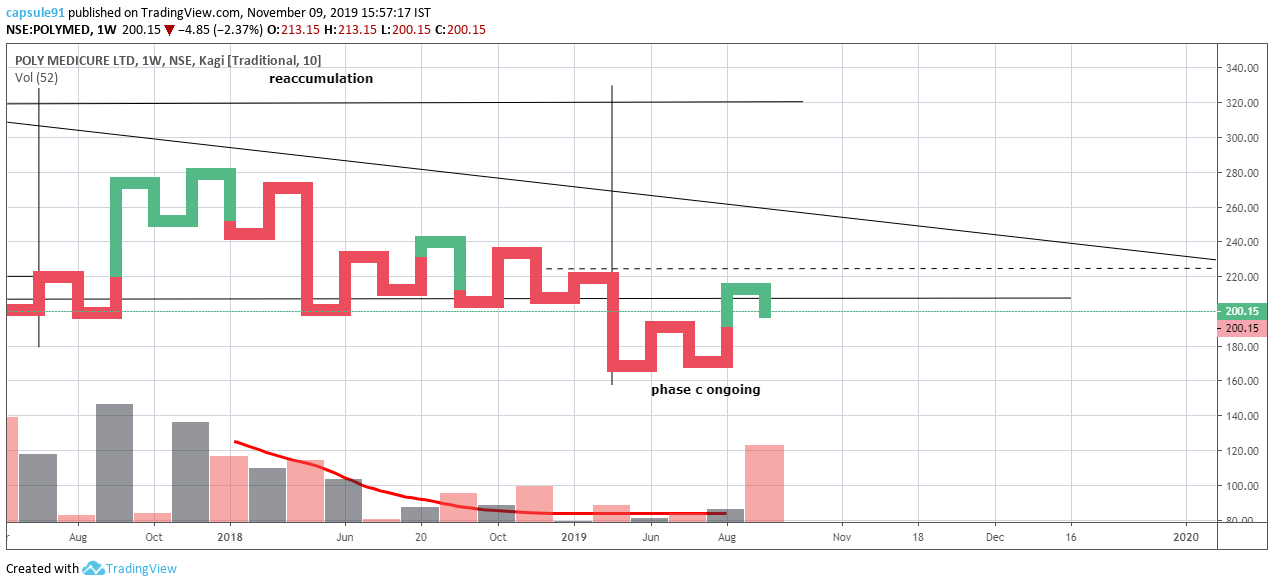
AJANTA PHARMA…
looks like accumulation is almost complete, to enter into phase d with a good lift off to show major Sign of Strength
disclaimer… no positions yet
while going through detailed comparison between gold and the stock market in the past 2 decades, what struct me was gold if starts getting accumulated will continue to markup in price irrespective of it being a hedge instrument or whether the alternate asset to the stock market when the later is at its peak or at the bottom…
investing in gold during the 2000 top of the market would have been greatly rewarding, because gold was getting accumulated by the institutions…
on the other hand, after that accumulation, gold prices started trending and went into its own peak where the strong hands decided to distribute , and that was during 2007, investing in gold during that period would have been a drag on once portfolio…
As of now if gold can be a serious consideration as an asset to invest in just as a form of hedge , its more because gold has finished accumulation and is the rise, and in this setup any impending stock market crash will accelerate the gold price uptrend and not mimic a 2007, where gold also depreciated along with the stock markets…
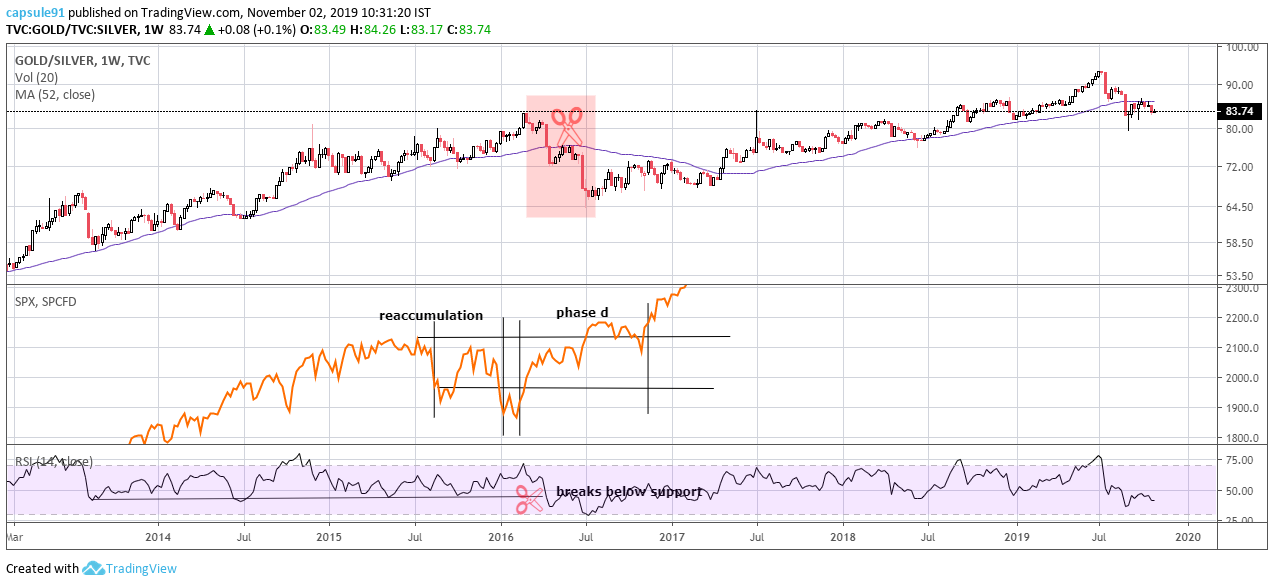
but the more interesting thing that i found was the gold silver ratio and its correlation with the stock market cycles…
it seems , precious metals are hedge instruments no doubt, but if fiat was not there and our currency was the precious metals, silver when in more demand than gold and when that demand is highest would indicate a stock market bottom… a highly sensitive and specific statement in last 2 decades
the viceversa also holds true, but but that statement has higher specificity than sensitivity, so is not a ideal way for screening purposes using price charts…
after we all love to hear about market bottoms, people predict market tops by the passing minute…![]()
and by a “bottom” i mean areas of accumulation and reaccumulation…
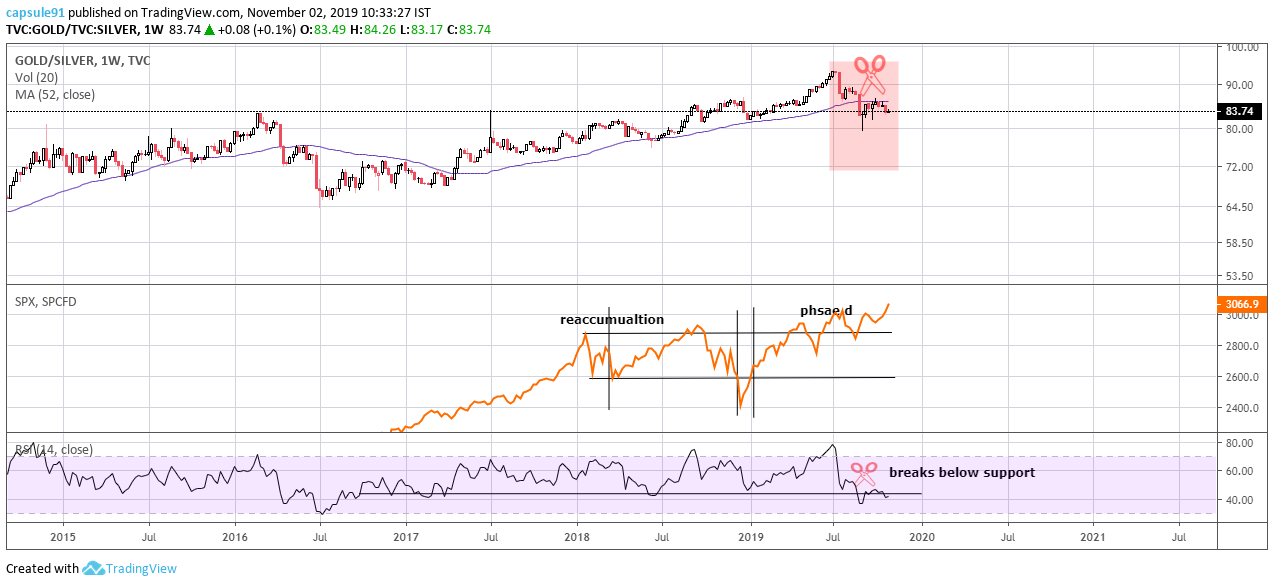
the chart is self depicting , that absolute peaks in the gold/silver ratio correlates with the trading ranges the market went after a protracted fall and a rally…
in smaller time frames this chart holds good,of course with variations…
using the relative strength indicator on the gold silver ratio, its also evident that overbought conditions correlate well with peaks of the ratio and the market trend pauses…
it is also a good indicator when the market is about to rally from that trading range, is when the ratio falls below the 1year moving average and starts resisting from it…
i have never heard anyone use gold silver ratio to apply in stock chart, may be i am ignorant, anyways, this can be used as an accessory tool in the box, kind of an indicator…
anyone interested, please back test in different time frames, and post results…
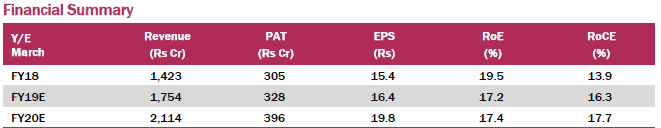
apl apollo tubes…
this name has been doing rounds a lot among friends and enthusiasts, and financial numbers are showing good growth , better profitability guidance by the management over next 2 financial years, taurus acquisition, last year’s tricoat acquisition, the fundamentals have a lot to price in…
the price action became over sold in late 2018 forming the buying climax…
followed by a phase b upthrust action, and the price came back to test the 52weekly ma…
so far so good…
the upthrust action started with a spring at the support and the spring retest generated good volumes, indicating capitulation of weak hands form the post spring rally, but the volumes remain lower compared to the buying climax or the downtrend preceeding, and the price not making a lower low as of now and apparently taking support from the 52 weekly ma…
the little issue i have with this trading range is, generally spring tests end up with excellent buying from the institutions, but here the price action dosent indicate that, although the general volume is increasing over past 6 weeks …
maybe its a build up to the earnings and the action might reflect after that…
over all a bullish structure, but not interested till some institutional buying comes up in the chart
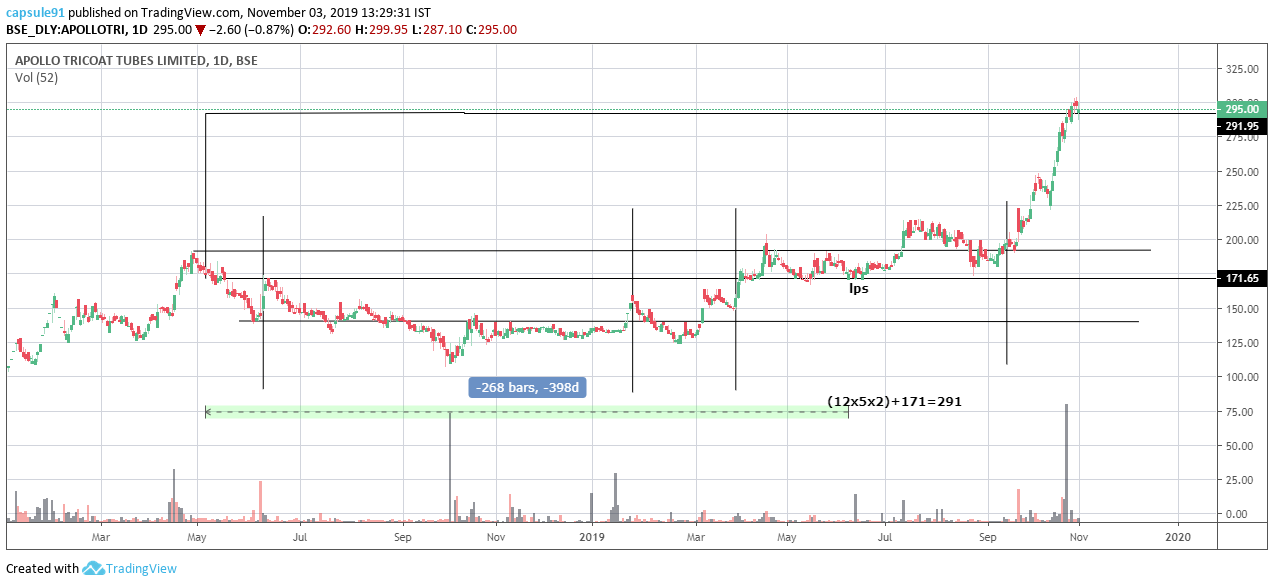
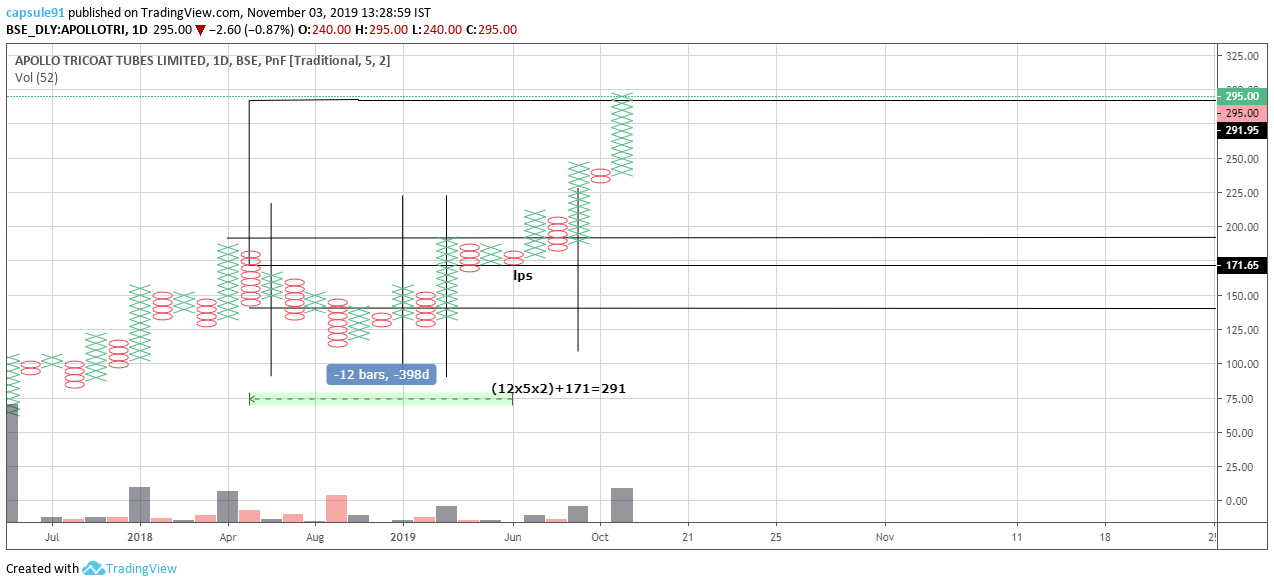
as a foot note, its sub, tricoat had a excellent reaccumulation structure in the daily…
textbook, least to say… good for a case study
and interesting fact is, point and figure counts went to 291 from lps…
exactly a price where climactic volumes started showing up…
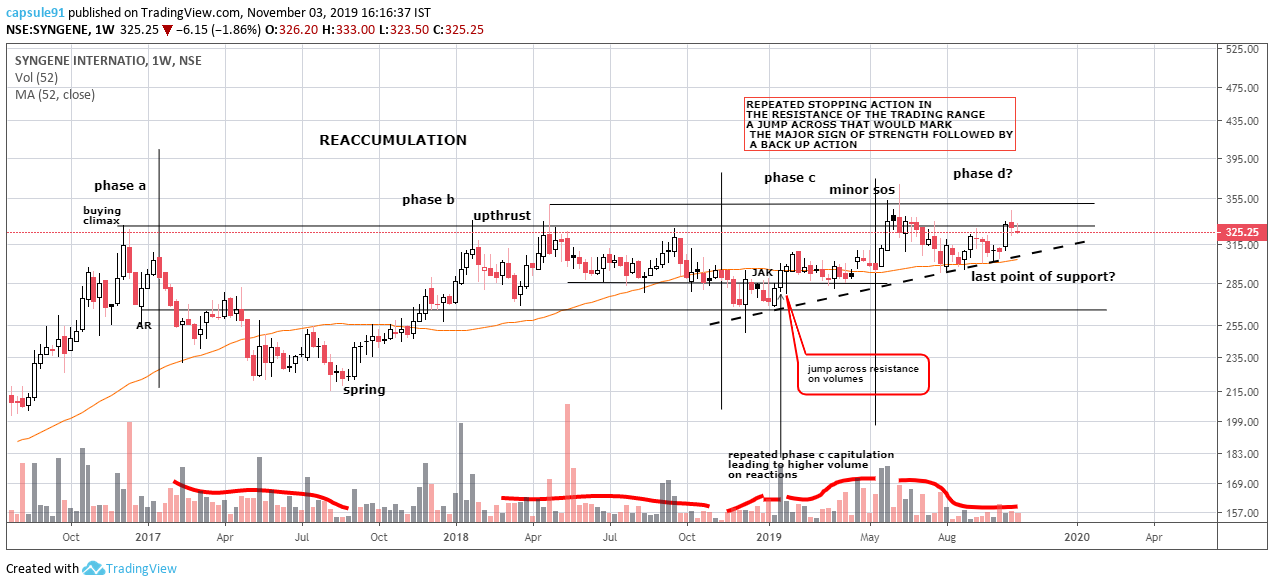
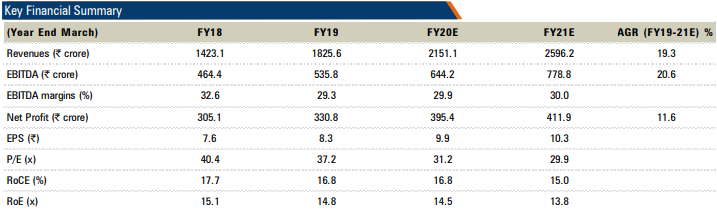
syngene…
reaccumulation almost complete…
but yet, multiple upthrust stopping across 350, that should be overcome and retested…
street numbers…
disclaimer…no positions yet, not an investing/trading recommendation
reading about US is interesting as always…
aditya birla fashion
the business involves lot of common brands we see in everyday life- Allen Solly, Van Heusen, Louis Philippe and Peter
England, Pantaloons
already discovered brands, the core business maintaining a cagr of 7 to 10 percent topline growth, profit margins are not that attractive either, growth is around 10 to 15%…
plain vanilla established brand name play.
2 recent developments though
they are ramping up the innerware section by leaps and bounds, though the division forms only 5 percent of their topline with a net loss in the ebitda level, but they have expectations out of this divion in future… no guidance available as of now regarding target revenue after a certain time frame, which cannot be expected atm
enthnic wear-
3 brands acquired Jaypore Shantanu and Nikhil
regarding jaypore the company have plans to open upto 20 stores in this year and the next , and bigger floor spaces than the existing stores
rest 2 are super premium category , where the company have plans to expand to around 7 stores, and offer the product at a lower cost than usual to favour penetration…
As of now the contribution of these two development to the top and the bottom line will look nonexistent, maybe for a number on coming years…
but that is the only remaining growth drivers apart from the growth of the core business…
coming to the market action…
given the strong pedigree of the management, and the brand name, it is clear since listing, the prices have not fallen and is constantly being supported by the institutions, infect the institutional value zone where they were acquiring position has shifted from 130-170 range to 180-200 range…
footprints of accumulation by the institutions are all over the chart…
question is when will this scrip start its markup…
as of now, it is stuck in a trading range in phase d of the basic accumulation structure, and in that trading range phase d is on going without any show of strength as yet…
kind of hope investment as of now looking at the fundamentals, until their expansion plan materializes in to new product mix and general demand picks up in the economy which is a very big question…
disclaimer… no positions yet, interested, not an investing/trading recommendation,
Any opinions about Ramco industries, a fundamentally strong company crossing 200 DMA today with relatively high volumes.
Ajanta Pharma filing the results tomorrow and somebody exited desperately. Insider info or profit taking? ![]()
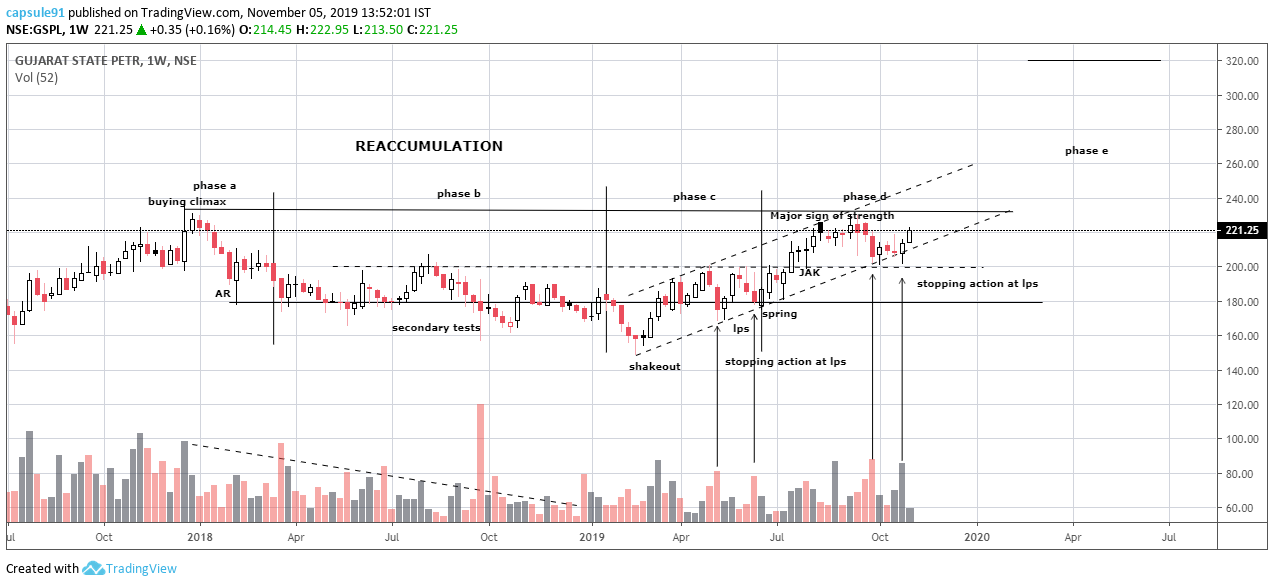
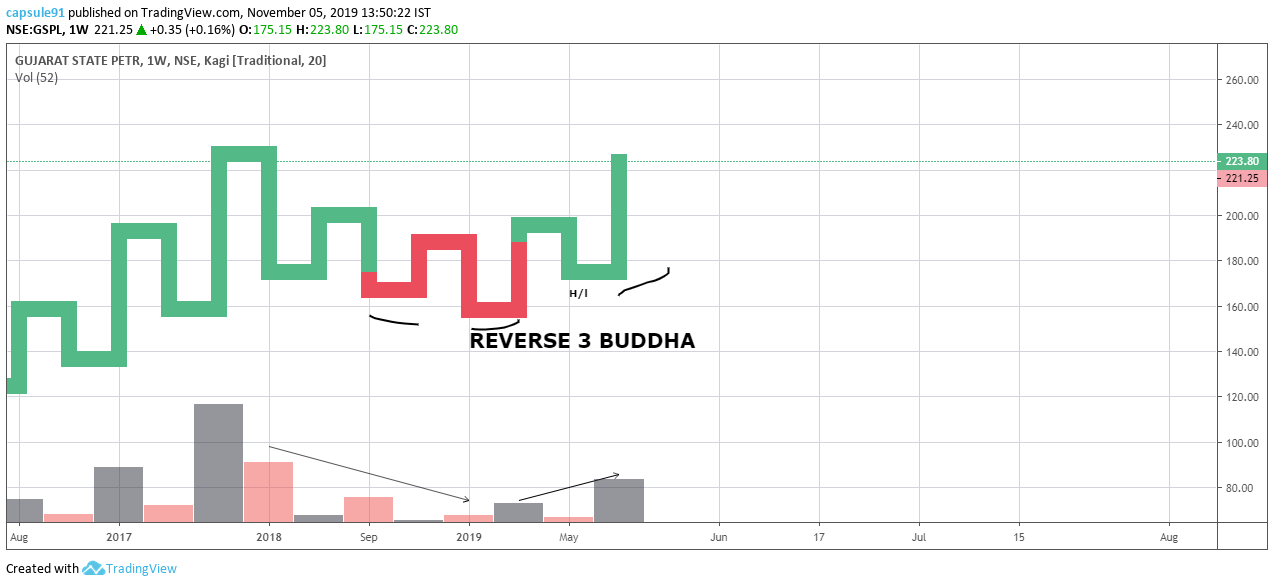
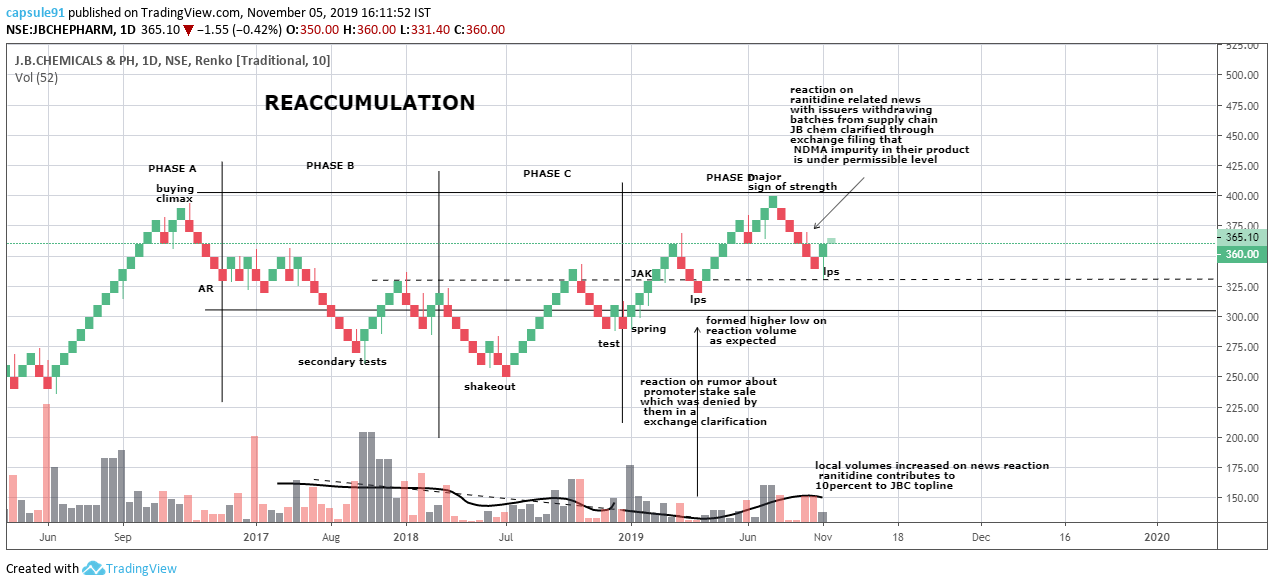
JB CHEMICALS…
recent tensions regarding ranitidine has affected the price action but the scrip didnt break though any important parameters which would change the bias of this market structure…
@hitesh2710 technical views on this please…
And from the us side…
U.S. may roll back tariffs on $112 billion in Chinese imports: report
But I believe market has already priced it in mostly. That’s why capital is flowing towards riskier assets like emerging markets since last couple of weeks and investor risk appetite is rising.
The news by itself would boost the markets for couple of days, at best after which the focus would again shift to earnings, again.
Agree…
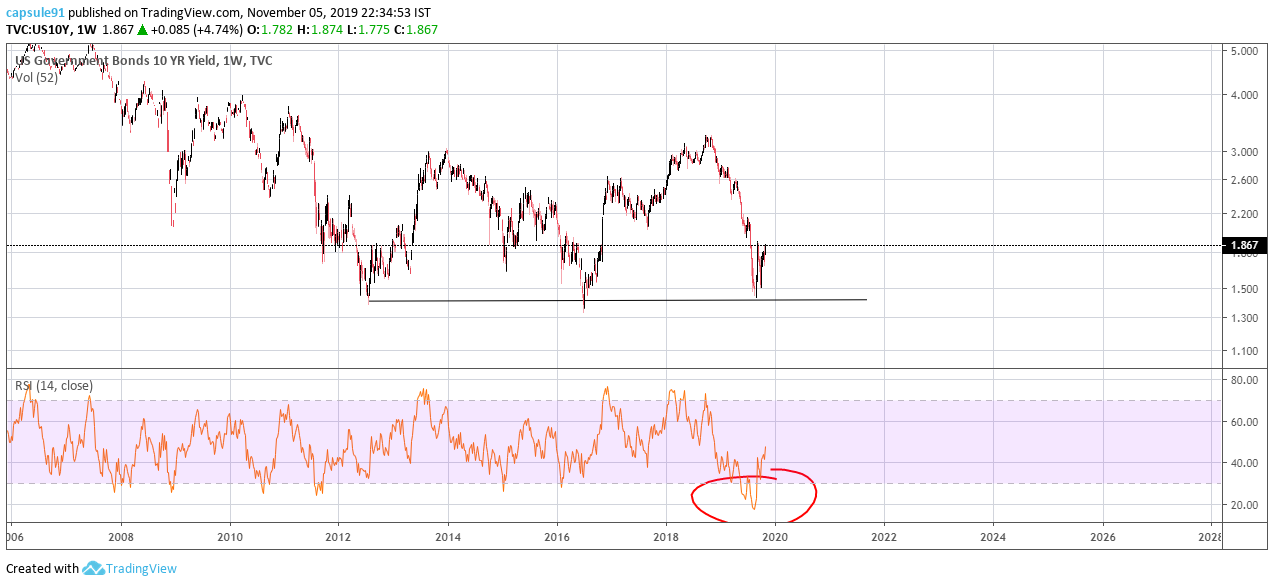
I think this is also because the bonds market has topped out and is already going down…
If a fraction of bond market cap has a switchover, equities will bubble up…
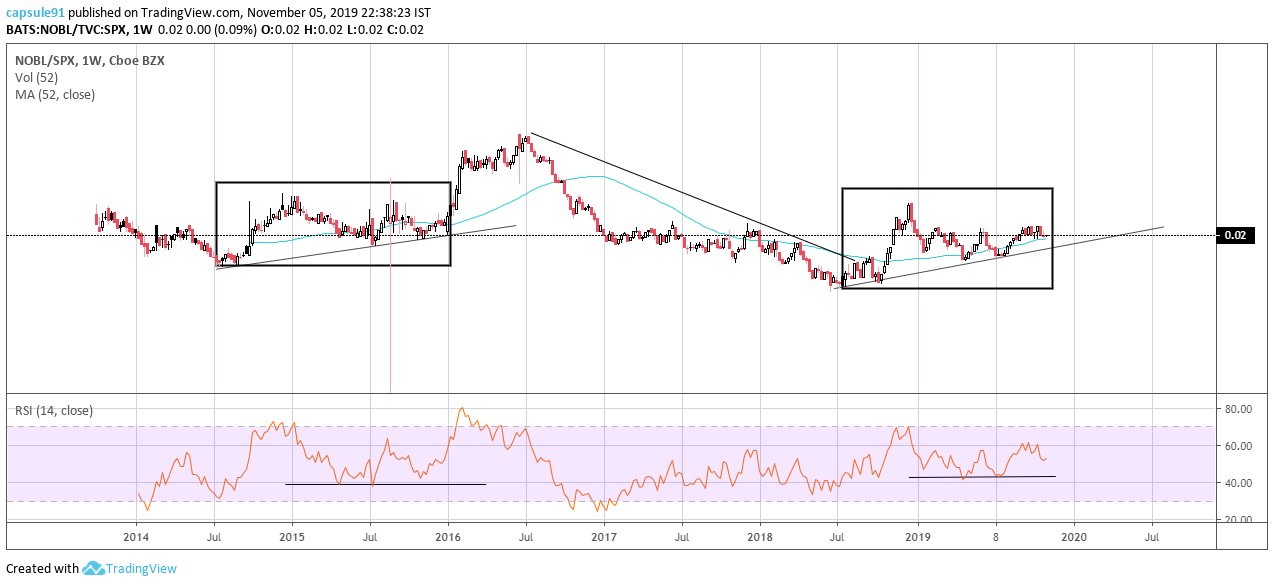
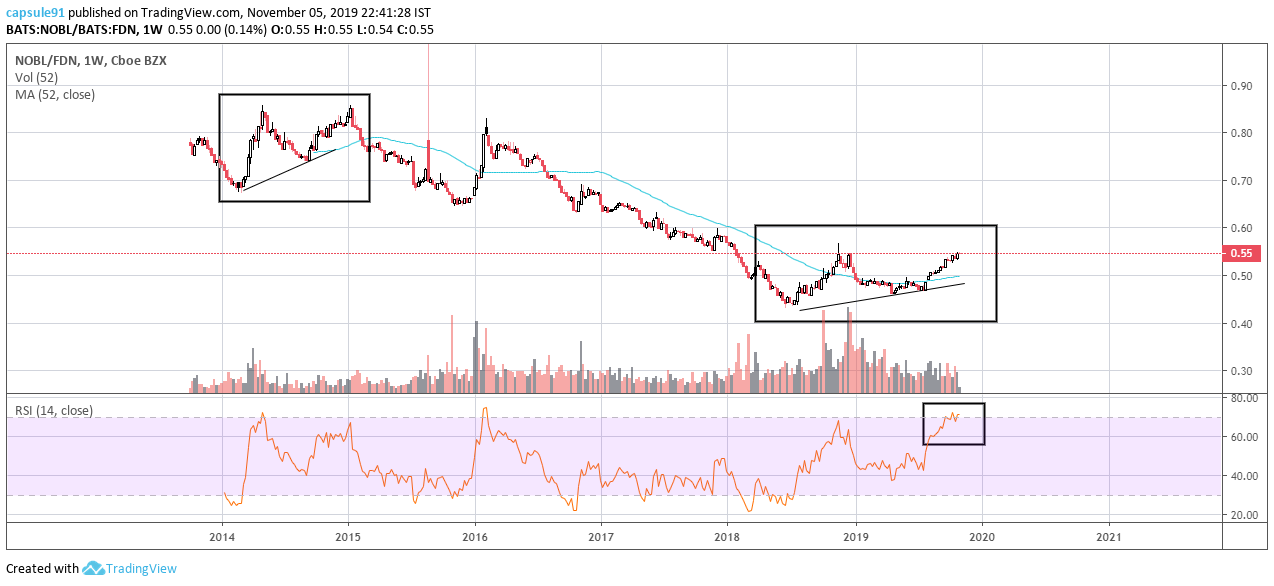
I posted a chart a while back, in us markets the dividend payers are outperforming the growth stocks in general…
supporting charts which look interesting…
this is how the ProShares S&P 500 Dividend Aristocrats ETF is performing relative to the s&p500… proxy for divindend stocks in general
if there is a rally coming in the largest stock market of the work, it might be in recent times…
we have seen reflection of this in our index as well…
this view can be negated if china us trade deals do not materialise, tensions regarding us elections starts up [there are odd rumor about impeachment possibility of their president, to be taken lightly ], US earnings not showing up in subsequent quarters[which is lack luster in the past quarter already], no resolution to brexit issue…
mean while the S&p continue to make all time highs, the US media are completely filled with bearish undertone… a deja vu from 2018 jan in india?
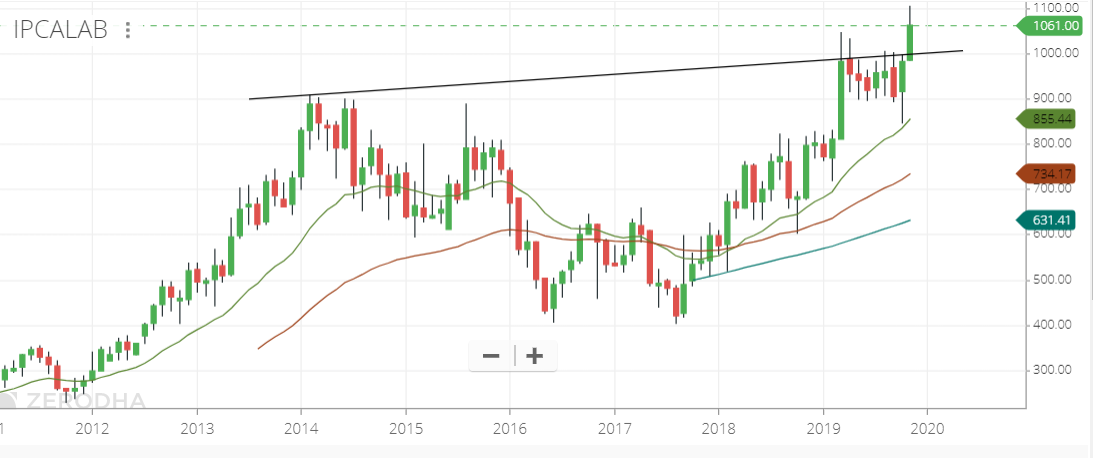
IPCA Monthly. Appears to have broken out of a long-term C&H pattern which has been forming for 6 years 2014 to current.
During the same period, from FY14 to FY19, the PAT has moved like this
477 → 256 → 93 → 188 → 233 → 455
Sort of similar to what has happened in the cup formation. Now TTM, with the good numbers today stands at about 590 Cr. So the earnings numbers have gotten ahead of the price going by historic valuations and the TTM P/E is about 23 levels from 8 Yr median of 27 levels (3 Yr and 5 Yr medians around 35+ levels). There is strong support on the price at 1000 levels now and probably about 20% upside at least in the near-term when the P/E goes back to 27 levels. The growth is fairly good quality, aided by both topline growth and a bit of margin expansion which augurs well. So fundamentally and technically both point to a 1:4 sort of risk:reward situation which is quite favorable.
Disc: Have a trading position
Not fully out of the woods, as of yet, IMHO.
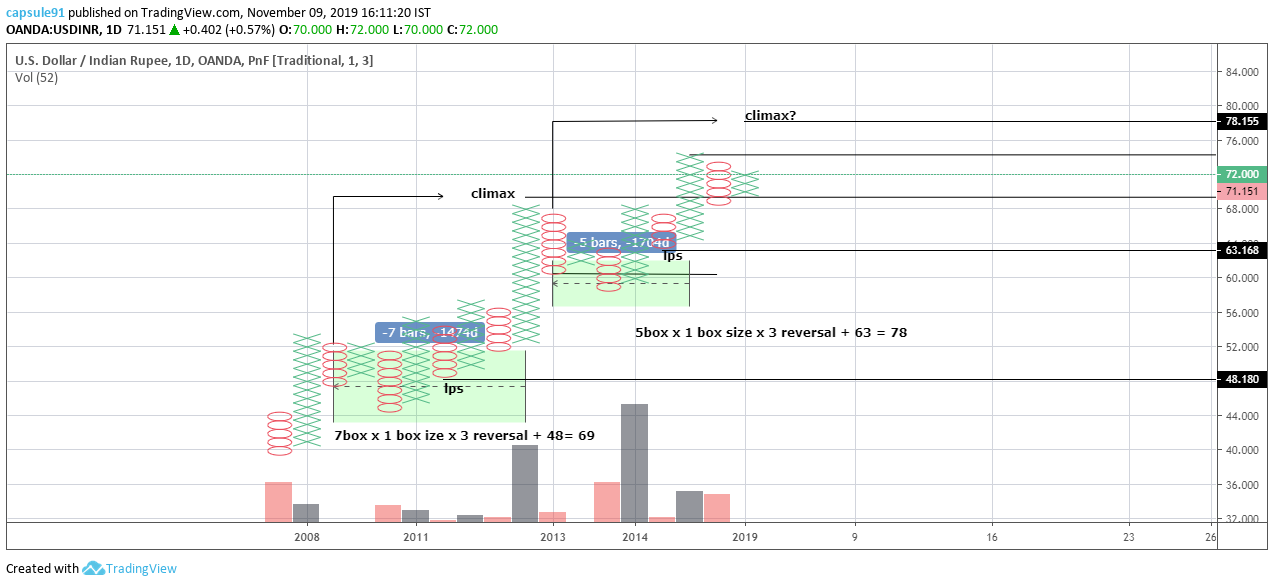
one of the best gifts of wyckoff methods is point and figure charting to project price potential of accumulation bases…
the bases generate a campaign count which is the potential of the major accumulation picture and confirming counts which is the count generated from reaccumulation pauses inside the trend…
the usdinr chart had a historical count which had projected the turn would happen at 69rupee, which worked usdinr sharply turned from 69.488
now the present base points towards 78 as a climax point…
its amazing to see , back in 2013, pnf charts indicated the 2018 jan climax level…
here is the corresponding price chart…
for years wyckoffians have made people wonder with how much perfection the pnf targets work, some of the leading wyckoffians of today themselves admit when they forst got introduced to pnf charts like richard wyckoff used to do, they outright rejected this as a scam…
now they literally swear by it…
here is a very good video regarding pnf charting and in general wyckoff techniques by hank pruden… one of the 2 last living students of wyckoff, other being david weis

david sort of modernised wyckoff methods , in much simpler form…
here is the only video i have got of him explaining his methodology, besides his book, trades about to happen

i would ask all fellow members to atleast go though david’s video…