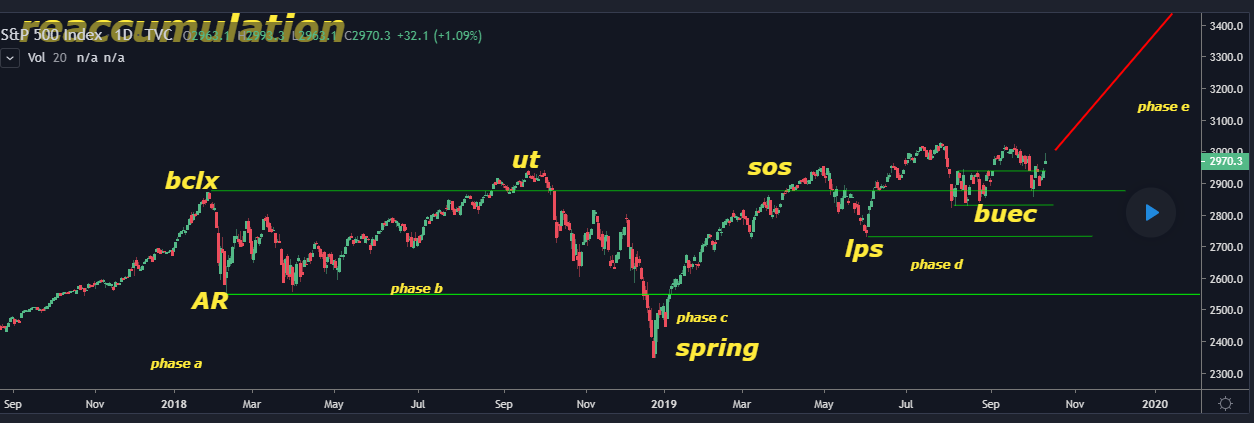
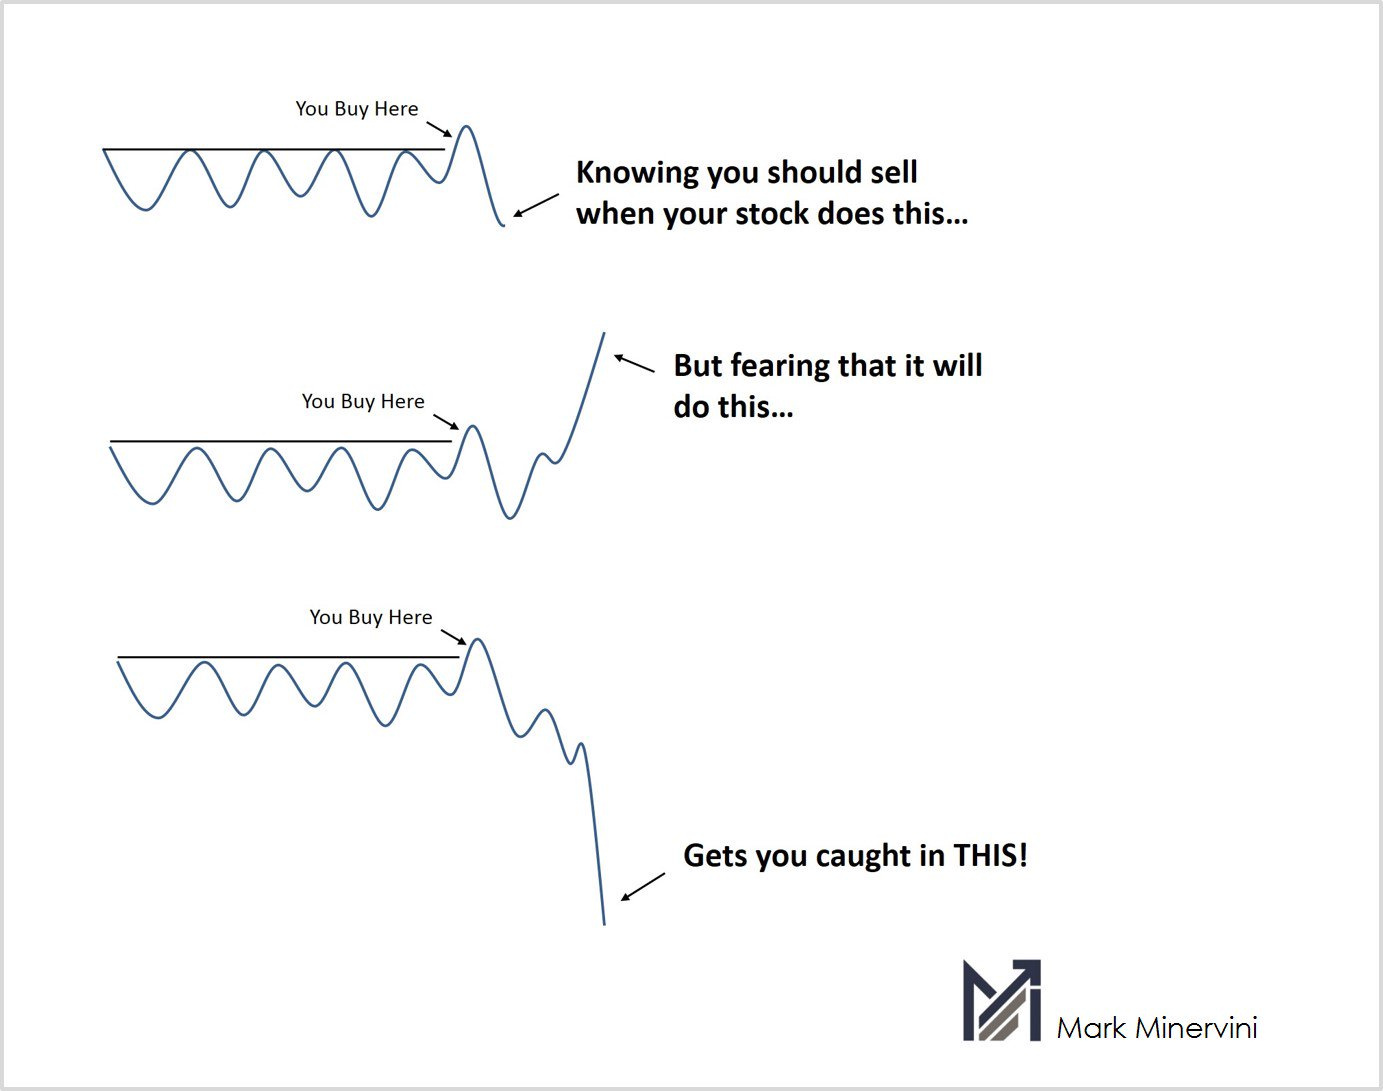
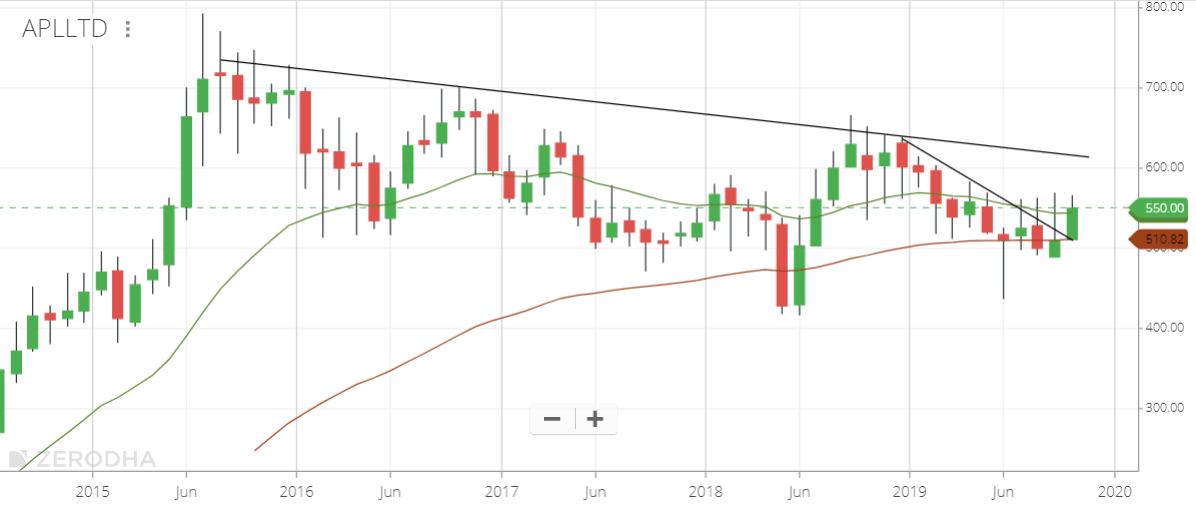
well, it can, but breakouts are most commonly retested with low volume corrections, some people term that as a back up action…
it might break out of the previous high and retest
or
it might stall here and retest previous resistance
since 3500 around levels were a resistance for a long time, test 3 times and failed, i think it will test and then move up
on the other hand the momentum can be stupendous and it might not come down in that case, i will staircase my further buys…
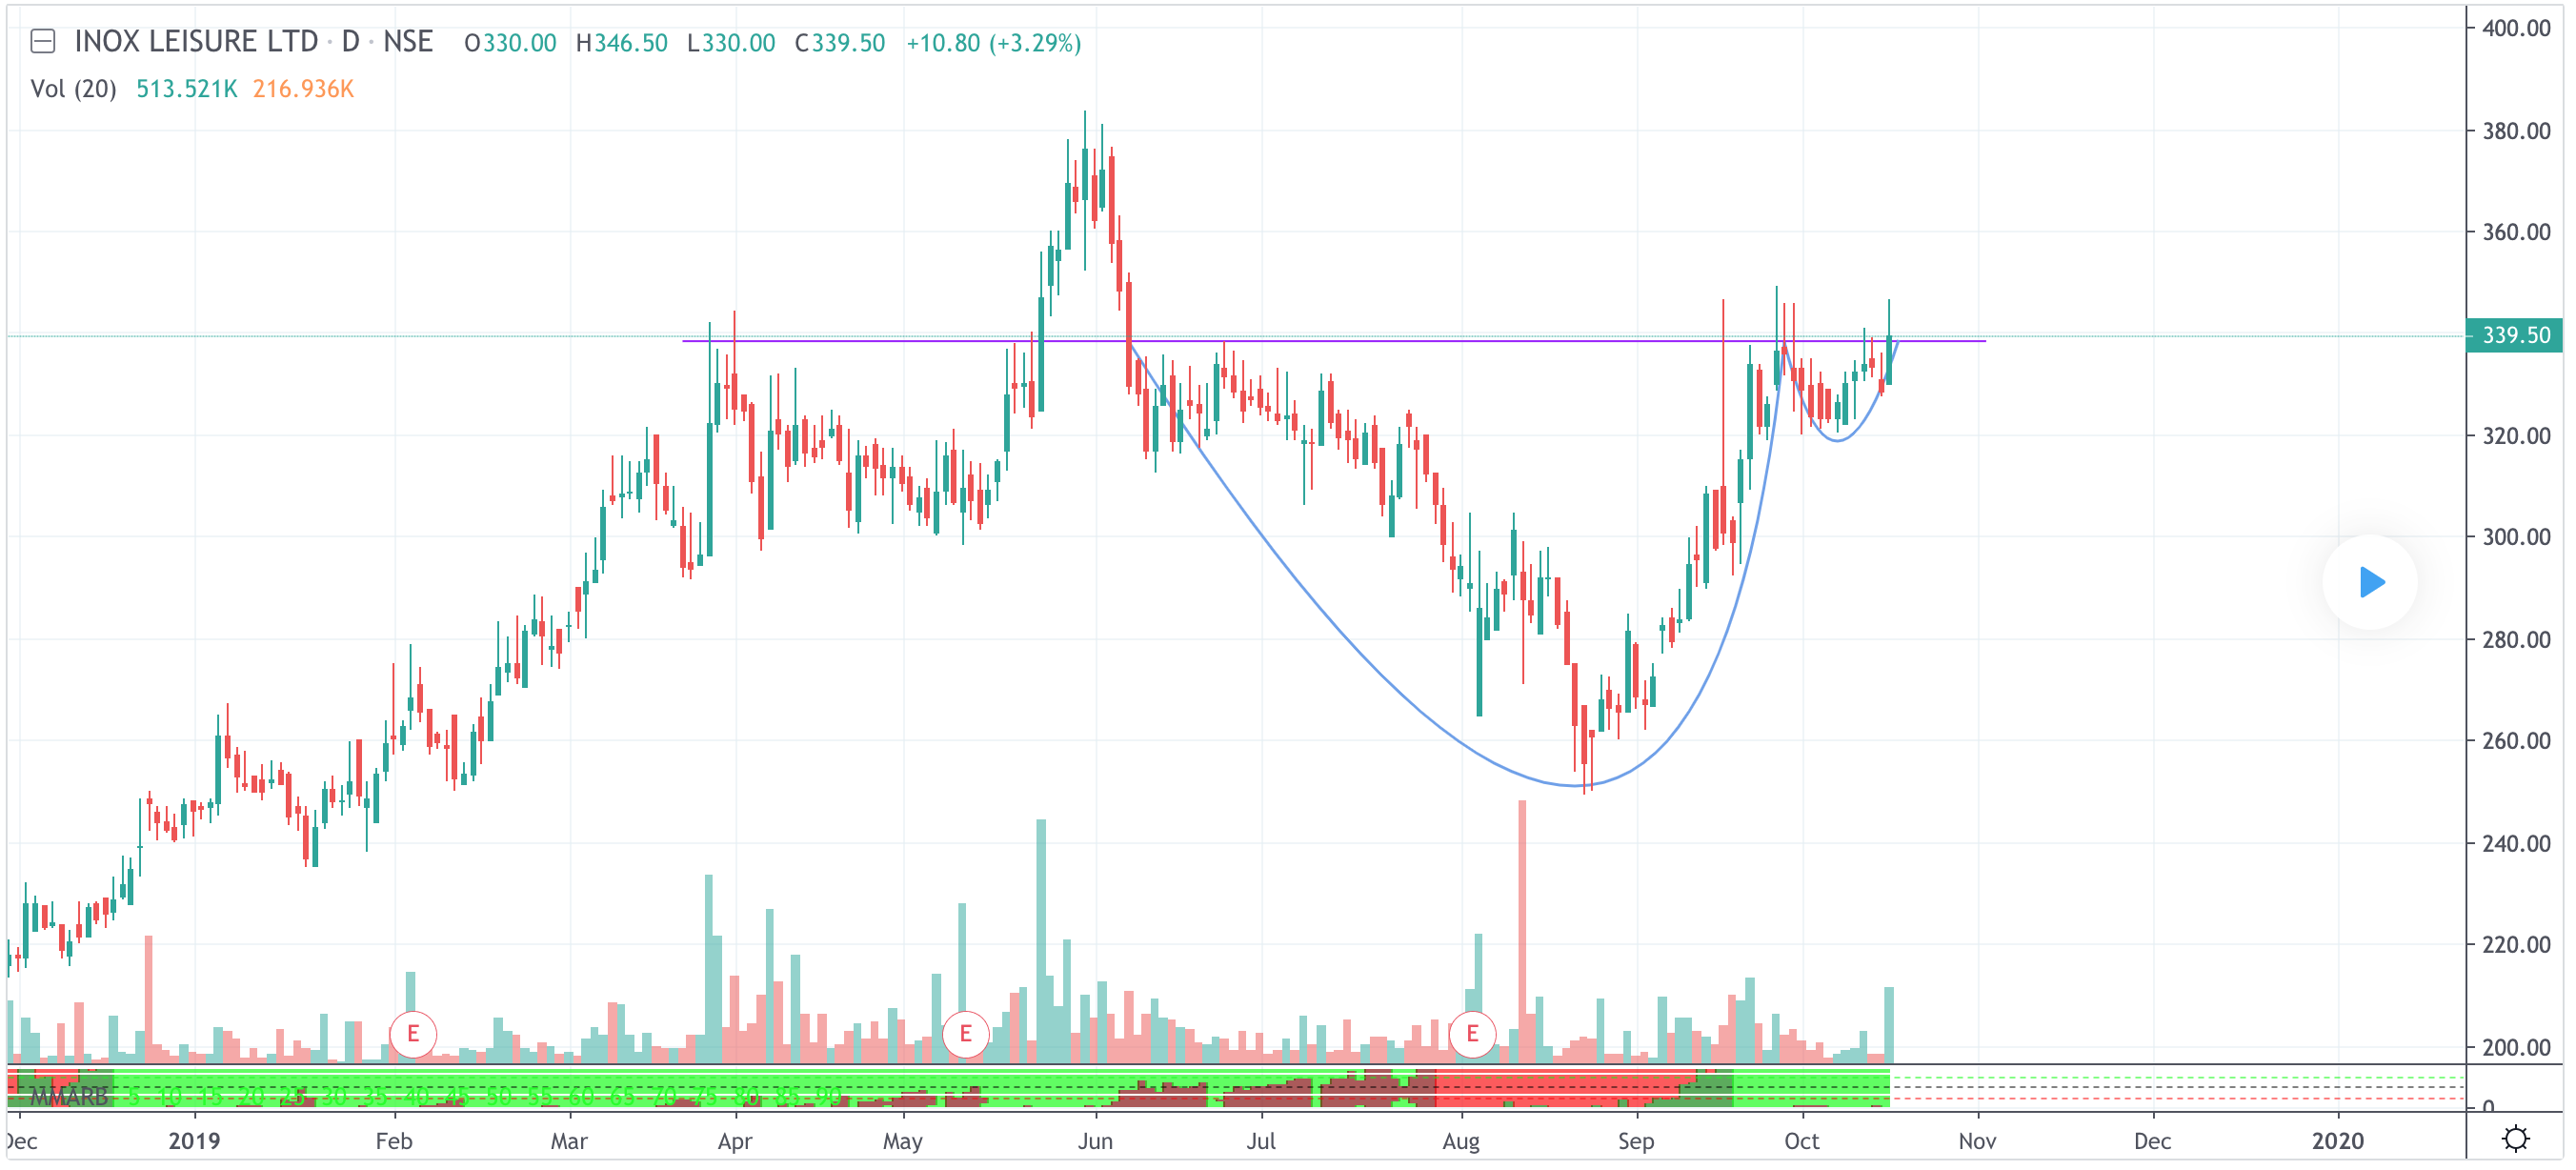
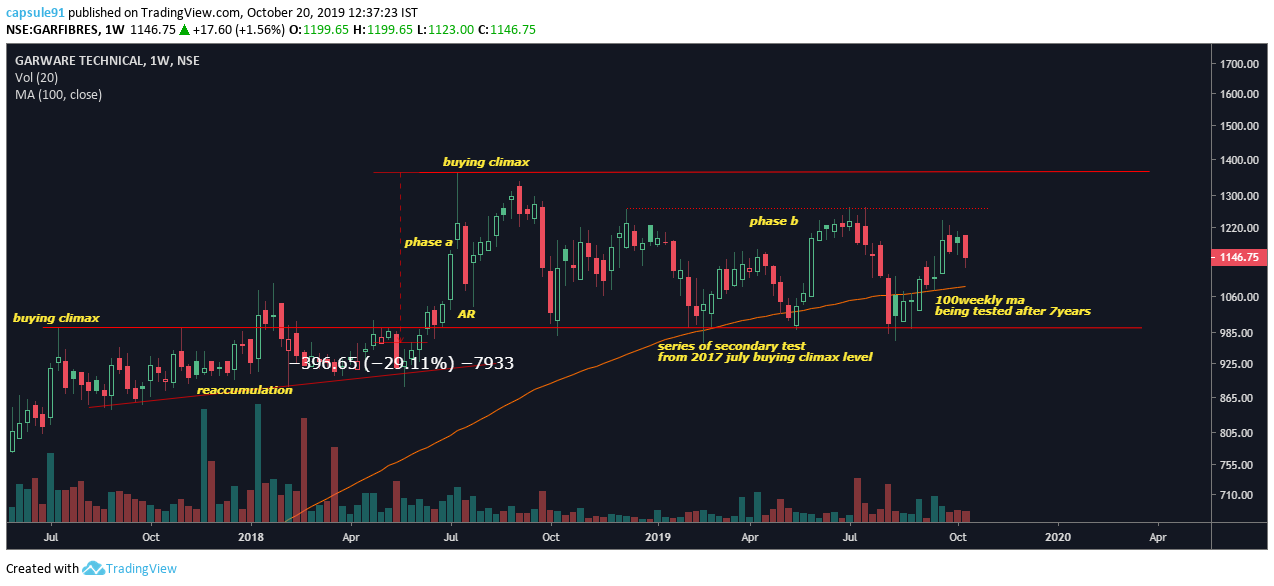
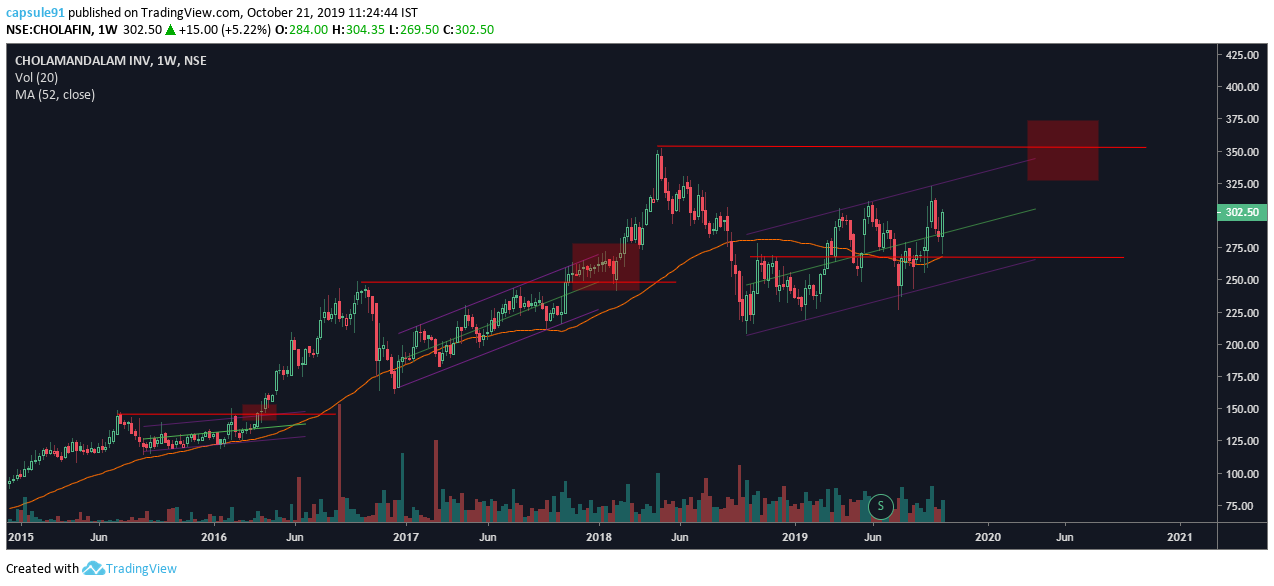
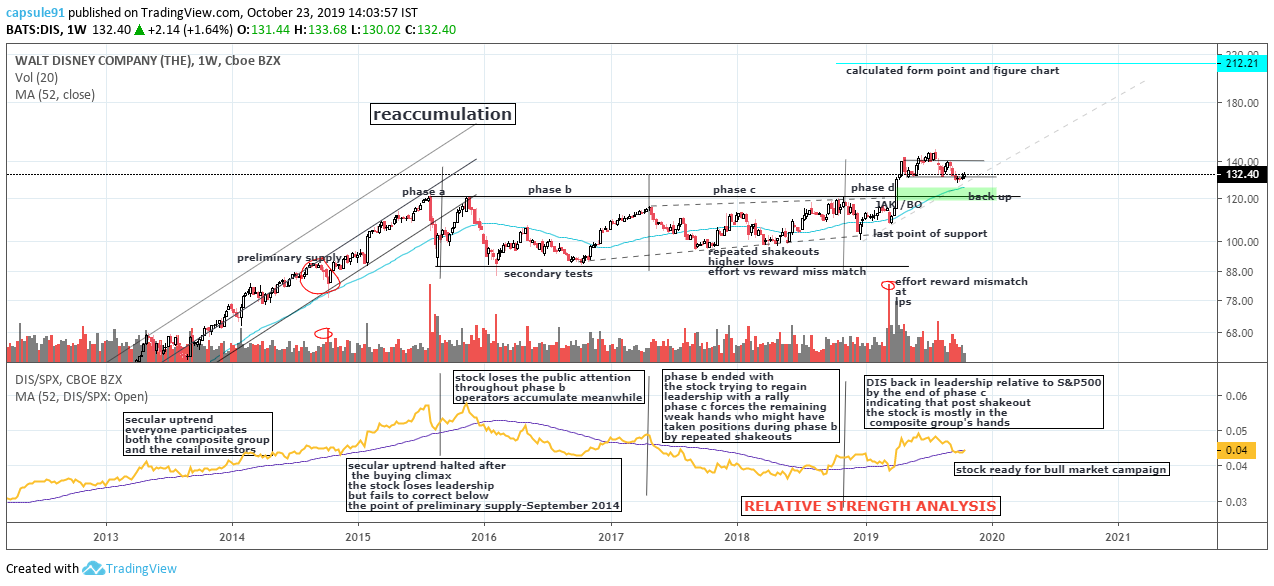
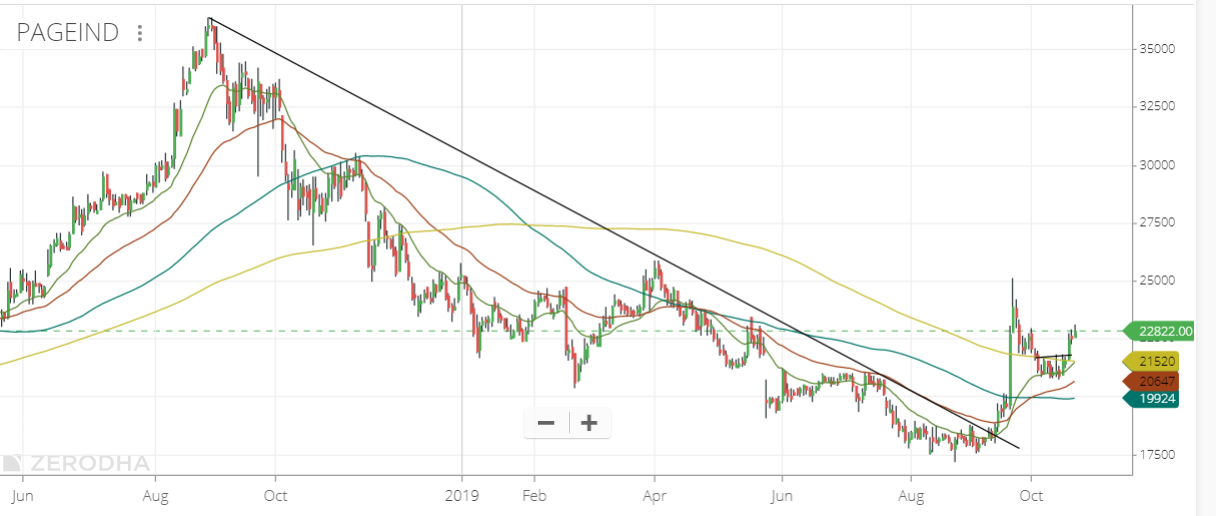
for example, one of my recent investments after breakout of the previous high and retest…
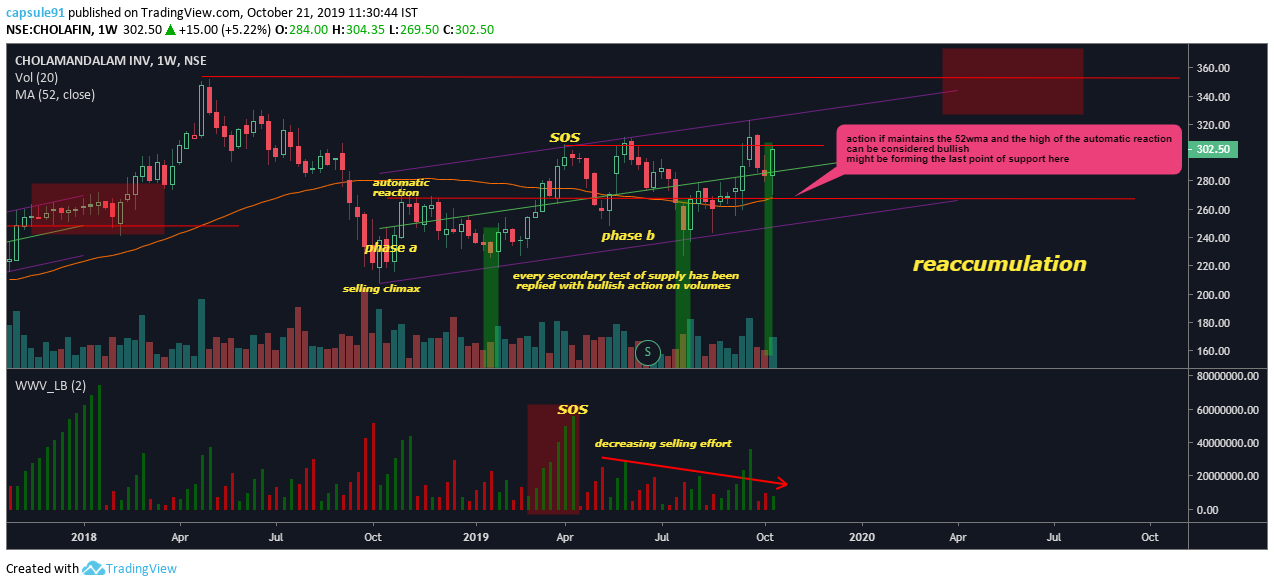
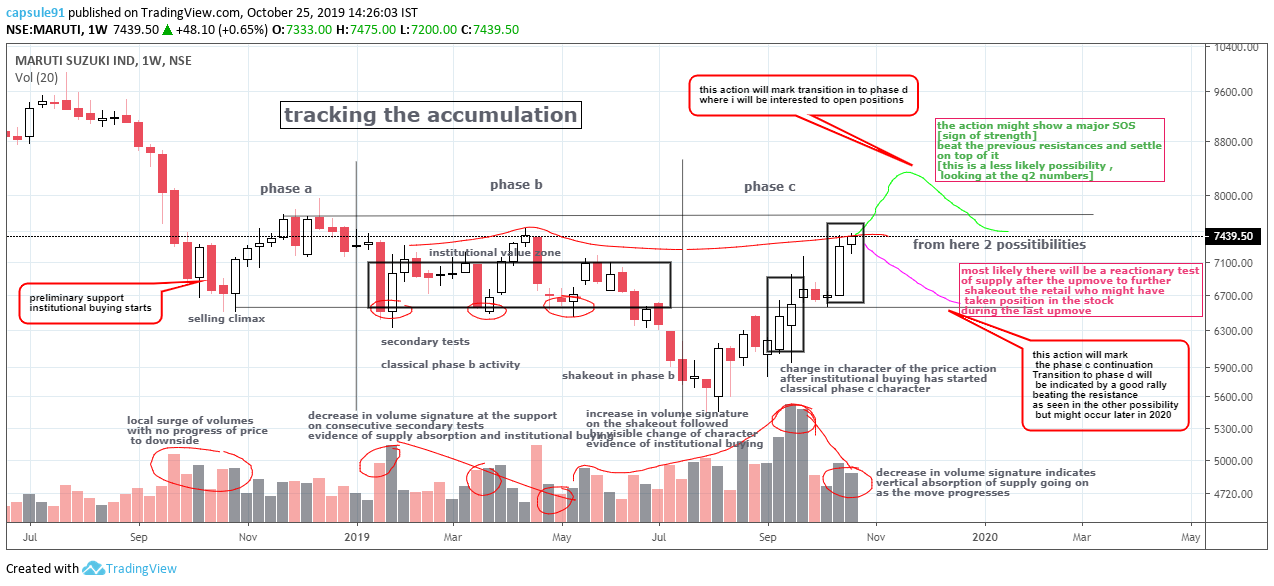
so far, lots of signs of accumulation, in particular the spring formation , taking right upto the top of trading range showing sign of strength and then refusal to breakdown from a upward demand trend line , and resulting lack of volatility which is a characteristic feature of phase d…
breakout should follow and confirm the theory
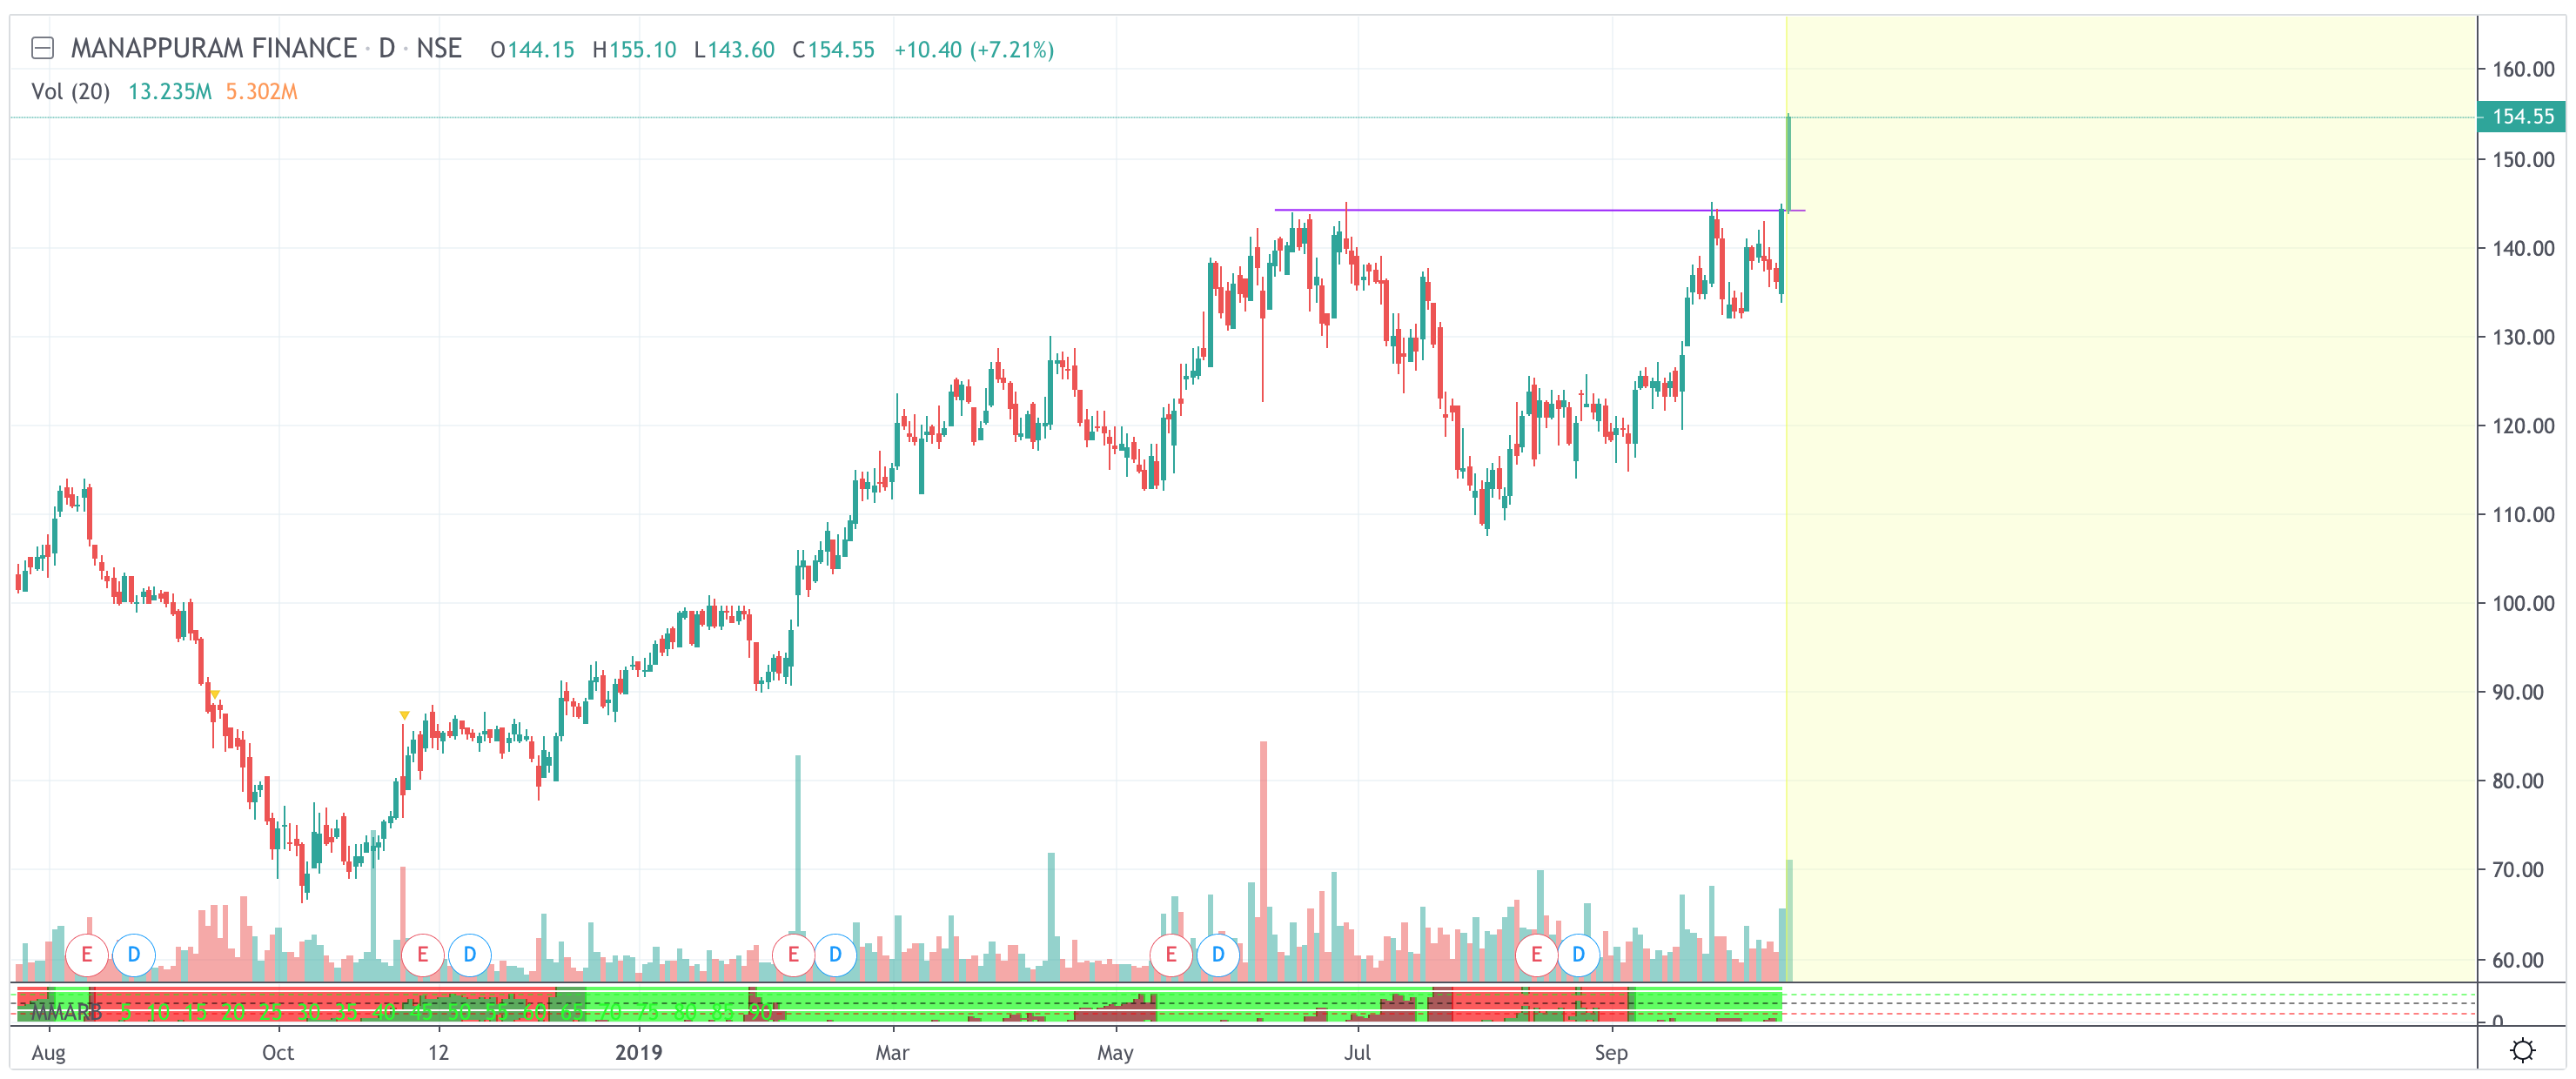
recently a tweet from one of the best wyckoff analysts shows a similar theory he also holds,
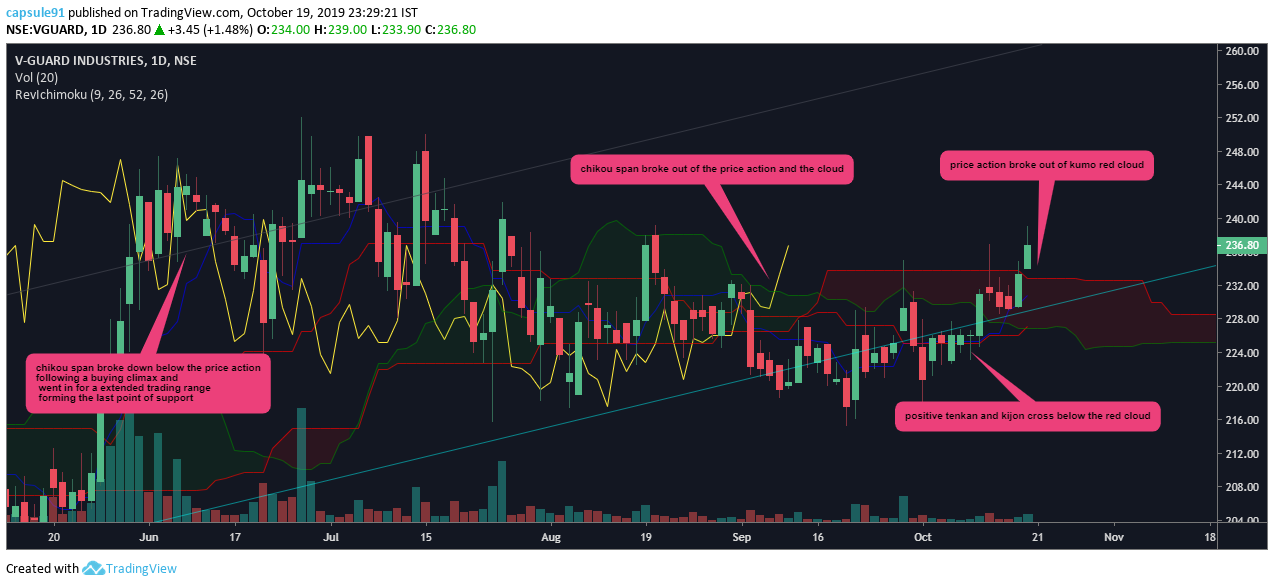
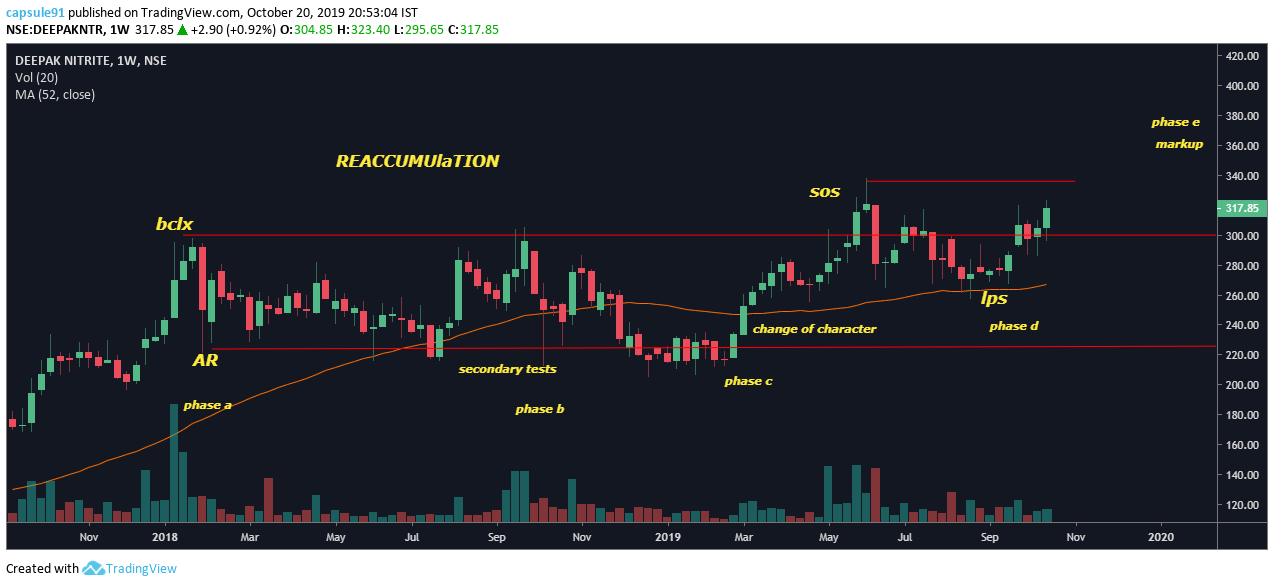
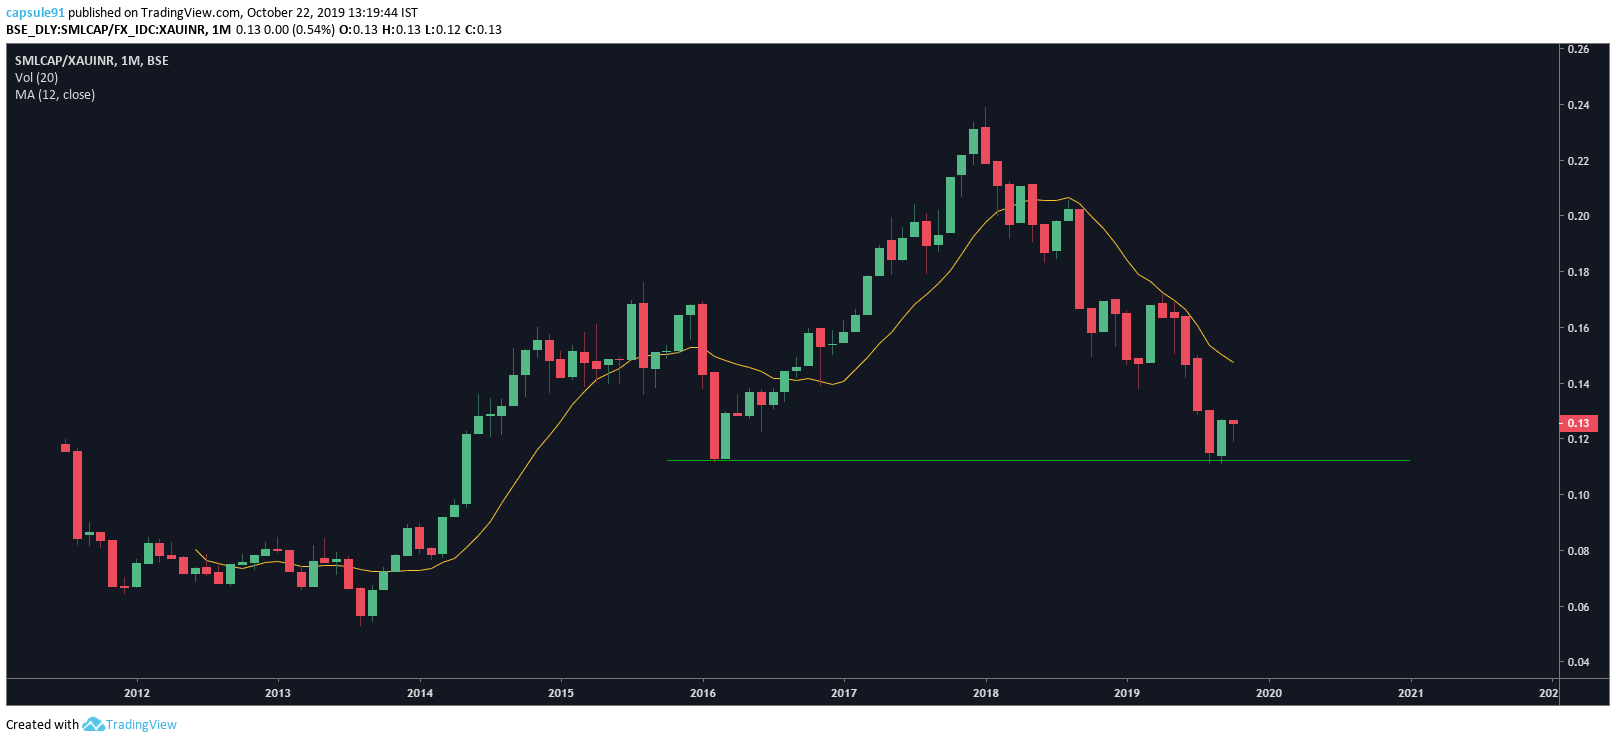
looking back at this chart after almost an year, and i do not spot a hint of anything other than accumulation…
my apathy towards comchem stocks though continues…
lets see if this forms a trend… the story is well known to all, both in numbers and unclarity of future demand supply of the phenol business…
stopped tracking the chemical space since a long time, but this i guess is one of the few companies which maintained its price to book throughout the past 24 months…
mutual funds have accumulated a good number of shares acc to the shp, some quantitative evidence of accumulation…
it dosent really help much to mention each chart which still is in the trading range and to me shows signs of accumulation , so these are a list of other stocks which forms my current watchlist other than those already mentioned…
power grid
orient electric
elantas beck
bluestar
finolex ind
techno electric and engineering
elgi equipment
hatsun agro
gruh fin
navine flurine
vip ind
supreme ind
niit tech
if anyone wants to discuss the technicals and has some opinions to share please do so…
disclaimer… no positions in any of the mentioned scrips except gruh, tracking all…
not a buy/sell recommendation
Most of these scrips are in consolidation mode with a positive bias. But the problem is, shares sometime stay in consolidation mode for years. Not every accumulation follows a wyckoff pattern. So it’s best to take position after confirmed breakout only, IMHO.
Disc: Holding FINPIPE for last 7 years, no position in any other mentioned scrips.
nifty it, clearly losing leadership to sensex
nifty auto turning back up towards the moving average, might have neared bottom and accumulation might be starting , may be considered as a long term value bet
nifty metal, is at 2016 lows, still grossly weak compared to sensex
fmcg seems to be gaining strength, hasnt been a darling spot post 2013
pharma, still weak
media, sharply lost the leadership it had in 2017 run
interesting picture in nifty consumption
nifty energy might be interesting going forward
infra continues to underperform as per the norm…
bank nifty still in uptrend relative to sensex, struggling had to get back leadership…
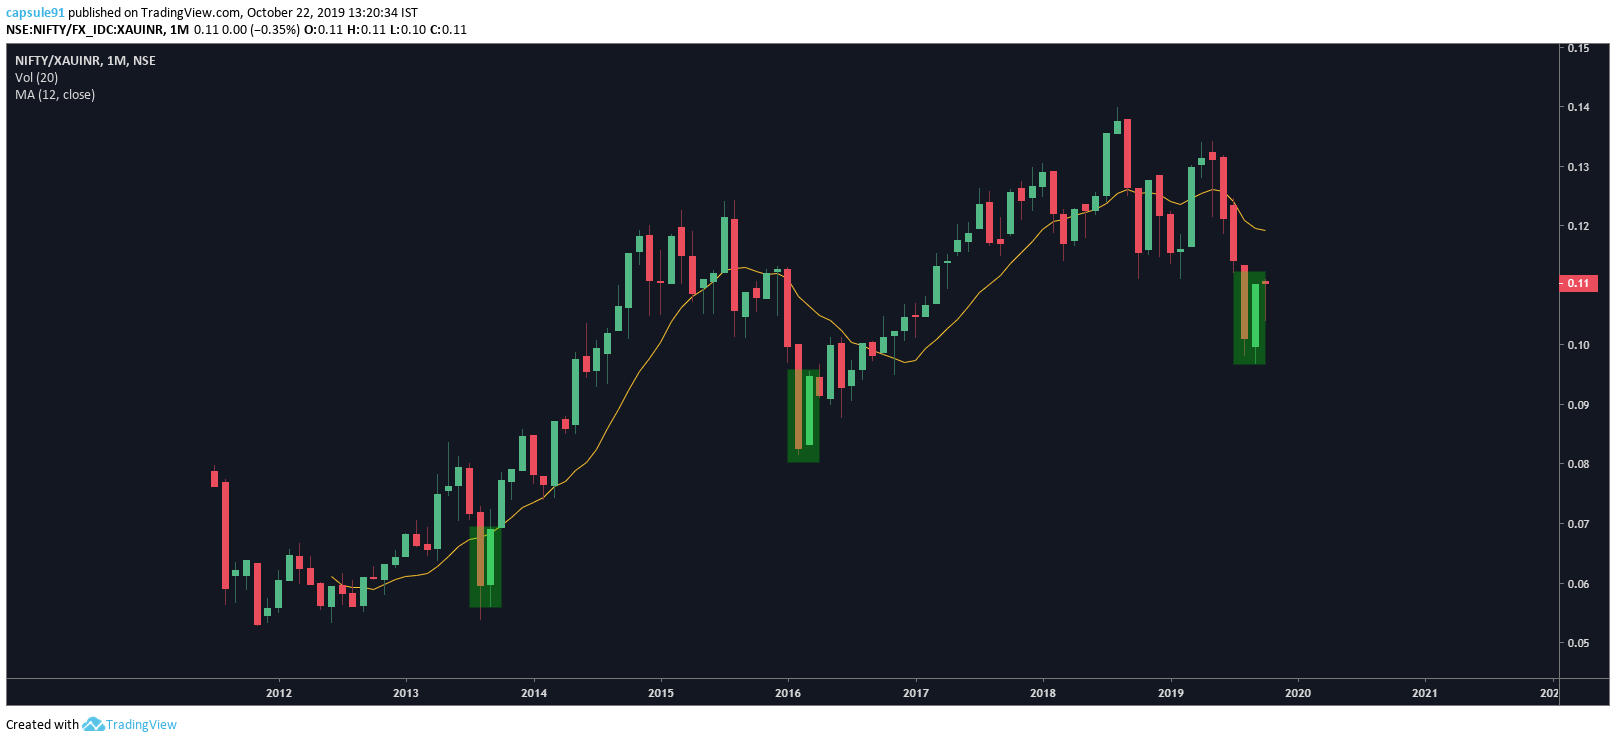
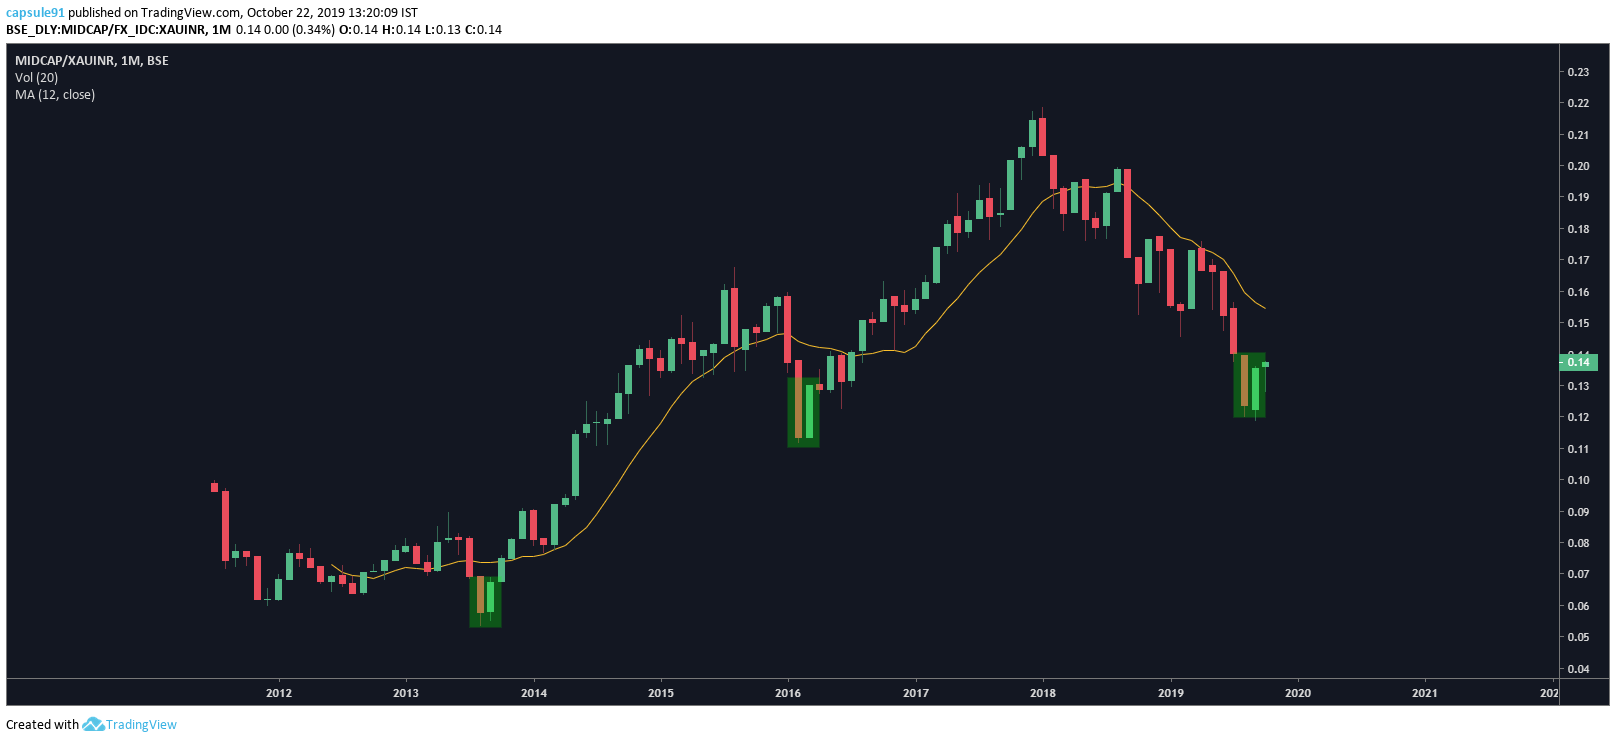
mid and small caps as we all know are underperformer with no signs of reversal, but at previous lows in relative strength curve and in the derived relative strength index…
conslusion- on a broader perspective, consumption, fmcg, energy, auto are the areas i would prefer looking into , would avoid it, infra media, realty, metals…
banks would have to gain back leadership if index has to show any trend going forward, whould like to monitor…
disclaimer… not an investing/trading recommendation
all the bests everyone
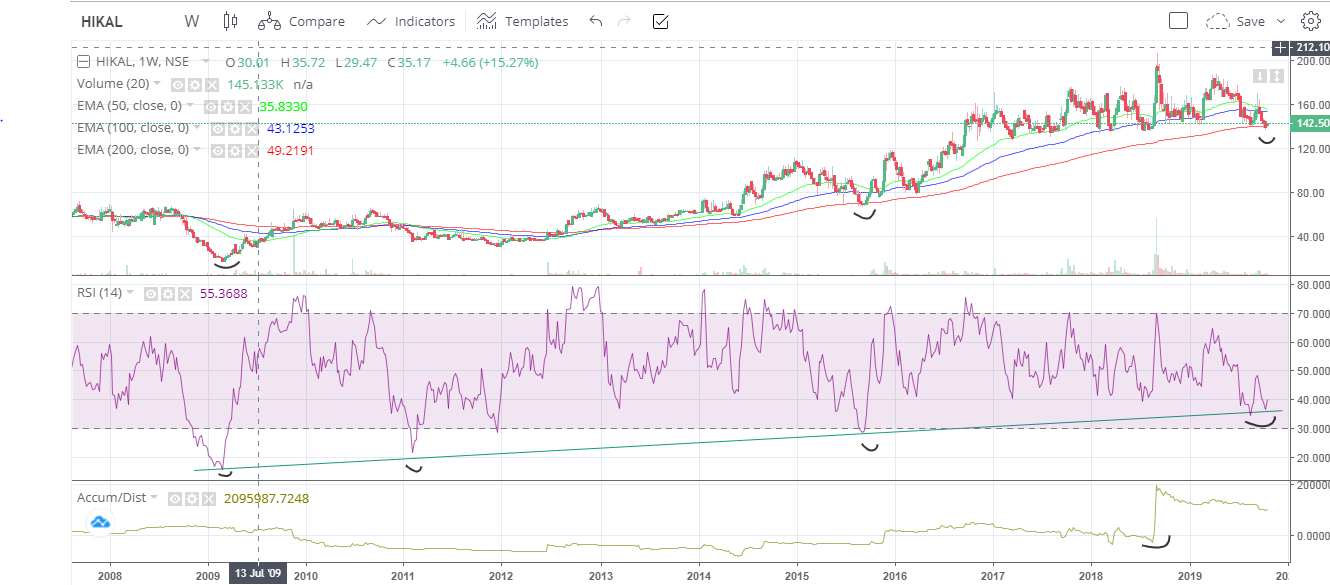
HIKAL- Stock can take support around 200 W EMA, as RSI has bounced several times earlier. (with this i expect the stock to break the 3 years consolidation phase upwards).
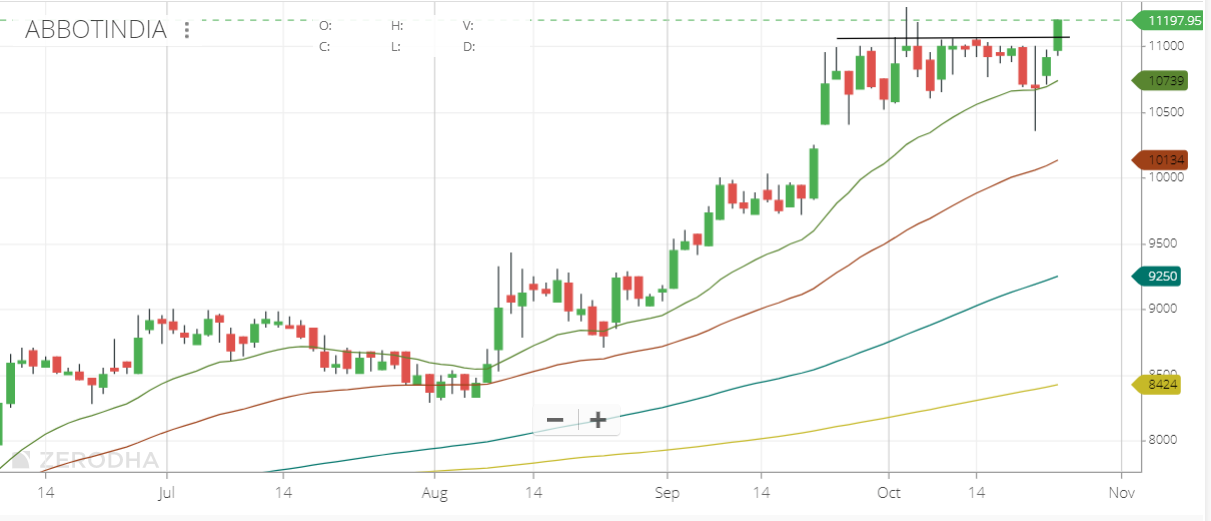
Abbott India (Daily) - Appears to be pulling out of that consolidation around 11k. If it manages to stay above tomorrow, could be a breakout on the weekly as well.