A good company facing serious headwinds. Debt is increasing, ICR is damaged like never before. Any weakness in the chart should be rewarding.
Monthly chart shows that the low of 2016 is damaged, and further break of a small support at 100 will confirm the break of 2016 low and probably drag the price to the next attraction which is at the level of 40.
PS: Only Sharing observations. None of the above suggestions are of actionable quality.
Personally I would wait for the volumes to dry up and a few more tests to happen. These bottoms are generally long drawn out affairs. The sign that i would be looking for is a long tailed bullish hammer where the tail is twice or thrice the length of the body in the wake of a bad news event. Also a small body on twice or more of the average volumes is also a good sign.
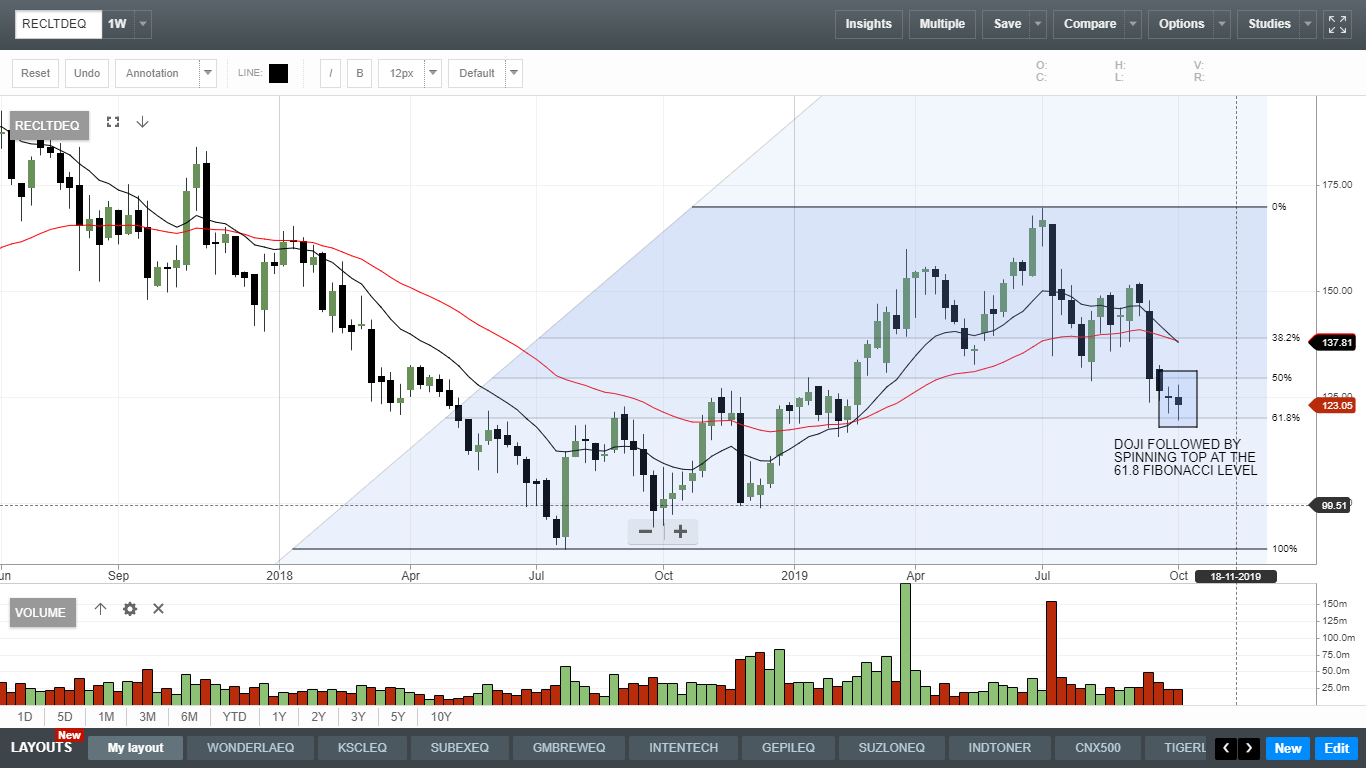
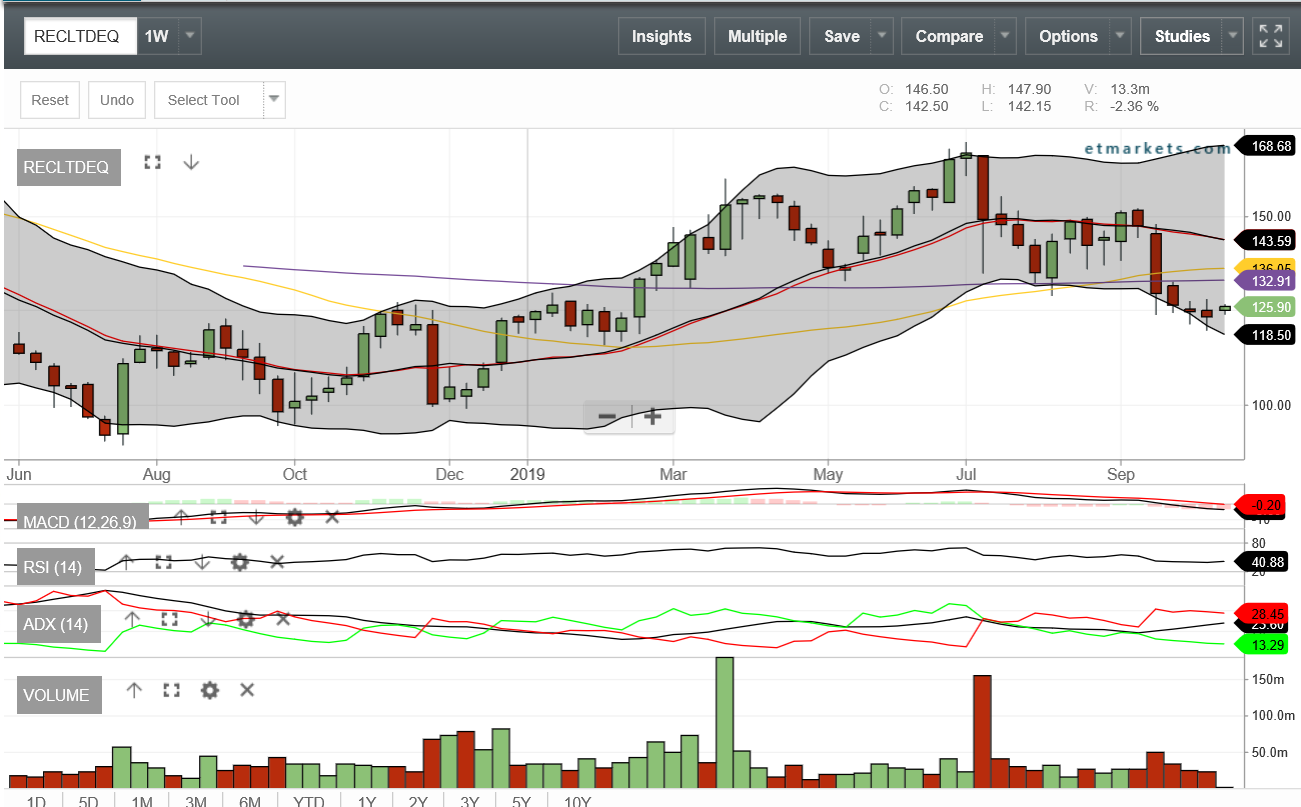
Another interesting confluence of candlestick and fib levels seen in the REC chart in which i am invested. A clear spinning top in the wake of a doji exactly at the 61.8% fib level. A spinning top often indicates a change in the direction. For Elliott wave aficionados , this spot also is the end of a clear A-B-C correction. Anticipating a sharp reversal next week if the analysis holds any water.
Stock price went down below 200 dema and seems staying there since many trading sessions. On daily chart there seems to be a death cross. i.e 50 day moving avg crossing below 200 day moving avg from above.
A clear head and shoulders pattern breakdown seems visible on charts with a slightly downsloping trendline. If pattern plays out, targets could be closer to 100. cmp 123
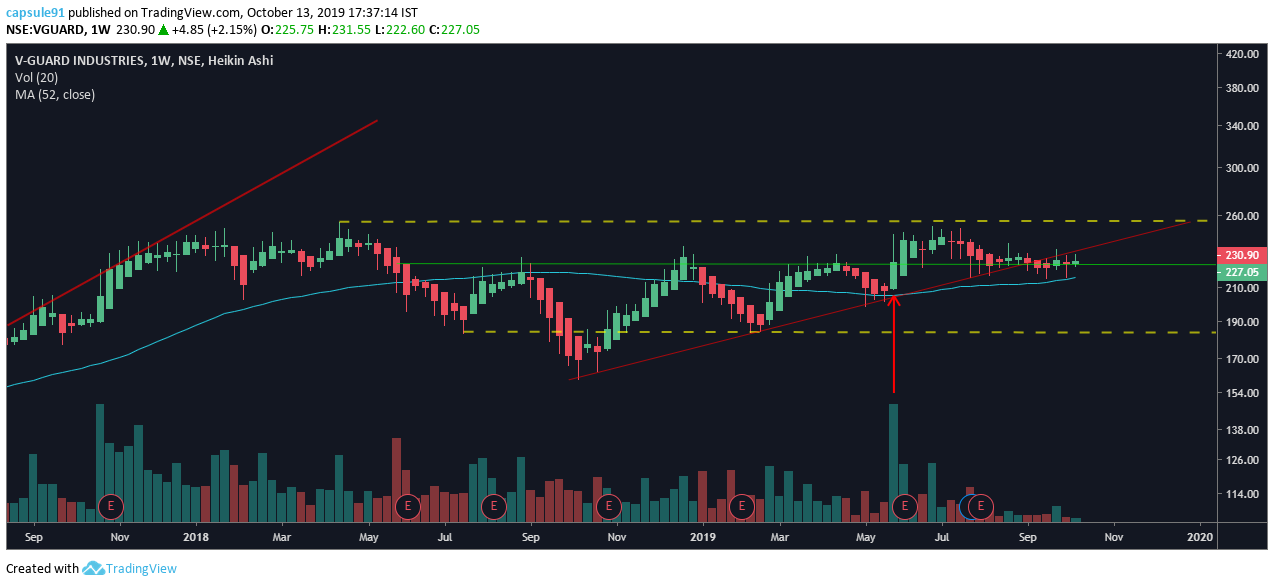
technically, it is coming out of a nice base, and presently testing the 52week moving average, which was previously a strong resistance, the 220 region which was also a resistance was taken out on record volumes and presently, another small reaccumulation is taking place at the 52 WMA…
over all a very nice change in character with consistent higher lows, and of the 3 downward retracemnts this year, the ongoing one is neither generating much volumes , not much fall in price action.
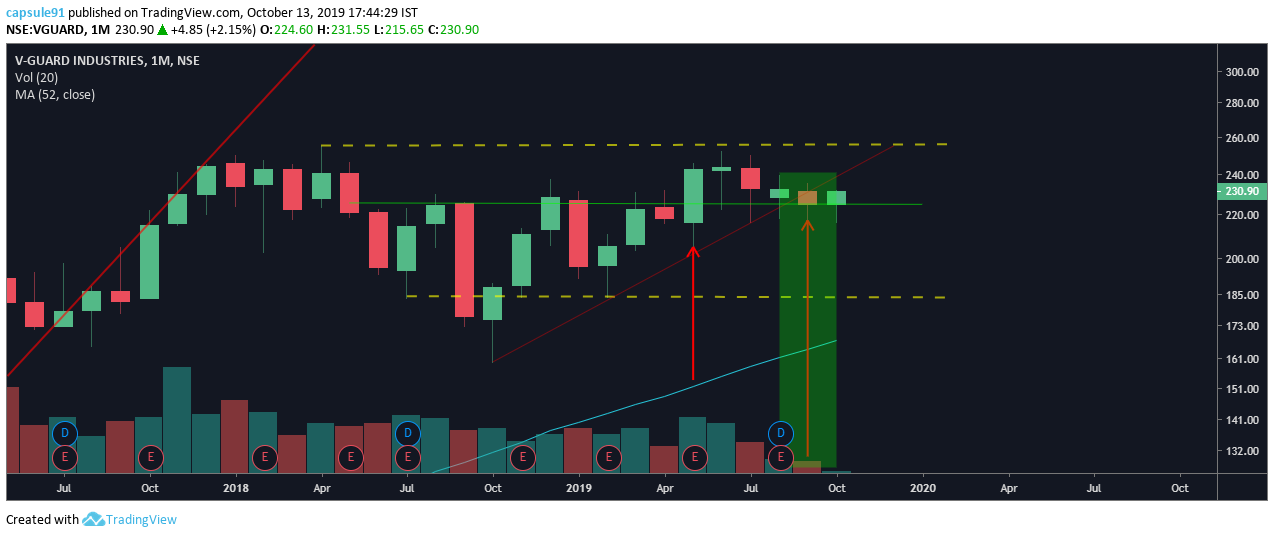
on the monthly chart, September generated the lowest volume candle in 2 years, and it was a negative close with a larger tail wick than head wick…
I may have opposite views the reason why it may be bearish in addition to points made by @hitesh2710 Hitesh ji ,
1 There is not volume play .
2 The trend is downwards.
3 the trend of selling is more strength than purchasing as depicts from ADX in weekly candle
4 However the stock is near bottom side in the Bollinger bands so there might be slight upward movement but that will be temporarily
REC has a very good dividend paying history. The interim dividend it paid last in March '19 was itself Rs 11 per share and in my opinion it will maintain at least that level going forward. Ofc one can have a view that dividends will go down due to the risky nature of power lending and that view could also materialize. The current bank FD rate is 6.25% which translates to a multiple of 16. Applying that multiple to the last dividend of Rs 11 ( and any final dividend it may declare) itself gives a minimum value of Rs 176 per share. Plus there is a strong possibility of higher dividends due to the tax cuts.
Also technically as i already mentioned earlier in the post what looks like a downtrend to others looks like a A-B-C correction to me at the 61.8 fib level with some good looking bullish candles of late.
My concerns is around its low PCR of 48% and ofc the age old issue of stressed power assets but in my view odds are favourable.
Sir ,
Call above is only on technical side but here are some views which talking about the MARCO level Although You are right it is a good PSU however four year back there are about 18400+ village which were not connected an now only 250+ left .
The major lending is to state governments and 1/5 the are loan to the private companies . Some of financed the project are in intensive care units. they are having regulatory issues .
REC had help to accomplished sobhagya programme to BPL families .But Going Forward Where they will create the VALUE . The slow installations of Renewable segments .
I like PV Ramesh as a person .He is vey dynamic but the life of PSU like recent ongoing happing with BSNL and in past we have seen ONGC HPCL merger announcements or VIJAY BANK DENA BAnk and BOB eroded the wealth of the shareholders .
Regarding dividends if PFC’s inferior profitability may rubs off on REC , and that high dividend payouts could be a thing of the past.
in the PAST REC had raised the funds from the GREEn corridor bonds but which the combined entity what will be capital cost that is a big question .the Portfolio of both are different REC largely finances transmission and distribution, PFC funds generation so there might be priority clashes (THIS MAY NOT HAPPEN THIS IS ONLY OPINION )
if we talk about the numbers REC is better than PFC but how they will roll out after merger ONE MUST SIT AT BORDER .
Regards
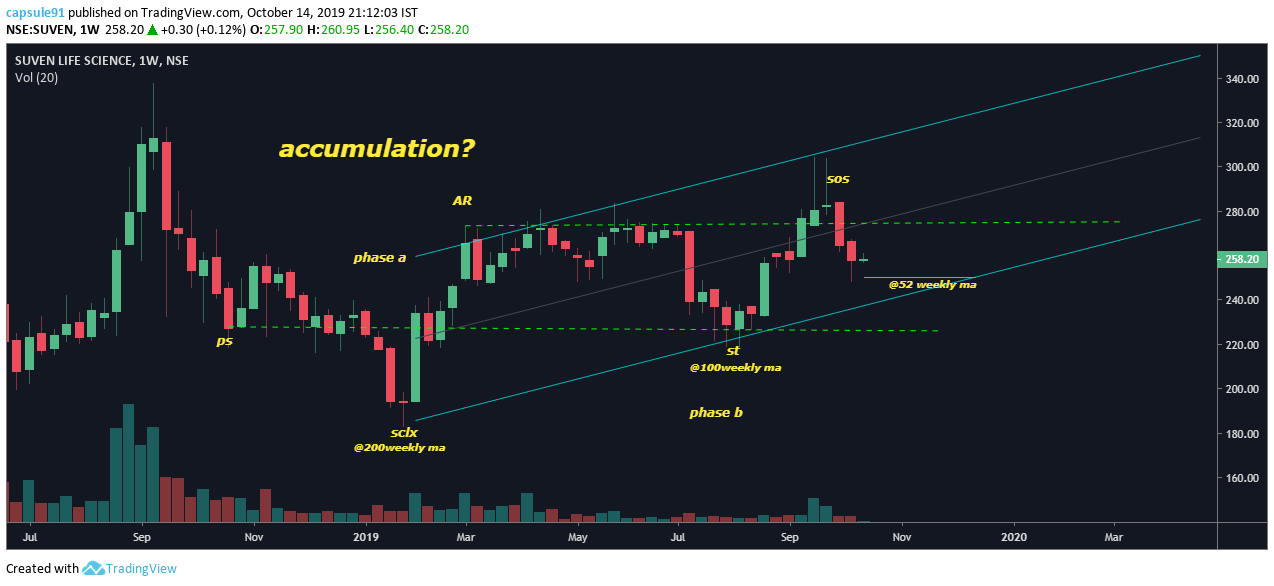
october is here and suven definitely needs a track…
after the climactic stopping action last year in mid 300 levels, the price action has followed an extended fall , after which , key moving averages in the weekly chart has been tested, a selling climax at the 200weekly moving average, followed by a secondary test at the 100weekly moving avergae, leading to a good rally stopped at the high of the Automatic reaction[AR] , essentially showing a sign of strength and a uptrending channel has formed, presently face off with the 50 weekly moving average is coming, also at the channel demand line
it is difficult to say with conviction if this is an accumulation unless phase c unfolds and also the outcome of the suven 502 trial results this month, but the progress technically as mentioned so far, is definitely a positive build up…
the volumes remain low throughout the uptrending trading range…
any close above 275 and subsequent retest of that level, thereby formation of a last point of support , would be considered a positive outcome , technically for this scrip…
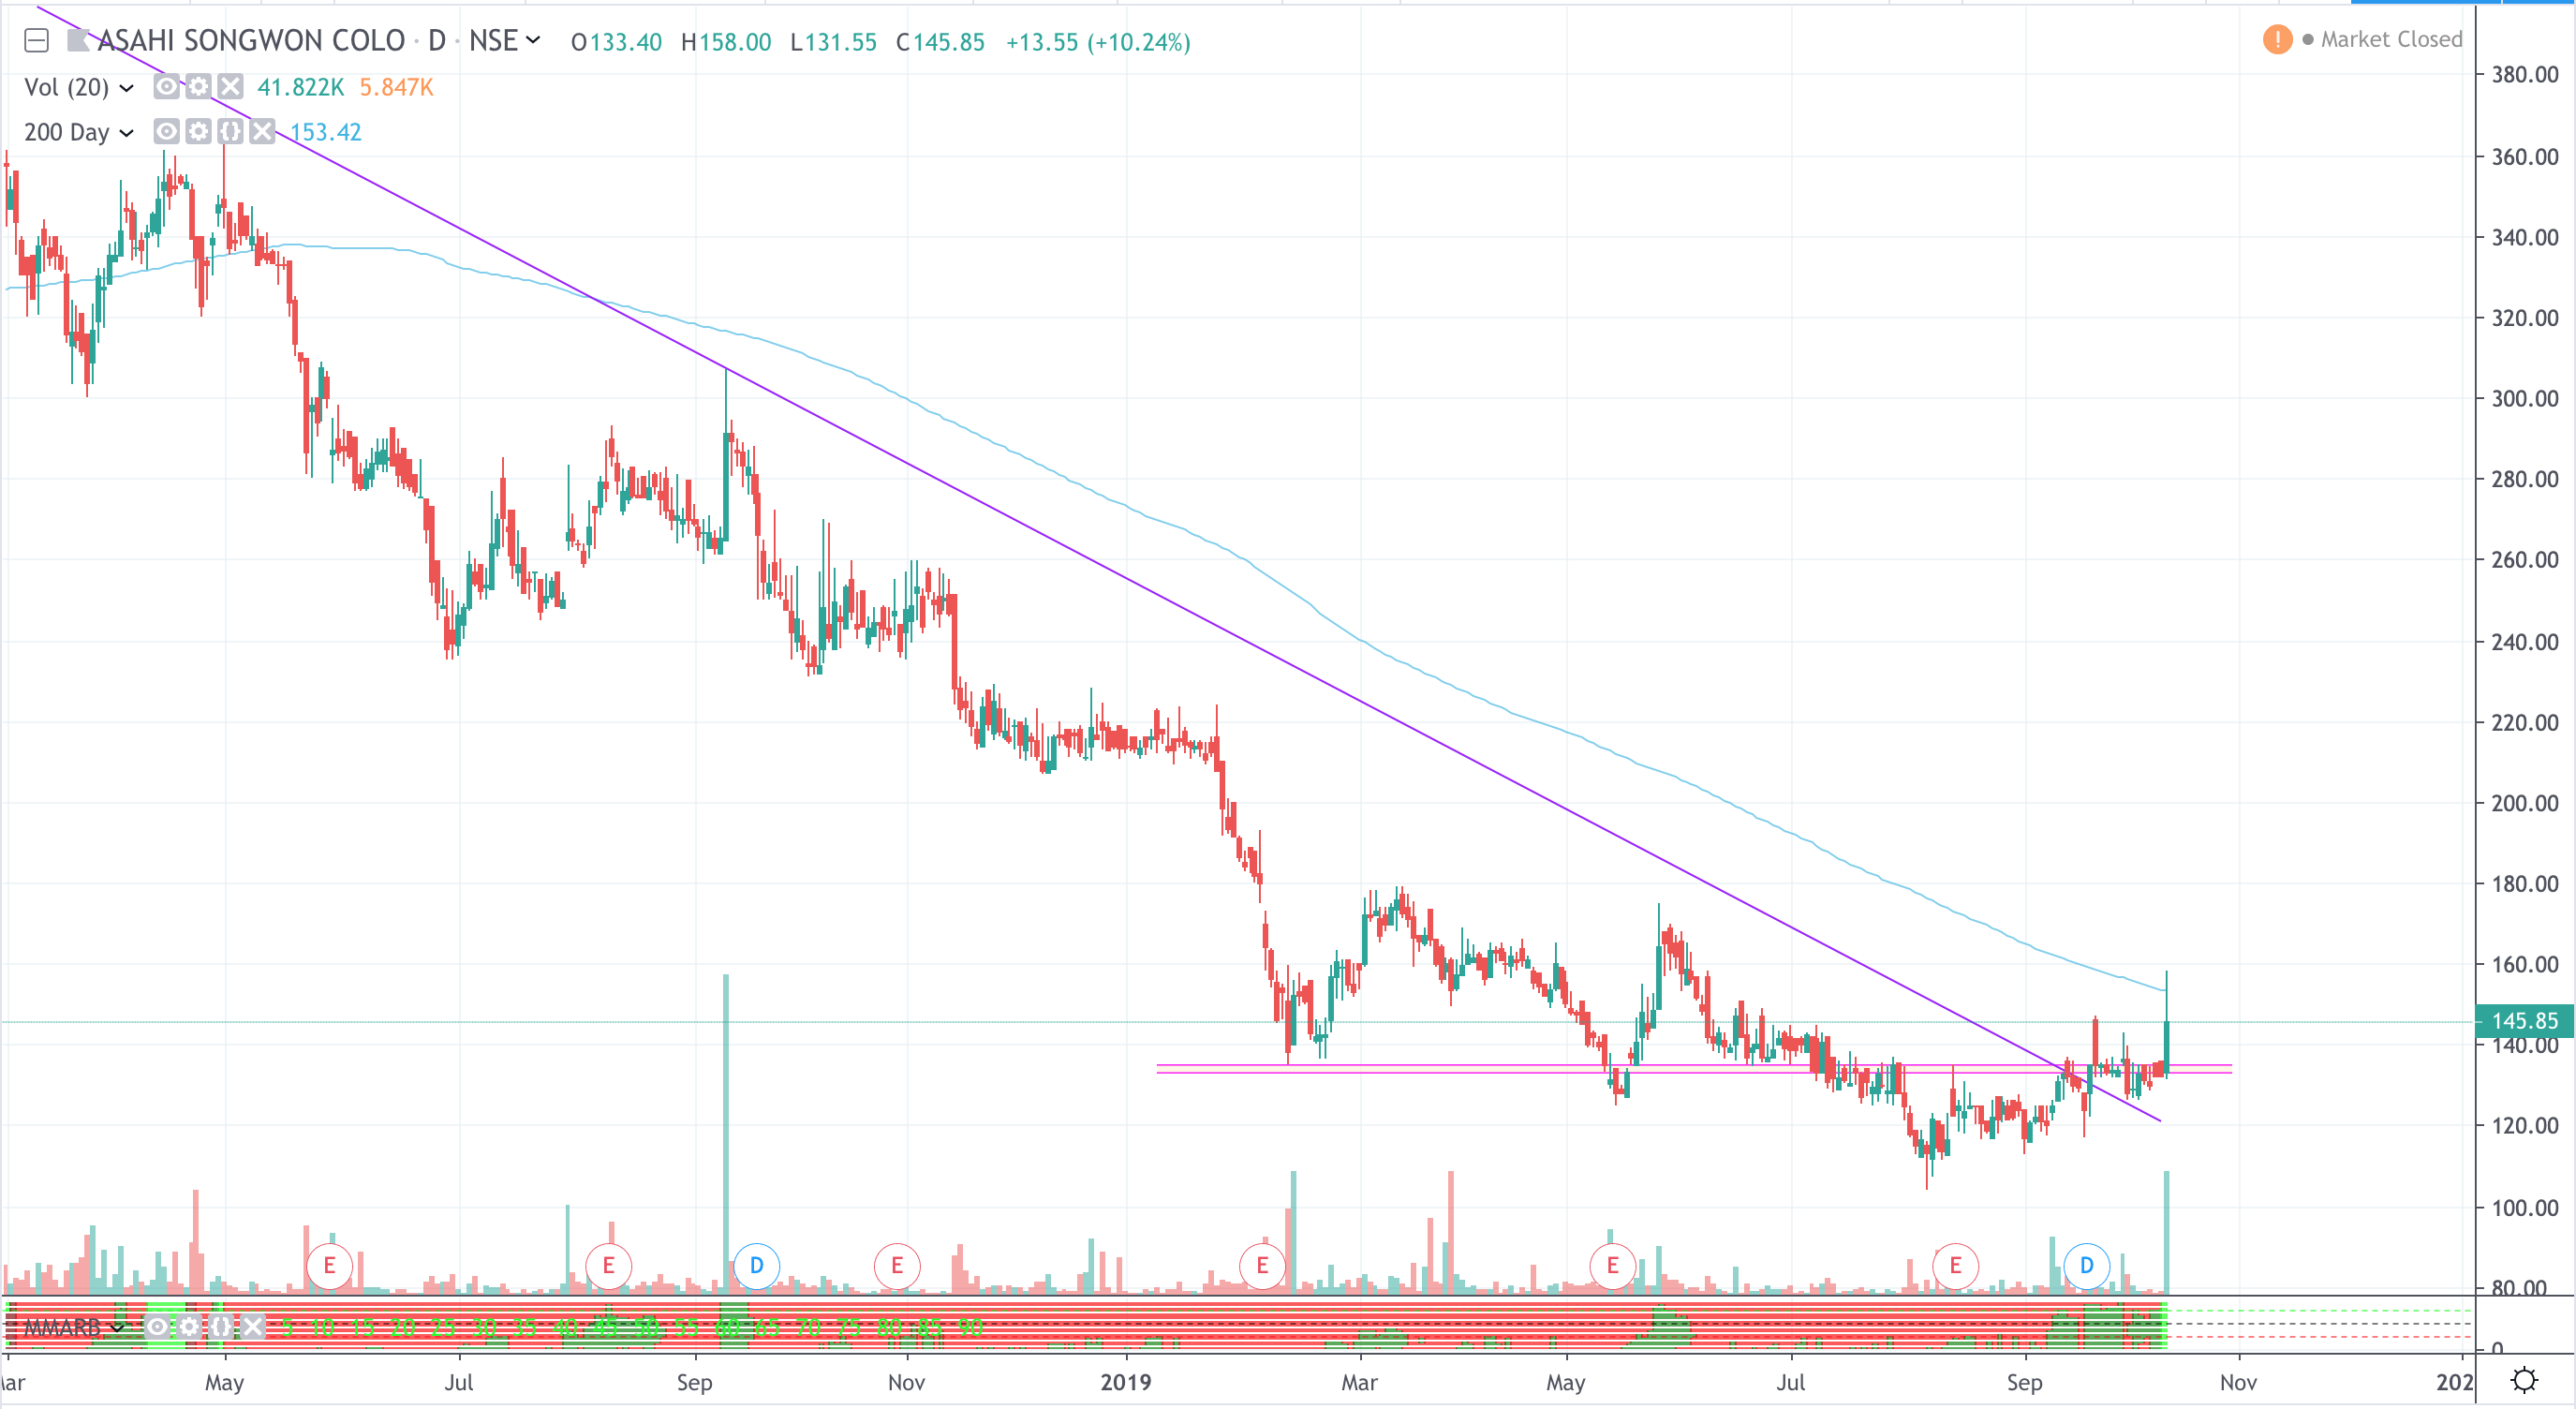
Asahi Songwon posted good results (mostly due to tax cut), tried breaking 200DMA, but gave up along with the broader market in the last hour session. Worth tracking as the trend appears to be changing (ref: MMAR).
among the power stocks mentioned, adani green had a superb accumulation structure and is presently in markup [its btter for it to cool down into trading range before any investment plan],
second to that, torrent power seems to be getting accumulated and is presently doing phase d of reaccumualtion, forming the last point of support, very positive structure for me…
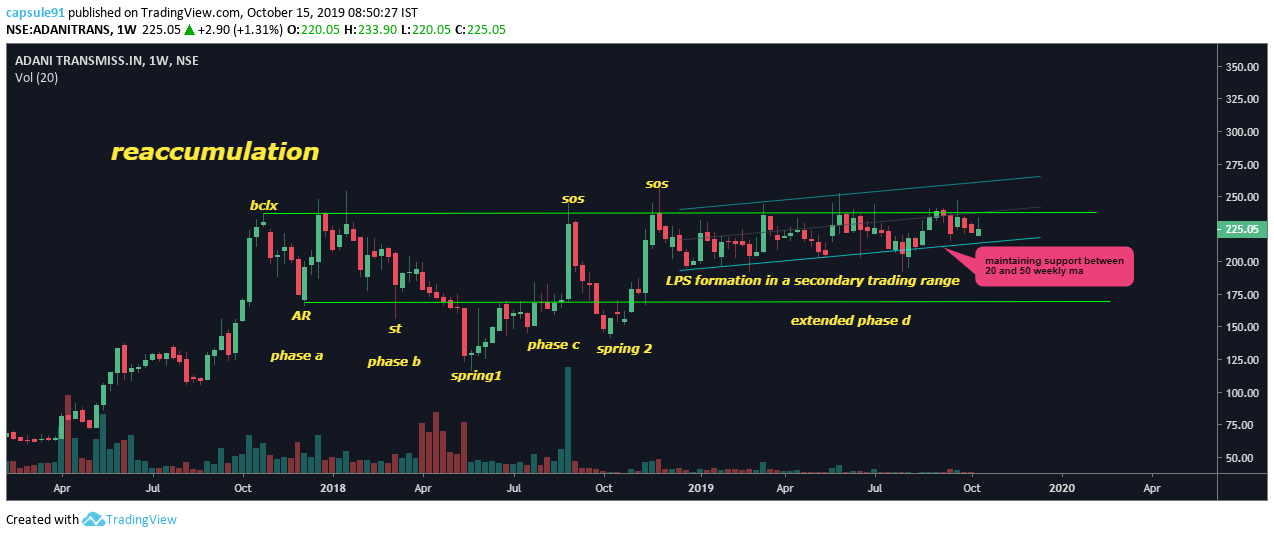
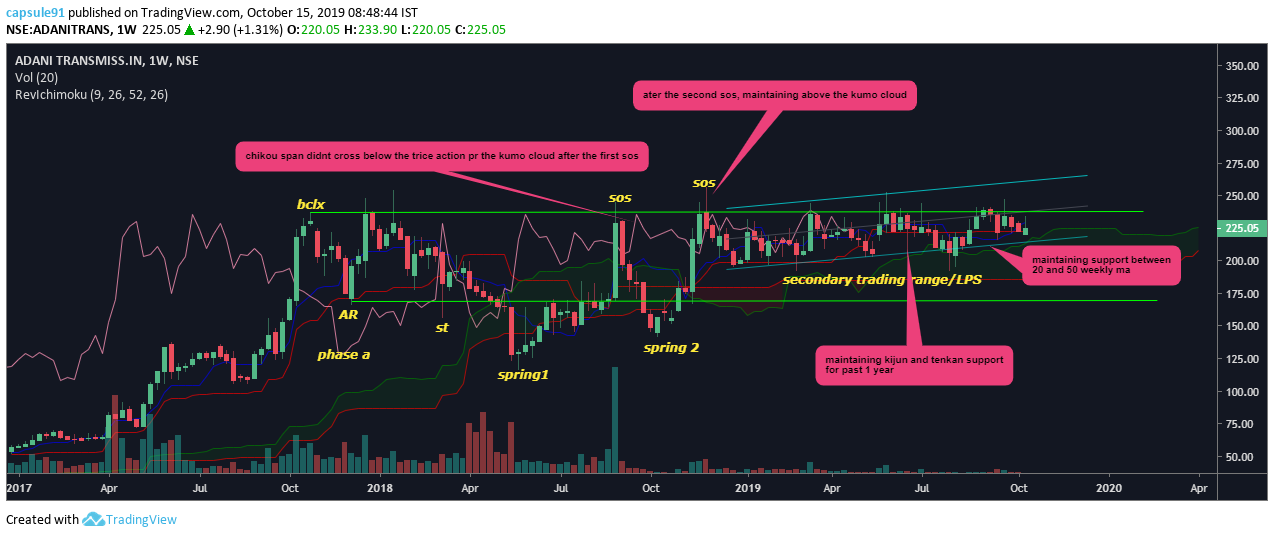
lastly, adani transmission, very volatile chart, and one of the toughest trading range to classify, yet a very good structure with definitely evidence of accumulation…
a recheck with ichikomu system, depics a similar strong picture of the price action…
a break out of the buying climax high in post oct 2017, would be the key …
long time mani, hope u are doing well…
disclaimer… invested in torrent power and adding in sip
tracking adani transmission closely
holding adani green from accumulation base
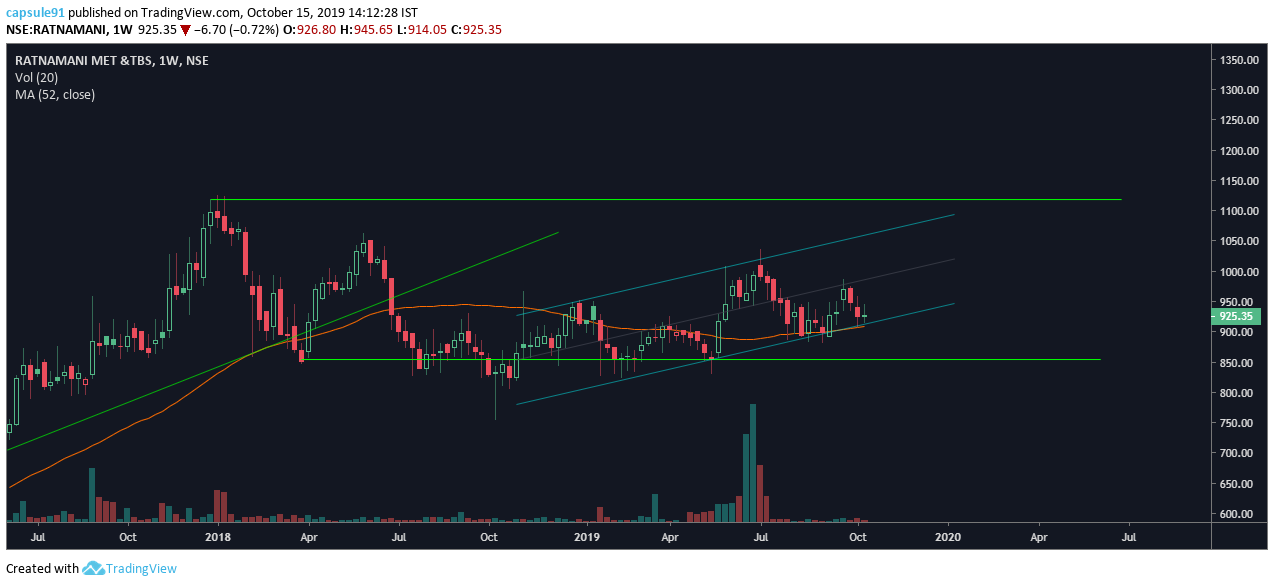
multiple tests on 850, all successful and recently post q uptick in volumes , and then taking support form 52weekly ma which was a resistance before and also forming an uptrend channel at the base of this trading range…
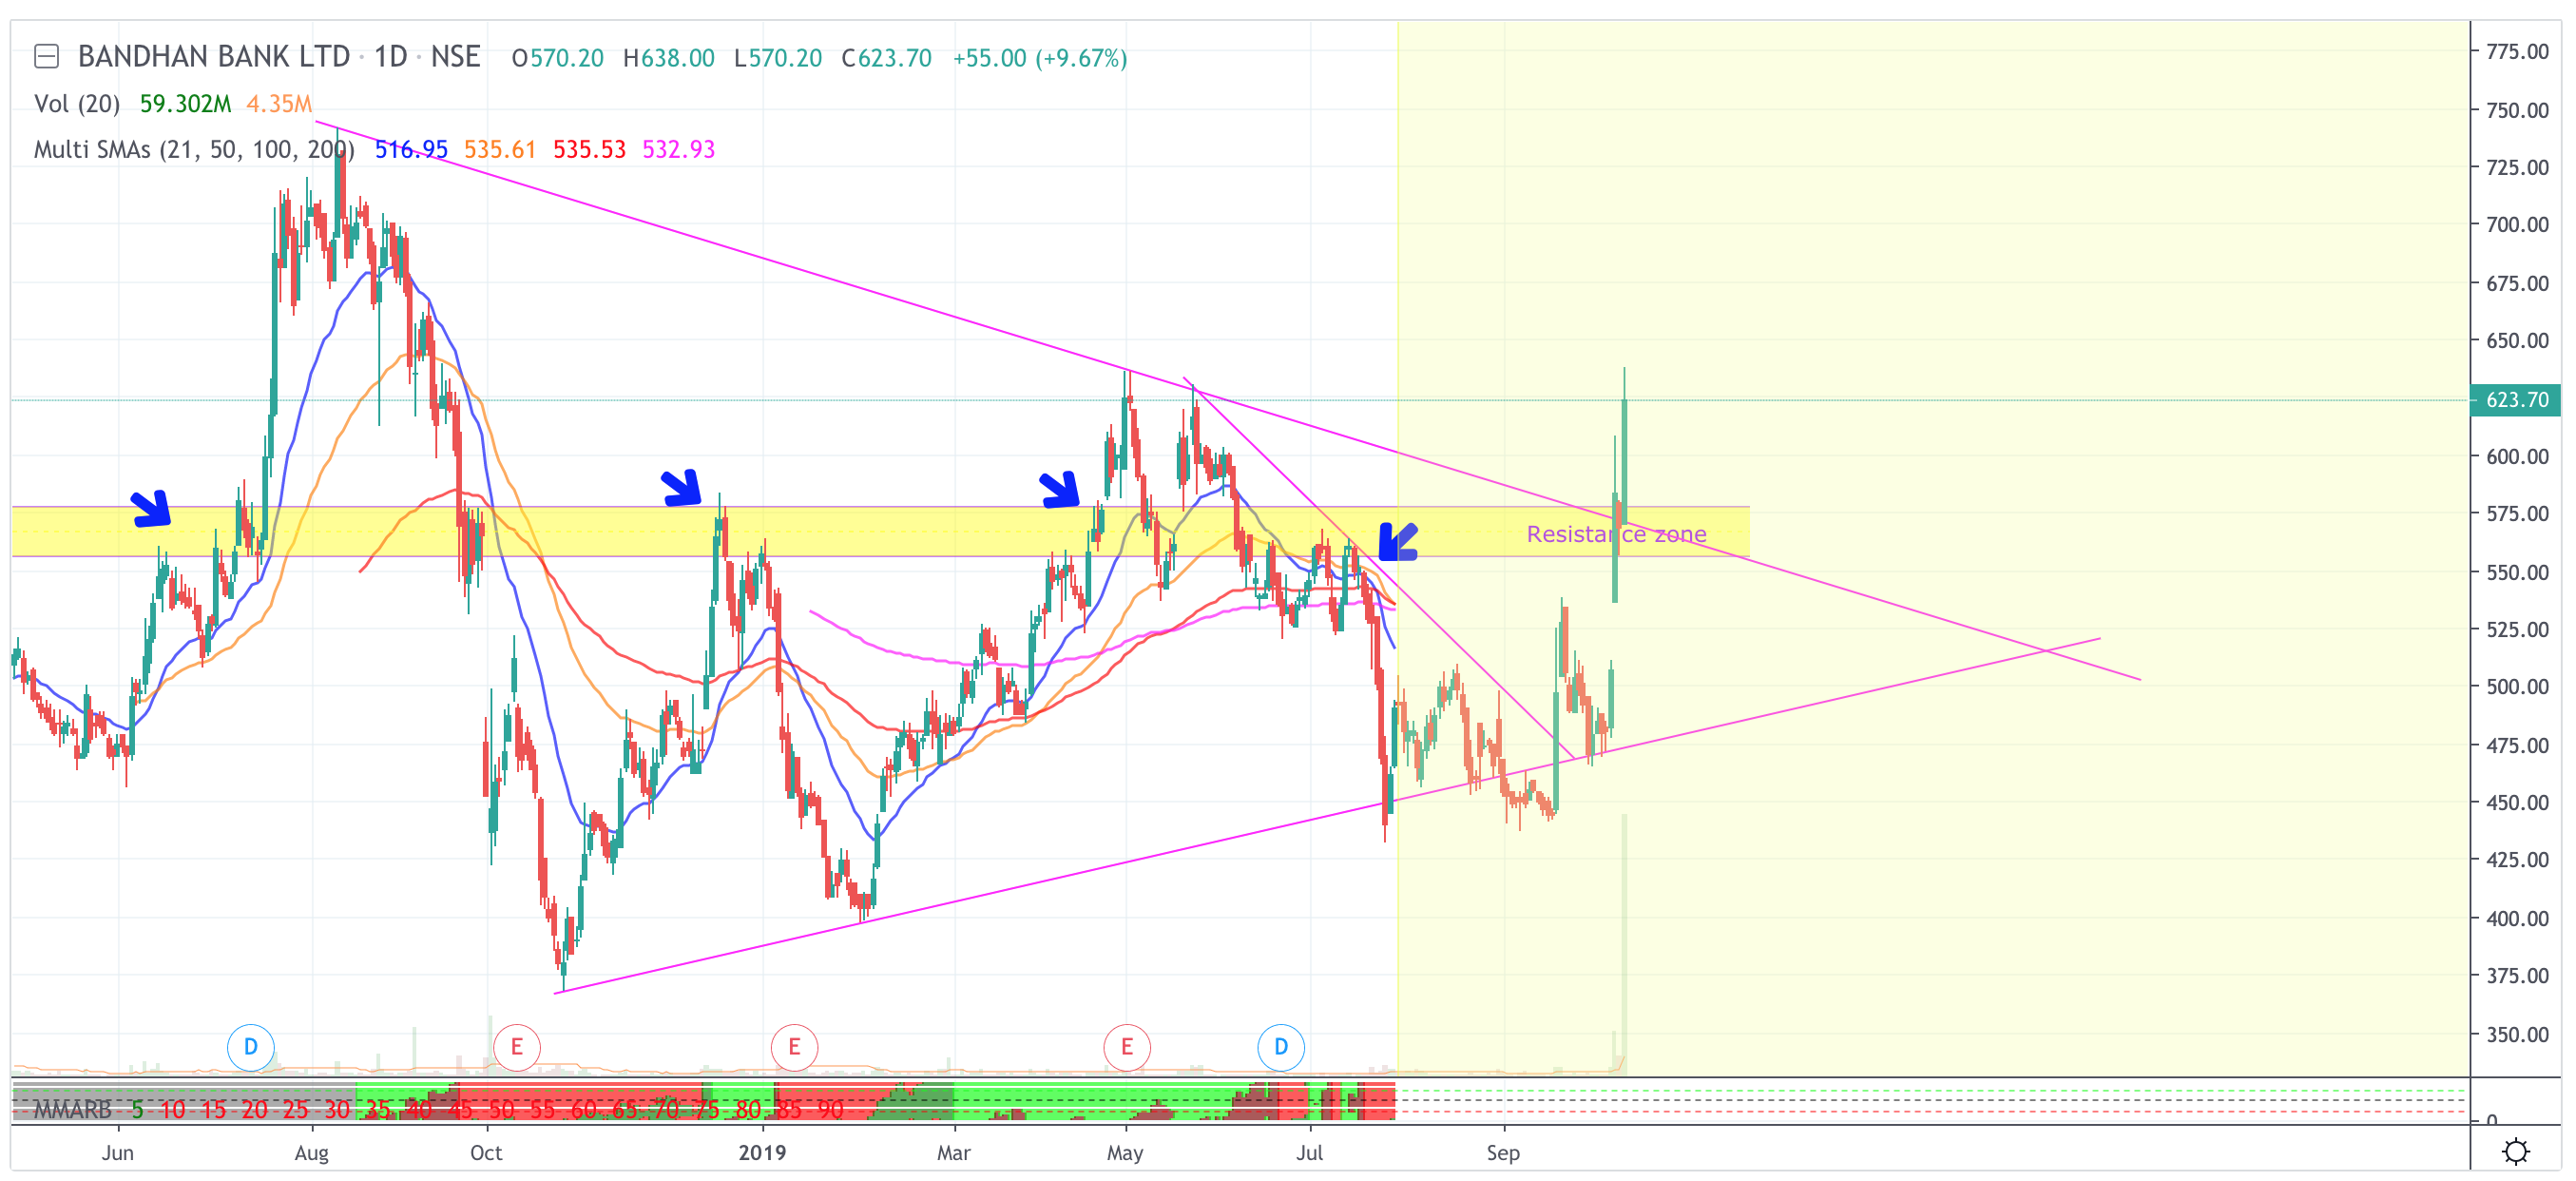
Bandhan Bank breaks out the resistance zone decisively, but hits another resistances at 630s. Tomorrow is merger, some may take the profits off the table. Can consolidate a bit before moving further.
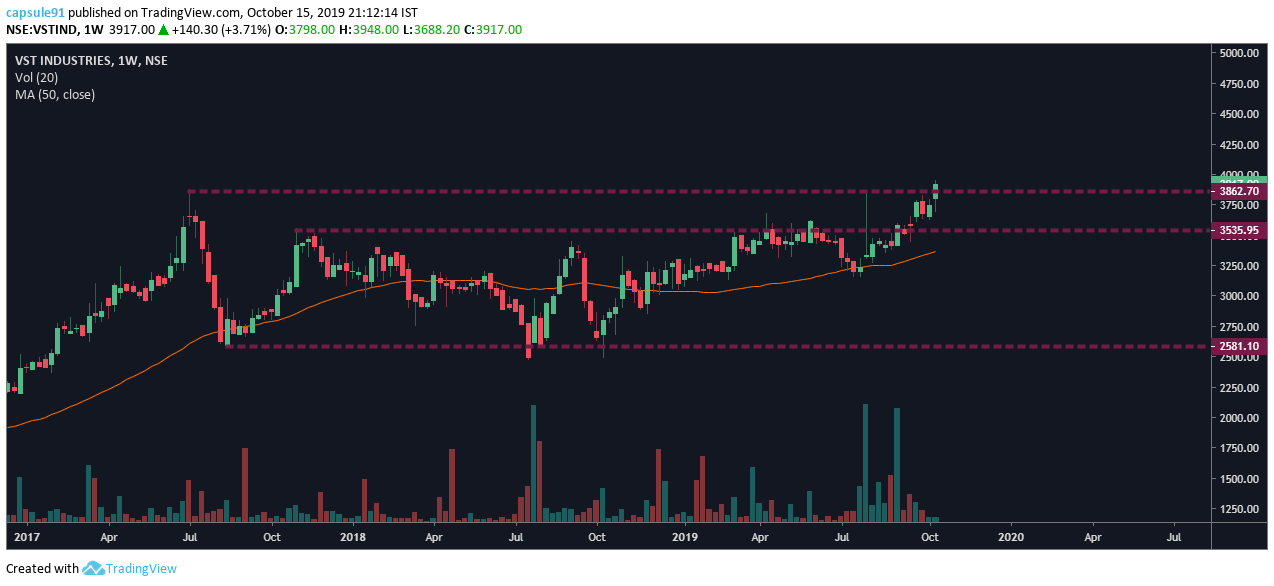
formed a LPS in august , broke out of the lower resistance, supported by both the 50 weekly ma and the 200dma, finally retesting the buying climax of 2017…
very positive action in phase d of reaccumulation, should come down to retest 3500 odd levels…