Lupin
continuation post
excellent back up action forming the last point of suppoirt at trenline…
volume candle chart
disclaimer… trading position initiated at LPS
Lupin
continuation post
excellent back up action forming the last point of suppoirt at trenline…
volume candle chart
Hi @Capsule91,
I went through the entire thread.
I’ve very recently got curious about technical analysis, all the while from last 16 years, focussing only on fundamental analysis.
it is very interesting to know that you are applying both Fundamental and technical aspects in buy/sell decisions,
I’m holding Edelweiss since around 2 years, I’m seeing that it is attempting to breakout on the analysis on MACD, STOCH and RSI weekly charts.
Can you please give your views on Edelweiss?
well, your timing of the comment cannot be better imo…
i think we are at the conclusion of the accumulation, and a closing above 317 should be watched , as it might start a significant rally…
volume candle chart…
couldnt find any post of mine on endurance…
i guess i missed posting it…
markup started in this wyckoff reacc…
disclaimer… trading positions initiated mid june
Another breakout happened today in torrent pharma…
continuation post…
its not yet out of the trading range so should back up and form a LPS before markup
disclaimer… forms 7percent of my holdings
axis bank…
confirms change of character today…
disclaimer… no positions as yet, tracking
YES BANK…
feels like ready for markup
res ipsa loquitur
How is Suven looking on charts?
VIRINCHI-
a young reaccumulation
presently secondary tests are being done in phase b
with repeated selling climax n buying climax within th edowntrend channel
but there is evidence of supply absorption as mentioned
i think the composite group will retest the supply level in sub 90 region once more, coz that makes a lot of sense since the supply volumes on that selling climax was not bad…
so a lot of sellers were there , and lower volume retest there will confirm a exhaustion of selling pressure and then a buying spree from the operators would start…
lets see how it goes…
personally i dont like the stock movement as much i like the fundamentals here, historically, with each rally the correction was pretty deep almost 50% of it , if not even more on an average , for example in the weekly chart…
disclaimer… no positions
correction in the chart…
“decline in supply force”
PERSISTENT SYSTEMS-
case of wyckoff accumulation with a pinch of salt for now
personally, without a clear breakout , i will not be risking entry into this setup…
disclaimer… no positions
Can u share d chart for Suven plz? Thnks
Motilal Oswal seems to be poised for good bounce. Technically lot of bullish signal (RSI, Ichimoku, Elliott wave), if the fundamentals supports, expect the fireworks.
Disclosure: No holdings, watching closely. Not a buy recommend pls do your own due diligence.
My attempt to answer your question. Suven is in accumulation phase after an elliott super corrective wave. The chart shows bullish signal for sure, in any method. So overall is poised for breakout, but depends on market situation + fundamental improvements.
Elliott wave:
Ichimoku system:
The resistance level of 160-180 seems to be the rock bottom. If it goes below that would be v.bearish. If the 240 level is broken, then it’ll be out of the accumulation phase and the bulls will be back in action.
@Capsule91 pls correct me if wrong.
Thanks…tht ws helpful
hi anuj…
excuse the late reply…
as @manivannan.g mentions his analysis , i have nothing more to add to that…
suven is one of the scrips i am very interested in technically for this bull run and i have mentioned about it earlier
Bull therapy 101-thread for technical analysis with the fundamentals - #375 by Capsule91
the accumulation is complete, supply absorbed, the problem the stock is facing for the last couple of months is that the composite group is unable to launch a adequate bull market campaign, and the markup is not happening and the resistance is being faced repeatedly, so i dissected the market a bit here’
the numbers are the total volumes transacted within each swing
so looking at the trend, the demand look still in control, the 14.2 million volume driven swing failed to break out and got converted into upthrust, the downswing from that upthrust was on save volume as the previous downswing when the rally started 5.7 million shares…
similar pattern if u look at the upswing volumes
so there is no drastic selling forces thats coming in the system…
ans also the decline swings seem to go in a pattern… 5.6m to 0.8m to 1.7m on the first series…
then again post upthrust… 5.7m to 1.3m to 1.8m
whats coming is interesting…
one may say this is an ascending triangle forming… and the net volume is inflow and building up more accumulation in the strong hands…
so might remain rangebound for some time, and this is good rangebound market in a persisting uptrend channel…
[what i am watching with caution, is a downswing of any length in y axis, with heavy volumes, if that happens, the theory changes and there might have been distribution, which is unlikely, but still a possibility, (else what are stops for?)]
i am bullish here, accumulating each dips…
earnings, should be the time to watch for a breakout…
goodluck
Tracking Coromandel…
company posted good q1 earnings…
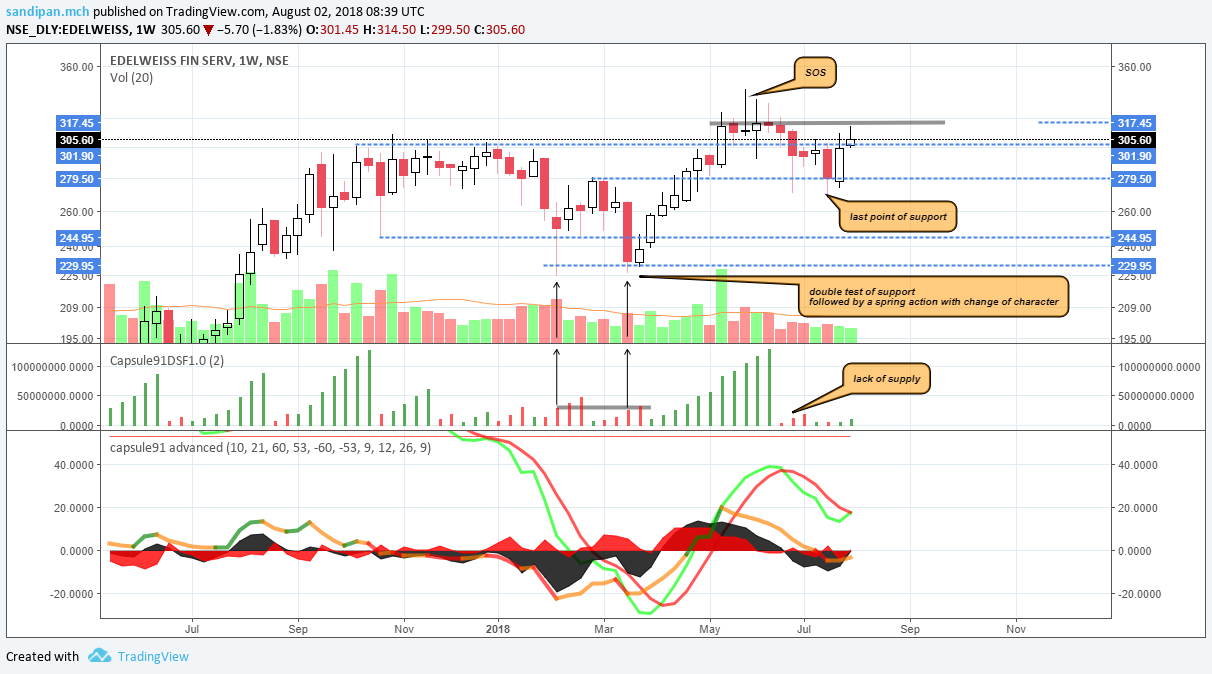
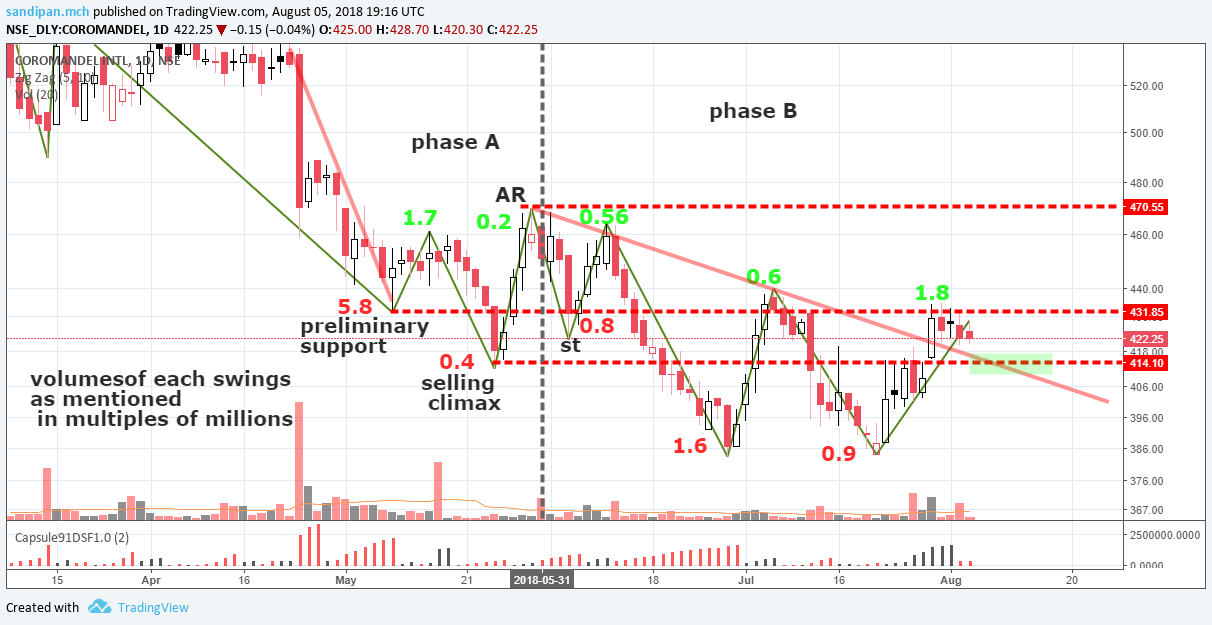
A formation is on the way, hard to tell from this if this is accumulation or redistribution , at least now…
what ever it is, we are in phase b…
the volume of the swing which led to the prelim support was massive 5.4million
buying started there with 1.7m shares, such a volume of buying was seen again in th ecurrent rally with 1.8million shares … mean while after the pre support, the selling climax happened in ridiculously low volumes , why i still call it a climax is there was stark change in character in the price action and a good upswing occurred on just 2lakh share transaction… which means, the sellers didnt show up and the price moved on the ask of the buyers… sp essentially here the conclusion… the downtrend ends…
now the game of wyckoffians starts…
a huge shakeout with impressive volumes of 1.6million share transaction …
i am quite sure this is the operators manipulating and scaring the retail and making them sell…
specially because, the next upswing was damn clean with low volumes… again sellers dont show up on this upswing…
hint of smart money accumulating the shares from the retail…
then another shake out done, on half the volume of the previous shakeout…
but this time… the upswing, has a different character, slow, slurred and spectacular volumes…
some one is selling again, specially in the mid of the rally…
post shakeout , the sellers are always the manipulators…
[shakeout stands for shakeout of the weak hands ie the retail ]
which to me, seem like they are testing supply levels already within the uptrend
reduces the possibility of another forced shakeout…
and more so because the its clear that the first sell off on 1.6m n the second is 0.9m, so definitely with that action, they have already taken the shares form the retail hands…
so now, to me looks like the need for phase C is less…
as enough of retail scaring has been done in phase b itself, and we sud be moving on to phase d where the last point of support is to form…
the 414 region is what i am watching…
anyways, lets see, how the market unfolds now…
disclaimer… planning to make entry if the price action validates a phase d…
@Capsule91 What sort of target do you see in JK Paper? No immediate plans to sell but what about long term targets?
Discl. Holding from lower levels since couple of years.