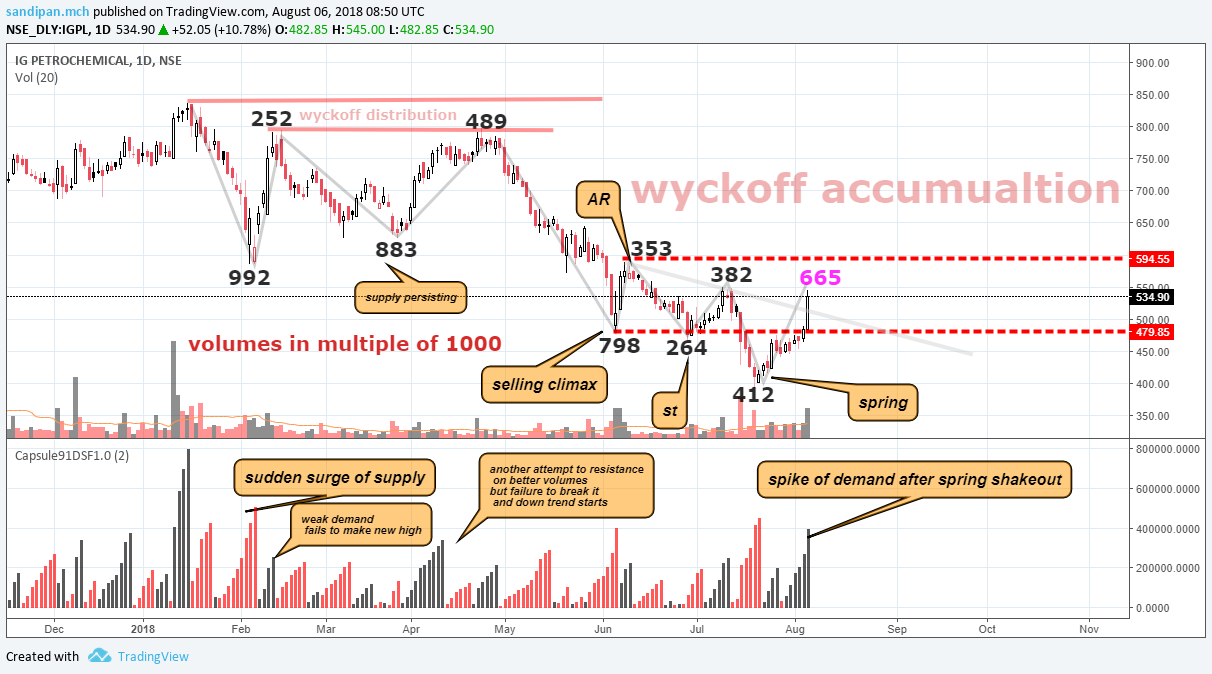
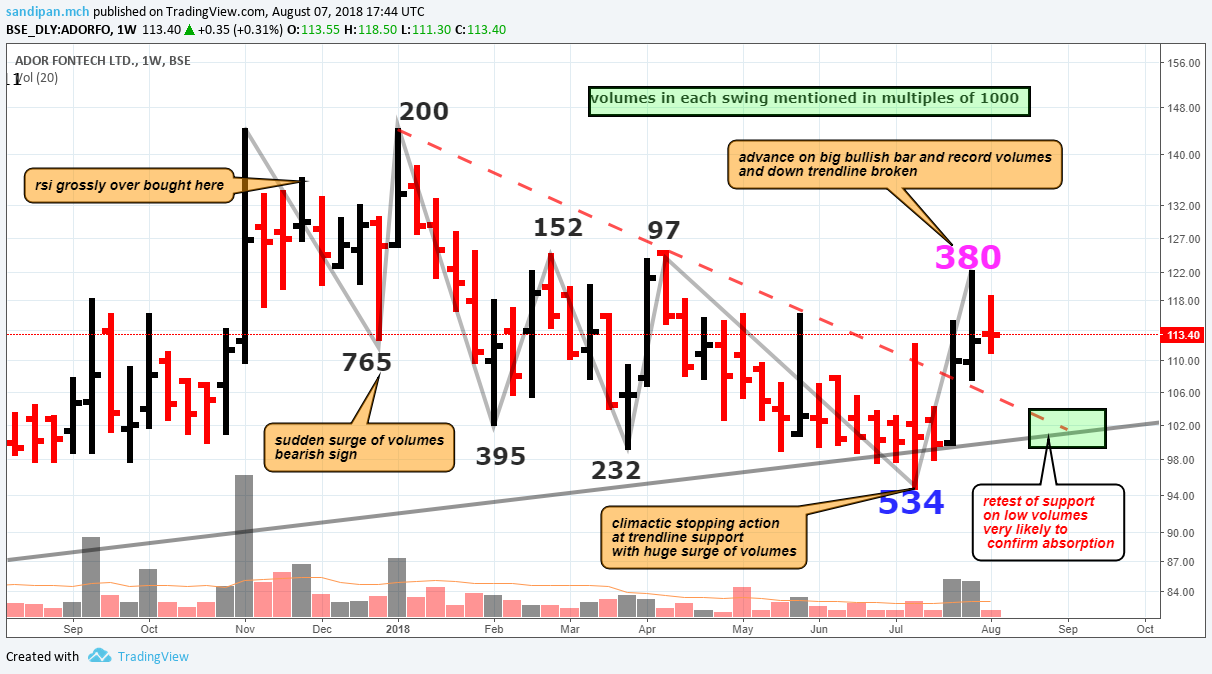
it is very evident that 665 thousand shares transaction and counting, on this rally after the shakeout, is the upswing with the biggest volumes in 2018…
and it breaks the down trend line of the schematics…
mean while the selling pressure has eased, had increased in shakeout, but thats expected and artificial…
there must be some kind of correction recently, and the selling pressure there will be the key to determine if the LPS[last point of support] formation is happening or not…
disclaimer… not invested, will take positional trade at LPS and BU
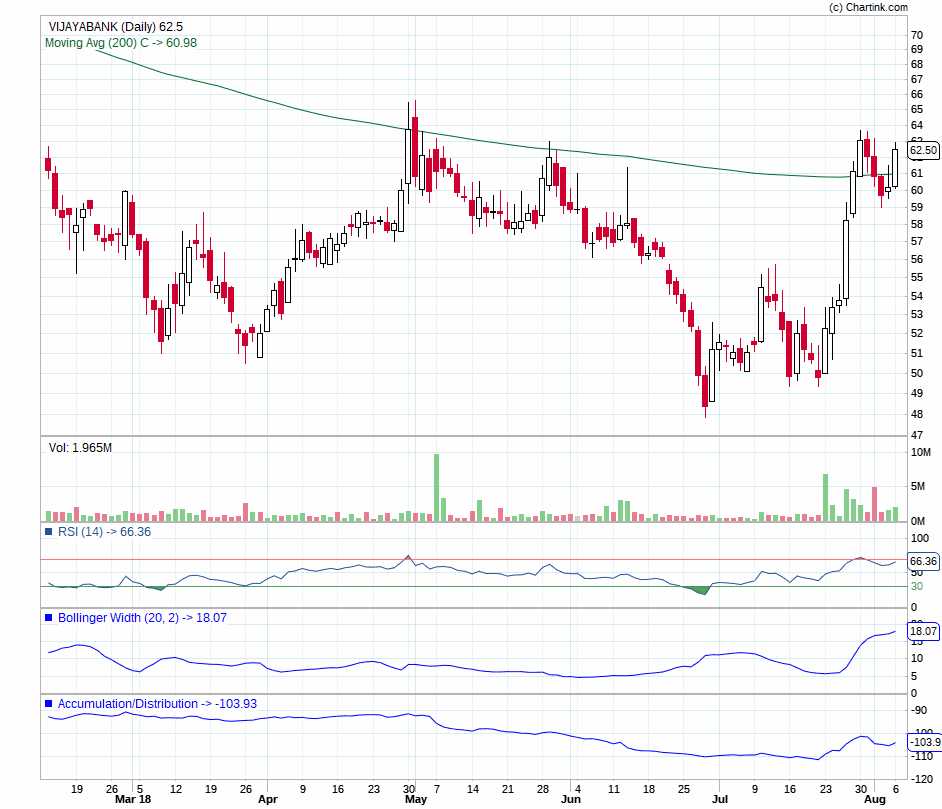
Okay I get the point that no bull wants to touch PSU banks but please do have a look at the chart of Vijaya Bank. Is it showing signs of long term trend reversal or just a false breakout? Delivery has been good and after dipping below 200 DMA yesterday, it again closed above it.
@devaki.tripathy very nice observation…
clearly the action climbed up the moving average , backed up and tested supply, and then continued with the trend… this behaviour is itself bullish, specially today’s candle was a nice marubozu with minimum upwick, demand was definitely in control…
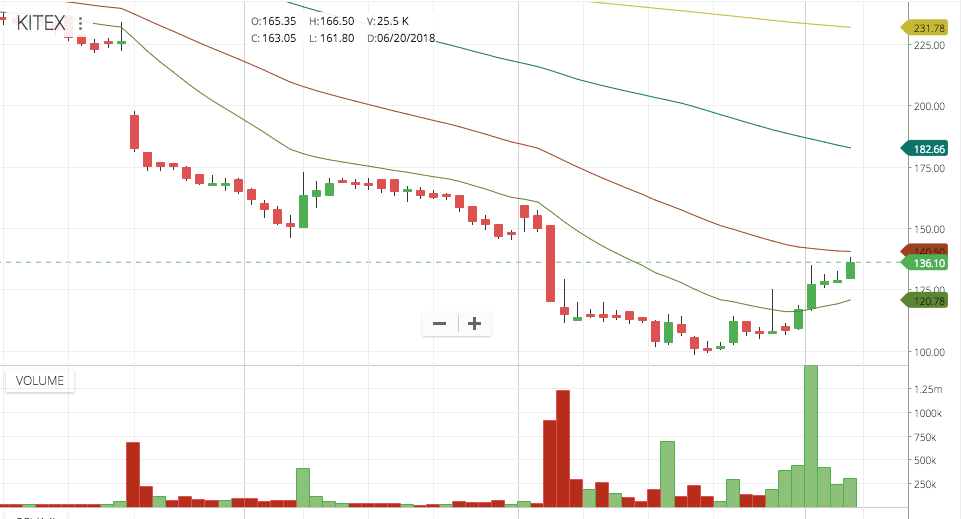
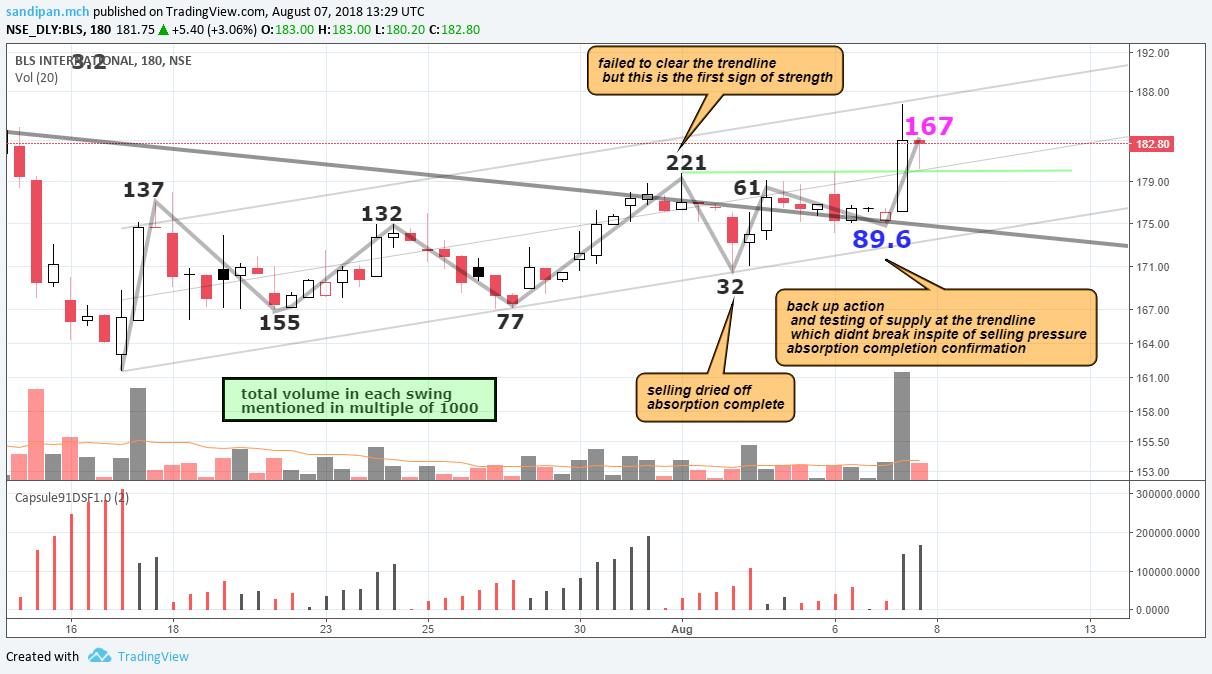
there is a downtrend channel we see, and the rallies repeatedly failing to even test the prior highs…
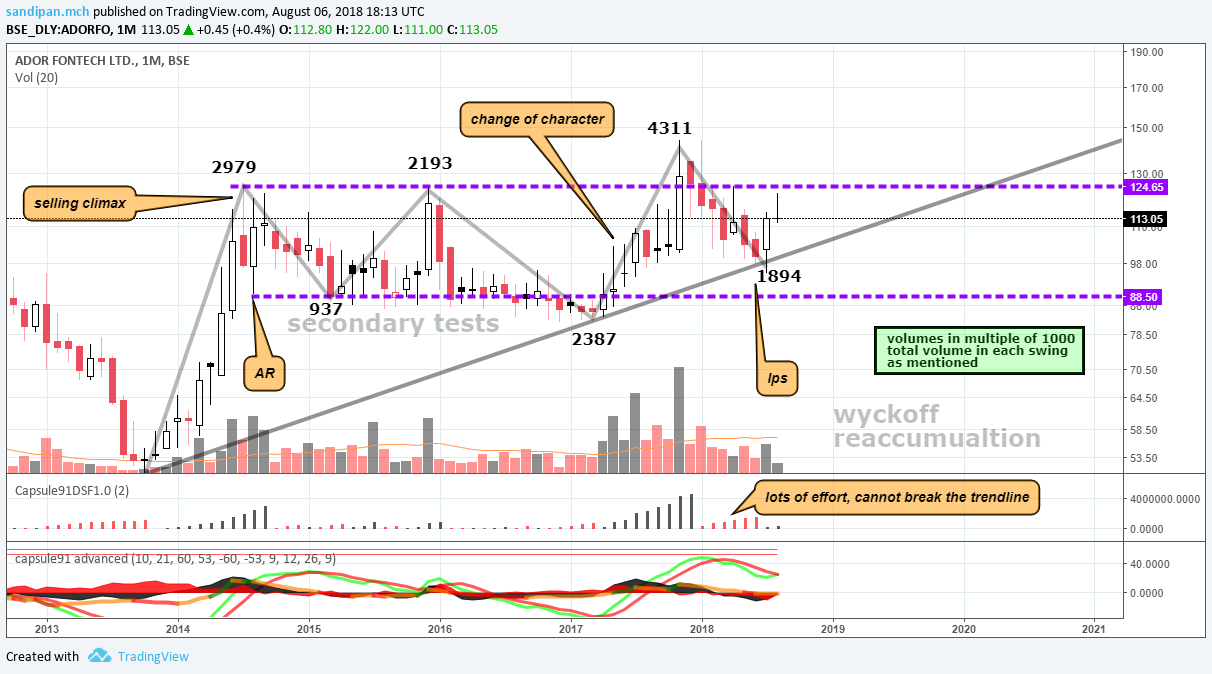
3 things here…
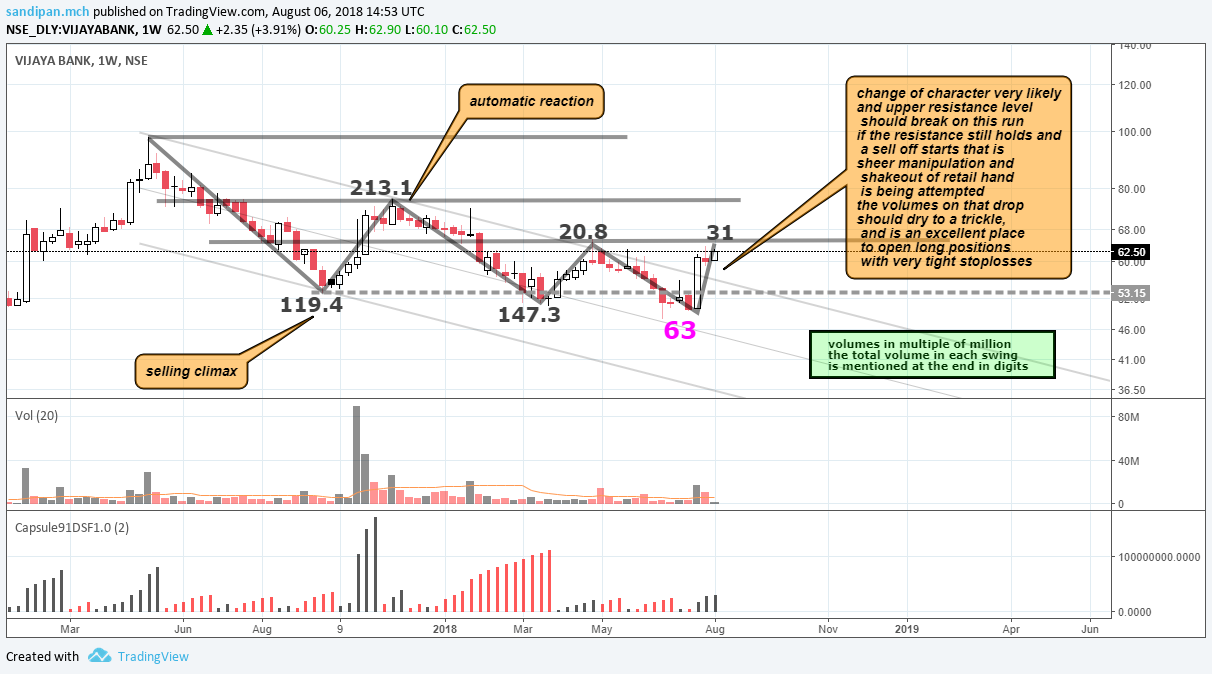
there was a selling climax which was followed by a rally, on good volumes and a change of character
what happened next was another decline on even higher volumes of 147.3 million shares compared to 119 million ont he prior downswing, but the price hardly made new low below the climax… lots of effort, no result… this is the first bullish sign in the chart…
3.the next decline, was on just 63 million share transaction… at the conclusion of which a big bullish bar…
to me this looks like the supply has been absorbed/ in the process of absorption…
and a change of character on this rally, will be seen, if not, it sud go as i mentioned in the chart…
if i am to take a trade, i would watch for a change of character and then a decline and the selling pressure on that, that would form the last point of support… which is the phase d of wyckoff accumualtion schematics…
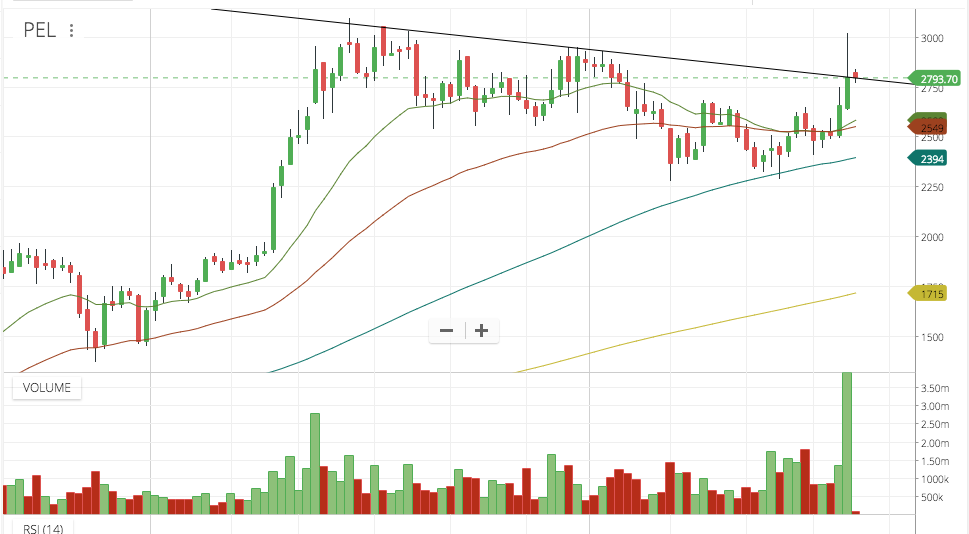
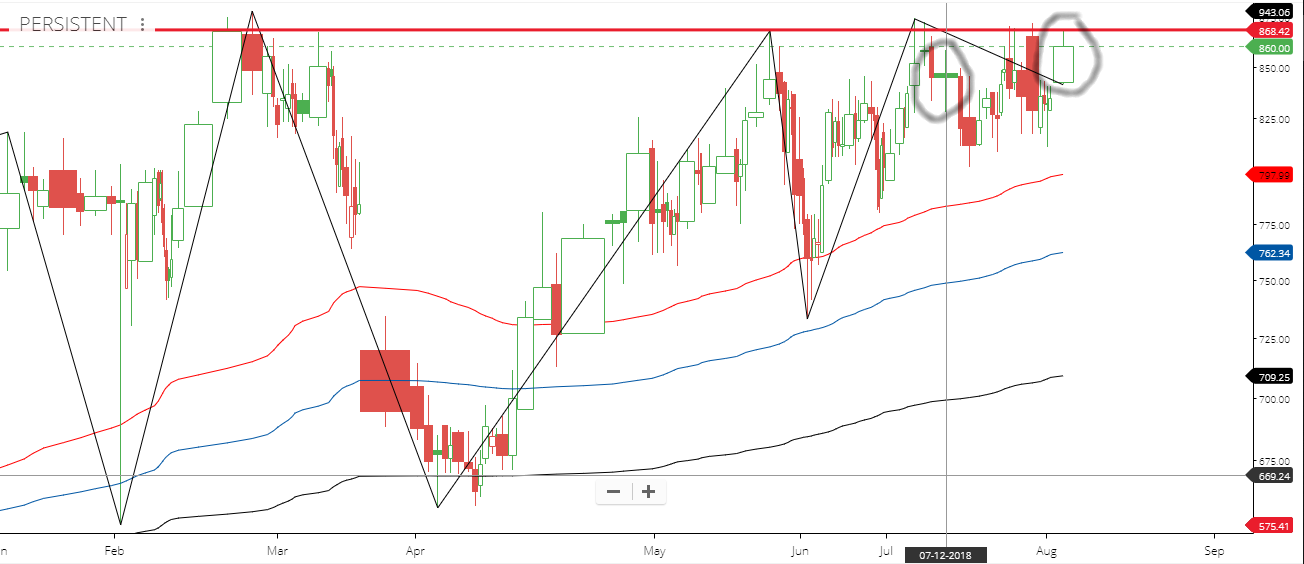
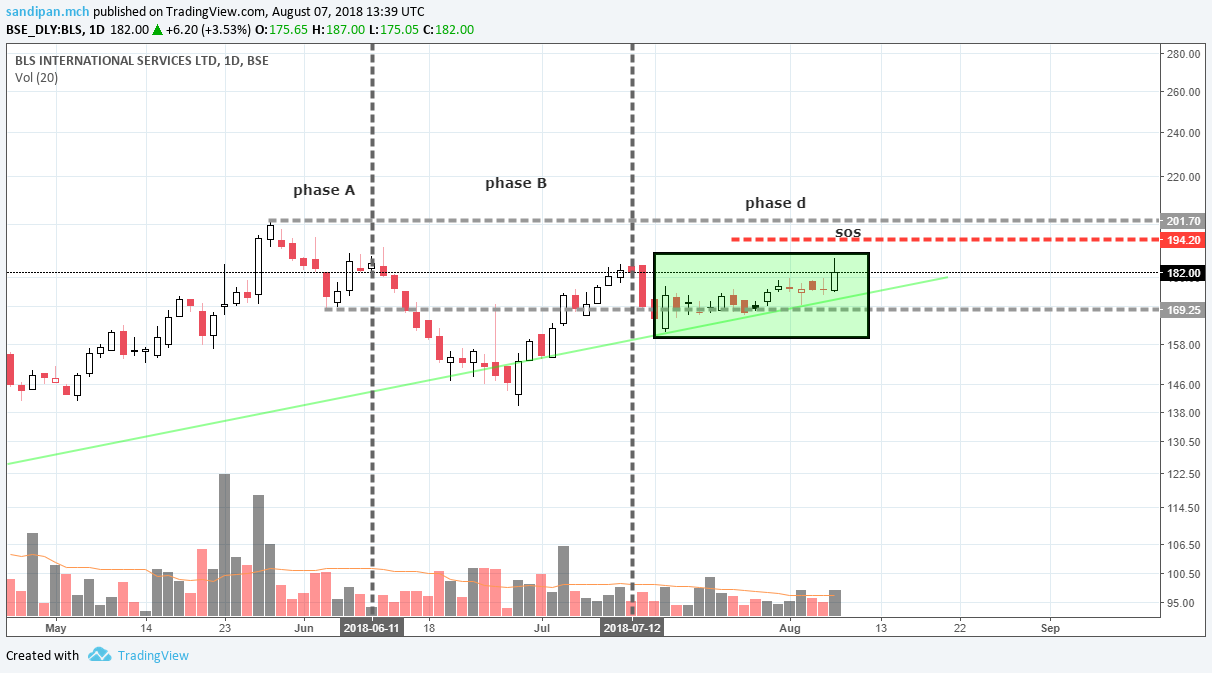
on a contra side view, huge surge in volume [4311 thousand] coudnt propel breakout of the trading range…
a clear breakout and then support taking form the resistance line of the trading range., would be the best case test of the structure that has developed…
disclaimer… invested and adding
That’s pretty much true, this is not only apply to PSU banks, also to the PSU companies . By looking at the current scenario, Hind Copper is in v.attractive valuation, but only hindrance is it’s a PSU. Because, I never dare to touch a PSU.
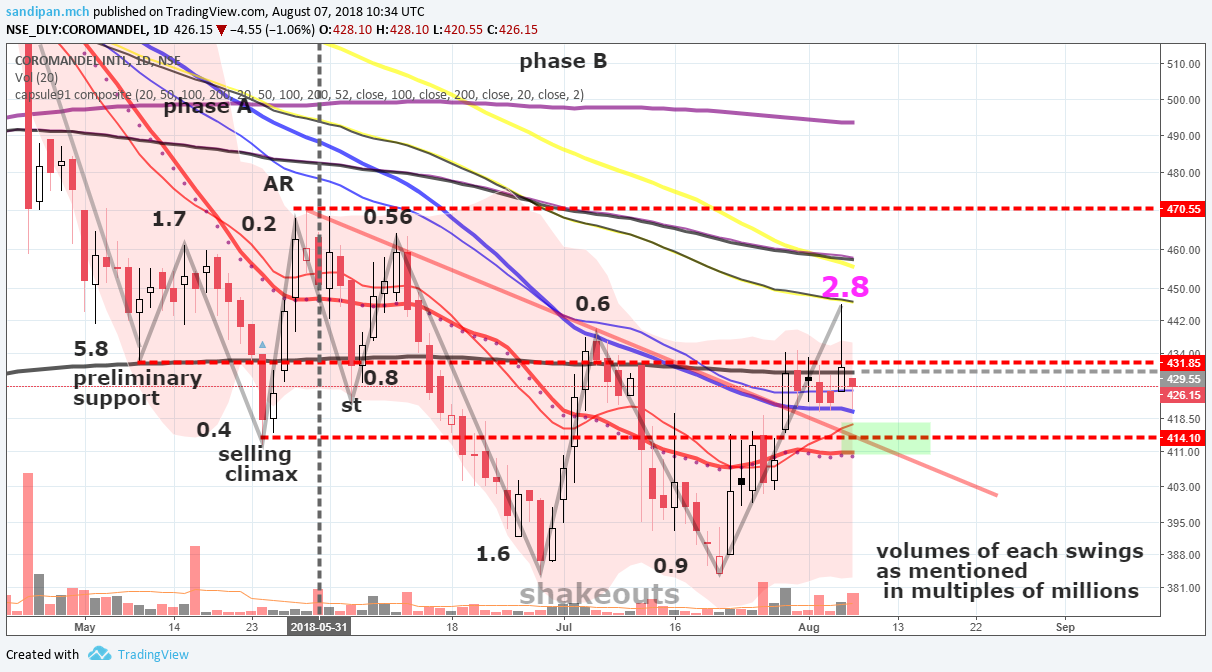
the last upswing was on massive volume surge , 2.8 million shares were transacted…
this is highest in the schematics since the prelim support which was o 5.8 million…
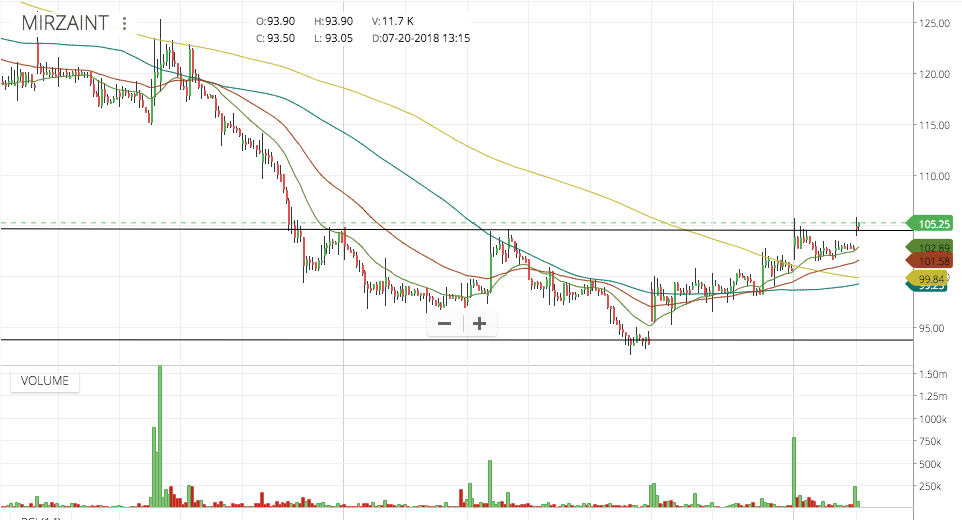
talking about levels here, the chart is a bit messy though, with all the possible moving averages and bollinger band clubbed into a single indicator , here the blue MA is are the 50 week sma nd ema, which is acting as a support, today the high volume candle was a hammer with test at 50 day sma…
to me it looks like the 50dma will agian be tested on lower volumes and since the 50dma is curving down looks like will nearly intersect with the 20ema median line of the bollinger bad[marked with dotts n red combo] and the red 20day ema, so the market green region rest, looks likely…
if the volumes on this downswing dries off, lesser than any of the shakeout volumes [1.6 and 0.9 million], this can be a last point of support [lower, generally 2 lps forms one lower and one higher in the trading range , separated by the creek, which is presently the 200day wilder moving average at 429, the line of biggest resistance]…
the schematics is still in phase b, with high probability of jump into phase d…
the lower lps formation dissected, and the bullish motives of the manipulators evident here…
the post LPS sos formation is on the way, resistance at 194 which is the 200dma and 226 from point and figure chart where the next rotation is expected
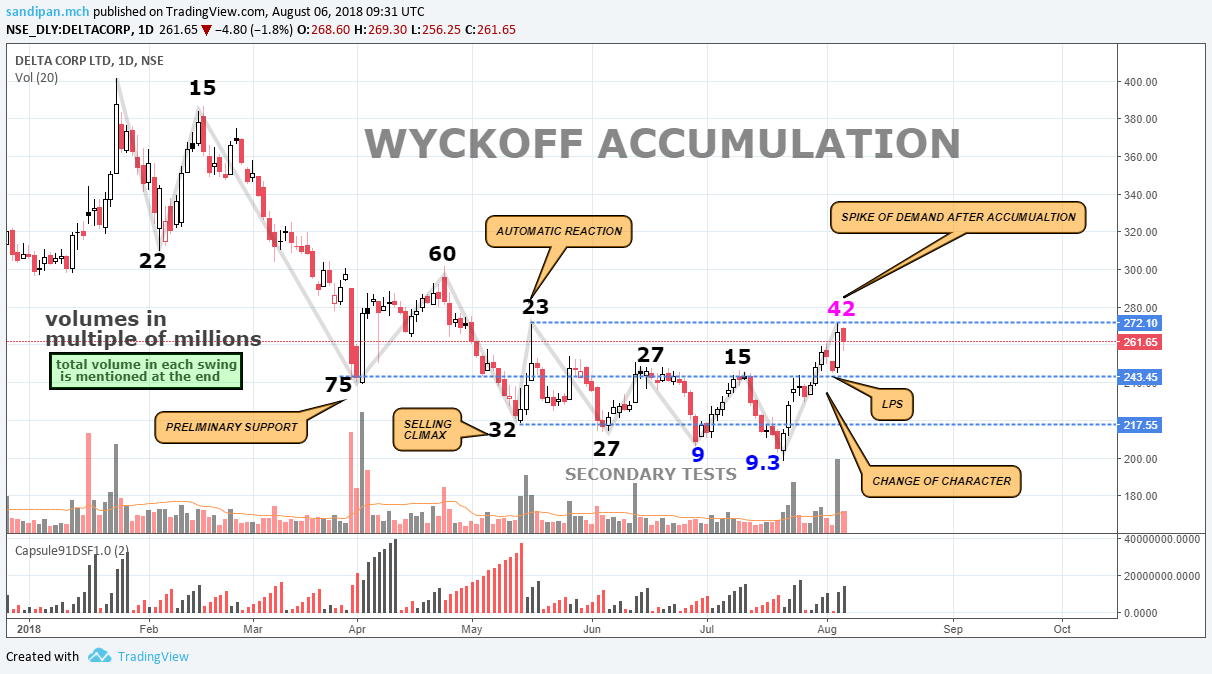
i wanted to time my addition into this scrip now, and here is the additional analysis i did taking the swing volumes…
conclusion is, there should be another retest of the supply , after the climactic huge volume stopping action, and then the bullish upmove that is expected…
what iwill be expecting is a low volume decline, when the market will be telling us, there are not much sellers left in the system and demand is about to get higher than the supply, and a markup
or the other situation is, if the 123 level is broken out, on volumes and on bullish bars, thats another confirmation, that the operators are not selling to retest the supply and are ready for markup… eitherwise we should be redy for the market to lead us
Seems you have tried to extrapolate the chart of 03-08 & with 2016 onwards but the global scenario especially economically & fundamentally are more developed now. Apart from that earlier 03-08 was mainly driven by FII whereas now the driver is MF with the help of retail ppl.
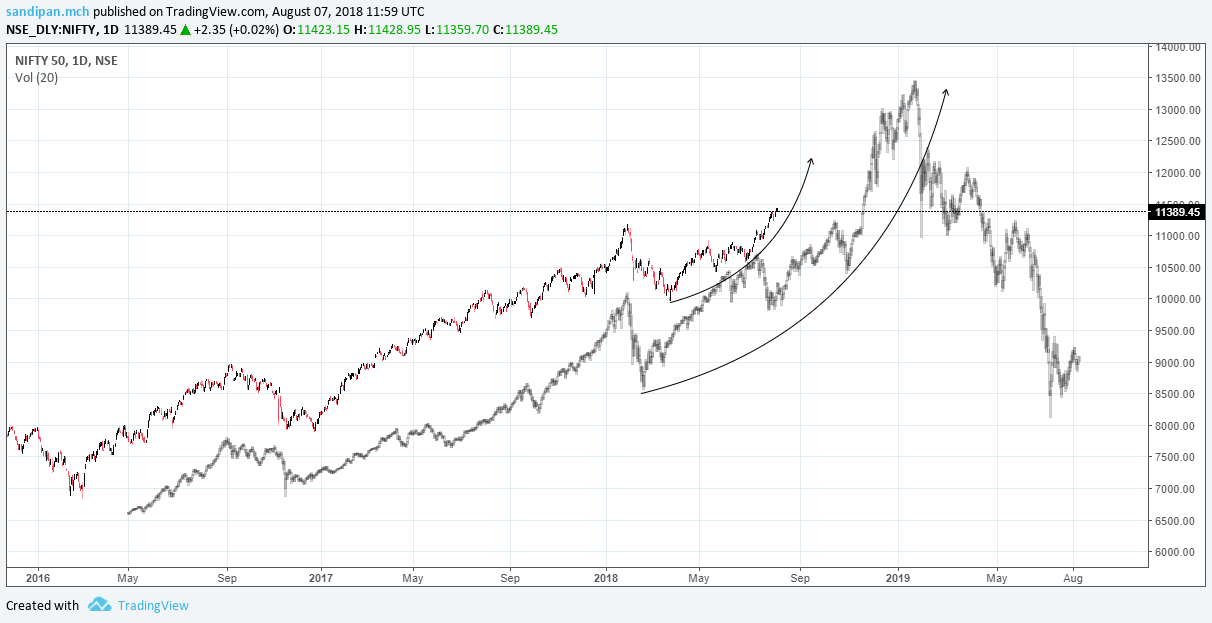
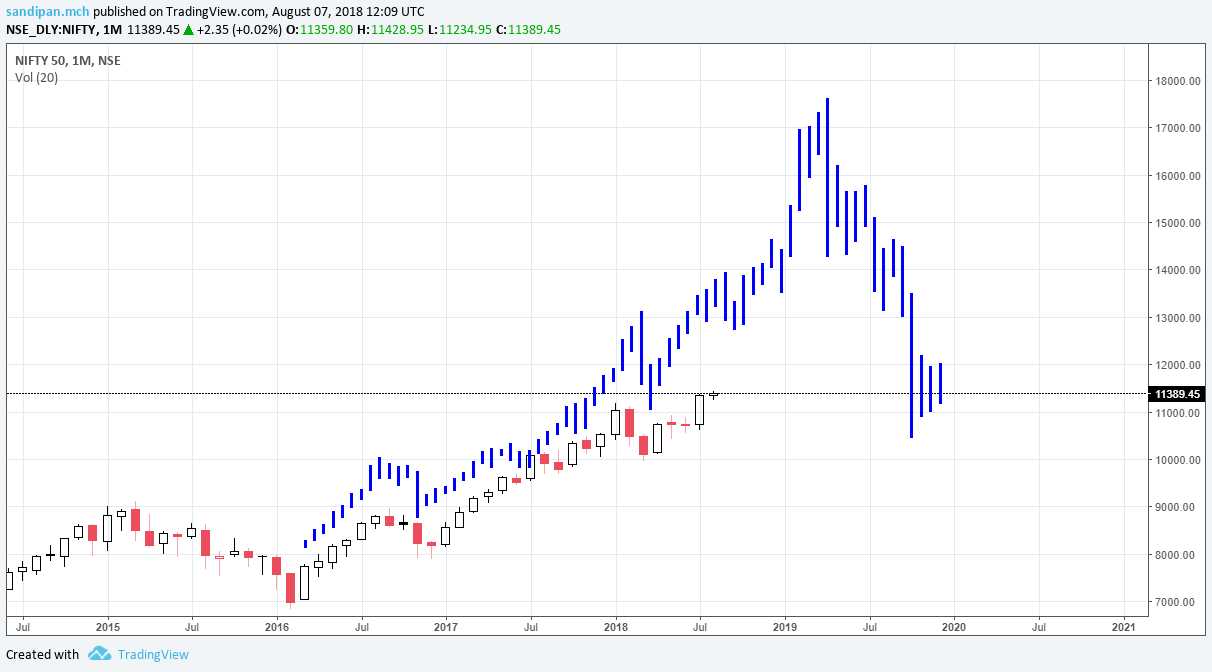
any market moves with a fractal nature in waves of 5, 3 impulse up , 2 corrections …
that the final wave of this whole bigger impulse is on the way is visually appreciable after having 2 impulse up and 2 corrections …
not only indian indices , but take any reference market , all are positioned in the same way, for example the us indices which i track…
and all of them move in tandem…
yes, the depth of the correction is questionable, and and might range from 30 to 50% of the highest quote …
Actually What i believe “Price/Chart is based on action” It can’t be reverse.I mean to say any1 cant measure the target price bcoz it’s depend on action(it could be economical/political etc.)
Edelweiss earnings out…
Numbers are looking good yoy , that was expected and given,
but qoq it has been a flattish with a little decline in topline , yet better margins in the capital business and lesser loss (and also revenue) from the insurance biz has improved the earnings qoq, there by expanding the overall gross margins optically, essentially the entire mix worked …
For the number crunching, here is the press release… https://www.bseindia.com/xml-data/corpfiling/AttachLive/f772b382-bd49-4364-bf10-5d7a9cb45c76.pdf
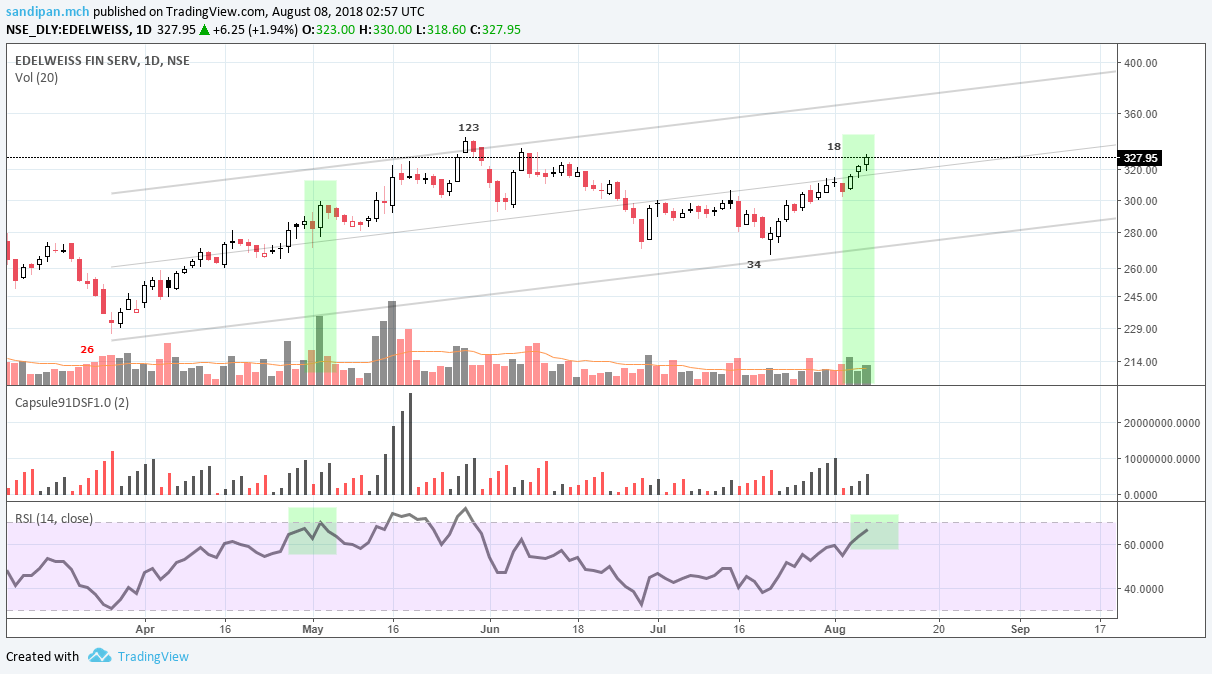
Technically, the scrip is moving on very low volumes yet, 18million shares transacted till now on this up swing , compared to the last one which was 126million , while the price has crossed the top of the previous upswing, and the last point of support formed in just 36million shares on the downswing…
Bulls are yet to show up,
Earnings effect are the all important point now,
A resistance retest on such low volumes can easily get converted into an upthrust and a swing below can happen…
Else what is more likely , is the market raises some eyebrow on the qoq numbers and the lets the bulls lose and the action is out of the trading range…
comparing q4fy18 earnings, that time market seemed panicky , and there was a volume surge of 6.3 million on that day when the 20 day moving average of the moving was just 2.1million…
this time, the market seems to be optimistic and less panicky, although the open and close range of the last 3 candles are small…
and RSI on the daily, approaching overbought levels[presently 66] … so what ever rally, happen on the earnings effect, should witness profit bookings also soon