Bull therapy 101-thread for technical analysis with the fundamentals

@phreakv6, looks like the pattern didn’t play out. Do you still hold HOEC?

No I booked a loss on this after wasting a lot of time following the roller-coaster for few months. I had wanted to scale it aggressively after both B-80 wells came online - I did scale it a bit as well in June after the D2 gas well was brought online and was producing but that position got stopped out as my 10% stop got hit. Then I heard that they had to stop production due to issues in evacuating the oil which also gets produced with the gas in D2. D1 which is the Oil well still has issues and won’t get fixed for while. It has been plagued with lot of issues - turns out this is how Oil & Gas business is and I learnt it paying a fee and wasting some time. I still follow it closely though but no bets until clarity emerges.

13 Likes

Pix Trans

Well your assesment is right. It is taking pause and should consolidate between 650 to 800 levels.

Next support is lower line of BB which also coincides with lower line of the rising channel -between 750-60.

If it breaks further, it can go to 650 and beyond.

Disclaimer : These are probability studies based on historical-patterns study, can go completely wrong .

1 Like

GPIL
Respect deeply @phreakv6 understanding of stocks.

Was just studying GPIL - saw your 6 months old chart here. Hence sharing my views for your reveiw.(thanks in advance)

Our view is that GPIL can go to much lower levels from here.

It seems to be doing a Zig Zag correction.
zig zag

Wave A was clear 5 waves down and recent bear-market -rally bounceback was not even 38% at Fibo levels ( a sign of weakness).Another sign of weakness is that it could not close above 40 weeks moving average.So it completed 5 waves in A, retraced in B and it should do 5 waves in C as per Zig Zag pattern.

Seems that it should go to near 220 in coming weeks that is where A ended and it also coincides with lower BB line.

Little further it can go 210 that is 40 months moving average . BB and moving averages are moving targets as they keep going up and down alongwith the price movement.
If it does not stop there (worst case scenario ) then it can go to 2018 high - where A=C .

Overall it does not any confidence.Look forward to your views.


Disclaimer :These are probability studies, can go wrong.

AURIONPRO - ATH all time high Monthly closing

Fundamental

Annual Revenue Rs 500 Cr
Market Capitalization Rs 1000Cr
3Y Revenue growth flat
PE 13
RoCE 22%
OPM 22%
NPM 15%

3 Likes

@StageInvesting - I only know and use trendlines (support & resistance) along with RSI and MACD. I don’t like GPIL chart much and I too think it can breakdown. Looking solely at the chart, it looks like 150 levels is where the support is (2018 top + 50 Month MA), but then this is trading at 3x earnings fundamentally and that’s where I wouldn’t know what to do.

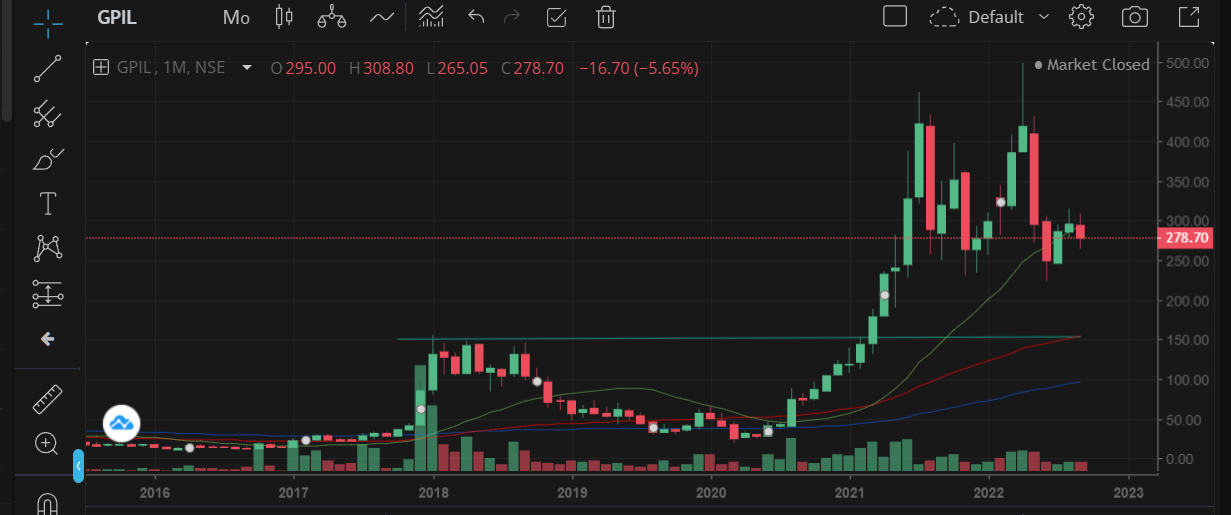
I can’t bet on something going to 1.5x or so earnings from 3x (though such things do happen in cyclicals as it did in Graphite India). I was looking to go long on this if it held 300 levels and if macro factors were in favor. But now with slowing global growth and strengthening dollar, commodities will be weak in general - which means going long is betting against the tide. Also the Steel capacity China has built will hit the world if they can’t find viable absorption with the country. It could work out very well for us if that’s the case as a country but Steel makers will go back to their sub 20% EBITDA margins pre-Covid. Overall I think likely-hood of this going sideways with a downward bias is high even if it doesn’t breakdown overnight.

Disc: Had an earlier trade and exited GPIL around 450 levels.

Some updates (No change in views and no trades in the month)

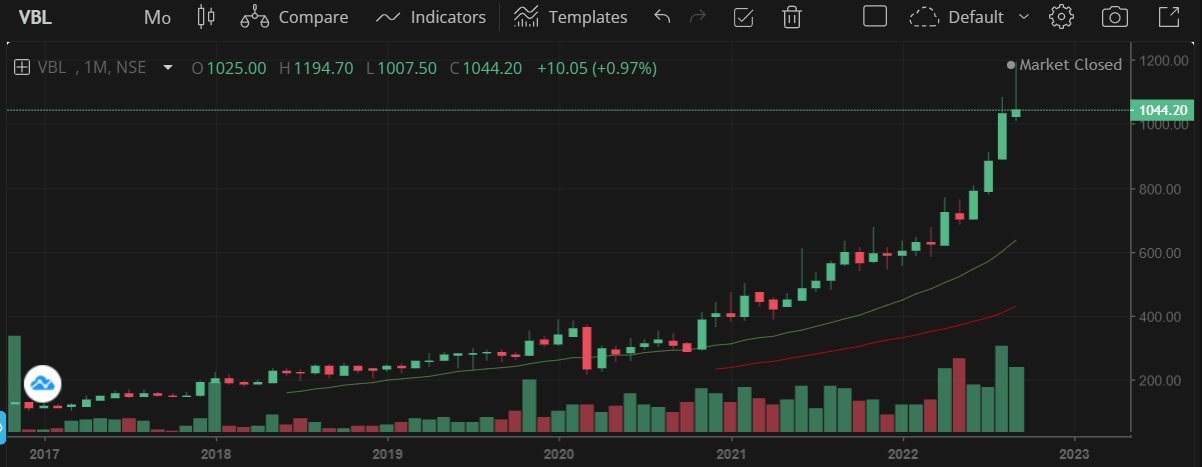
VBL - Probably the weakest of the lot although it started the month the strongest but retraced and lost most of the gains. I suspect there is FII selling here leading to weakness but its trading at 50x earnings with stellar growth (20% sales and 123% profits - 3 Yr CAGR) and is probably the cheapest of the stocks I own :slight_smile: so in no hurry to do anything. Seasonally weak quarters are ahead though as summer has passed so might be the reason?

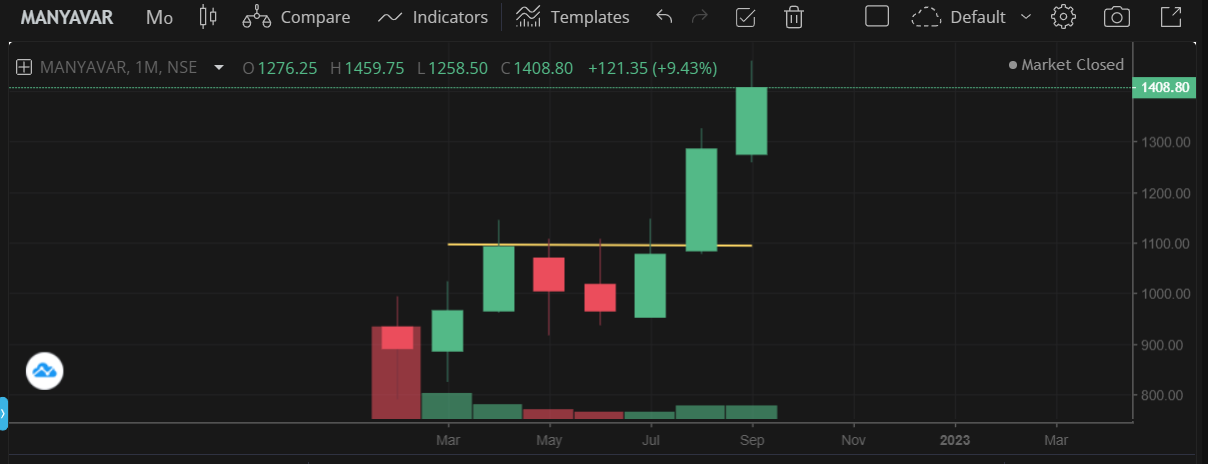
Manyavar - Strong chart has built one more strong month. Fundamentally I think this business should do well with the discretionary spends. Started a thread on the business. Festive season should aid sales and hopefully these earnings multiples will sustain

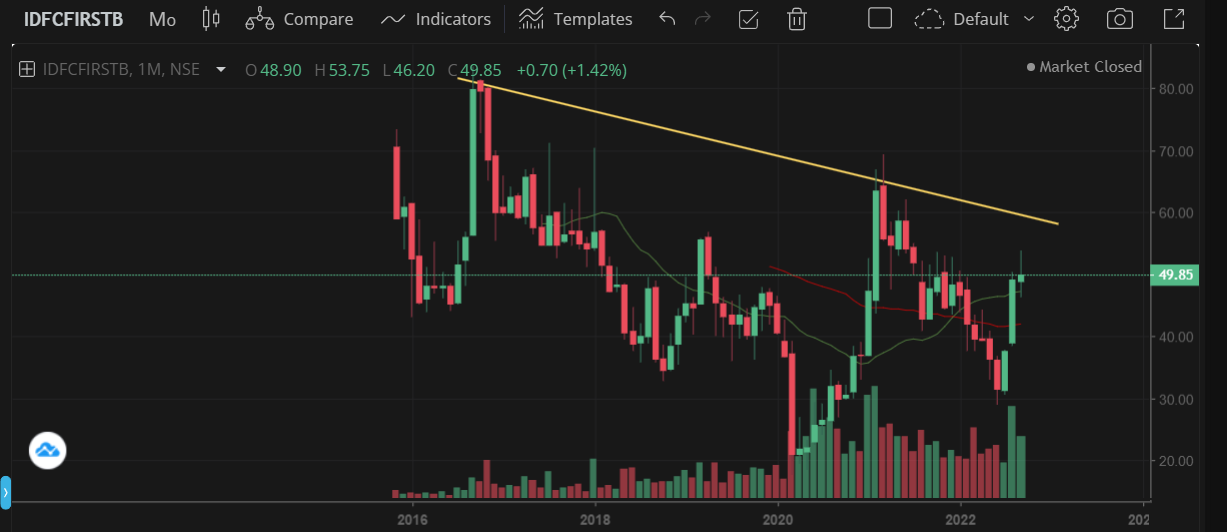
IDFC First Bank - Another weak performer for the month, though this too like VBL ended the month in green but unlike VBL which started strong and ended weak, this one picked itself up to close strongly. Results on 22nd and if the numbers am seeing on the economy are anything to go by, I think we should see a similar quarter as the last one in terms of most metrics. Technically I think it could test the trendline around 60 levels if results are strong and if there is steam can break it in the next month. Hoping for a re-test of ATHs of 80 levels here by end of year.

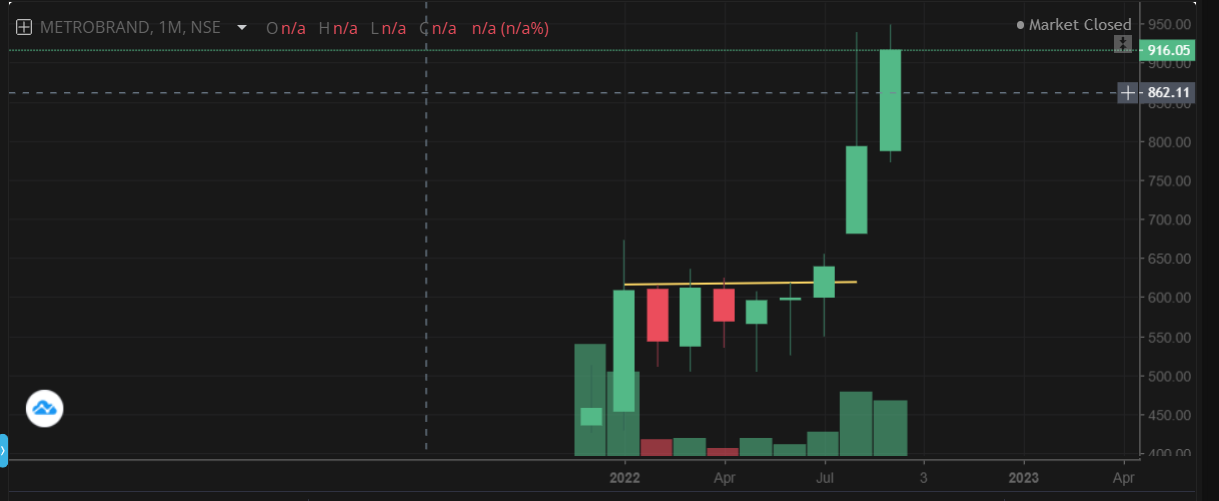
Metro Brands - Probably the best performer alongside Manyavar. I think its trading cheap relative to Campus and that differential should narrow in the coming months. Festive season should be a big plus here as well

Devyani - Tested 200 levels intraday during the month but it could take some more consolidation to take 200 out convincingly after Dunearn’s 2.6 Cr share supply hit the market in August. I suspect most of it is absorbed and there hasn’t been a price weakness that would take it under 185 levels.

Even NR Agarwal and HBL Power which make up large part of the tail allocation have closed the month strongly so overall good month despite all the noise and volatility. I think monthly charts help provide direction during these volatile times.

Some additional data that seems to support domestic consumption is found in RBI’s payments and settlements data

It looks like UPI Q2 FY '22 vs Q2 FY '21 is 32 lakh crore vs 19 lakh crore - which is up 68% YoY. We can’t read much into this data as it includes P2P transfers as well alongside P2M and UPI itself has been gaining market share but it does show a very healthy economy.

Credit Card + Debit Card spends at PoS and e-Commerce as well is up 28% from 3.35 lakh crore to 4.3 lakh crore. I think this is a stronger indicator for consumption plays I am interested in above. Within this, Credit Cards are up from 1.79 lakh crore to 2.74 lakh crore - a 51% increase. This might be indicative of a larger credit uptake and could be a positive for all financials including IDFC First Bank.

(If the charts look different from usual, its because I am trying Tradingview instead of ChartIQ in Zerodha for a change.)

Disc: Have positions in all these as disclosed earlier.

35 Likes

Nifty pharma completed retest of downward channel breakout.
Fundamentally, Indian pharma sector should benefit from commodity breakdown, with lower raw material costs/ lower logistics cost/ power cost. It can play out as a defensive sector incase of a global meltdown.

6 Likes

you have made an interesting observation indeed.
On the weekly timeframe it does appear that a channel breakout has happened.
However, if we look at an even larger timescale, say the monthly timeframe, things look quite different.
Looking all the way back to 2006, uptrends in NIFTY PHARMA have sustained only when it has closed above 20-month MA, followed by a confirmation in the subsequent monthly candle ( marked in red , middle of the bollinger band ).
The risk -reward will skewed towards an uptrend only when it closes above 13400 ( This also happens to be resistance zone for the previous major monthly peak in sep-15.
[Disc] : Recently exited my pharma bets in losses !

Regards,
Abhijit.

4 Likes

KOPRAN Weekly Chart, Trendline break

Fundamental:

Market Cap ₹ 828 Cr.
Stock P/E 13.3
Dividend Yield 1.76 %
ROCE 21.4 %
Sales growth 9.04 %
NPM 12.8 %
Profit growth of 25% CAGR over last 5 years

4 Likes


Rbl bank cup with handle pattern the banking stocks are out perrforming the broader markets and results are also being excellent with the credit growth picking up. Rbl bank is currently priced as one of the cheapest in the private banking pack with p/b at 0.6. the target for cup with handle comes at 210. The results are due on 22/10/2022. The price could be expected by December 2022 as per price action

1 Like

HBLPOWER Daily Chart

HBL
Buying on Pull back - Fib levels

25% Qty Fib 1.0
25% Qty Fib 0.786
50% Qty Fib 0.618

Fundamental

Market Cap ₹ 3,035 Cr.
Current Price ₹ 110
Stock P/E 31.5
Book Value ₹ 31.2
Dividend Yield 0.37 %
ROCE 13.4 %
Sales growth -2.66 %
NPM 6.93 %
Profit growth 18.4% CAGR over last 5 years

2 Likes

Bharat Forge >>>


The Company won new orders worth ~ Rs. 1,000 crs. across automotive and industrial segments. The new orders include a healthy mix of existing and new customers as well as traditional and new products.
image
Sales growth and OP is increasing with the OPM from last 2 years. As well promotor and FII holding also increased.
image
Let see how it will unfold from here …mahol to ban raha hai…!
for more details - The Defenders: Special Episode on Bharat Forge: Making Arms for India | 20 August, 2022 - YouTube

5 Likes

RAILTEL Daily Chart

(a) Trendline break with higher volume
(b) Hidden Divergence: Lower swing on RSI, Higher low on price

Fundamental

Market Cap ₹ 3,622 Cr.
Current Price ₹ 113
Stock P/E 17.0
Dividend Yield 2.13 %
ROCE 19.5 %
NPM 13.5%
Sales growth 12.7 %

During Jul-Aug-Sep-2022, shareholding % increased for Domestic institute as well Foreign Institute

2 Likes

MANYAVAR [Rs 1430] 1D Daily Chart

(a) Bearish Divergence: Higher top on Price candle, Lower top on RSI
(b) Double Top: Price attempting make another same level previous top, with weak candles, with weaker RSI

Chart’s bearish sign is at early stage, as HH-HL trend is still intact,
Confirmation on bearishness required, if price close below previous swing low 1380, coinciding with Pivot and 50EMA.

Contra view:
(a) There is a bullish view on the stock in this forum on 01-Oct at Rs 1408
(b) There is bullish view on the stock by Samir Arora on 06-June at Rs 1100

4 Likes

Some updates post earnings - (In short, I am still holding all the consumption names)

IDFC First Bank, Monthly - Poised near the resistance that it can bound over this month. Any close for this month around or above 64 can point to more follow-up gains next year (breakout from post-merger trendline). Fundamentally, the results have been very good and the story is playing out. I think book value could get closer towards 48-50 levels in a couple of years or so by which time this can even trade at 3x book (All the metrics including the Cost-to-Income should be better by then) which leaves considerable returns for the future.

Metro Brands, Weekly - Around 820 levels should offer strong support which is about 64x TTM P/E. The numbers continue to be good with 47% topline growth and 42% bottomline growth YoY. QoQ isn’t comparable for footwear businesses due to seasonality as contribution varies from 22% to 27% depending on quarter (Lot more pronounced in Bata). Q3 numbers should be strong with the wedding season and the festive season. With the valuation comfort and prospect of earnings growth led by volume growth, I have left this untouched. Metro has done phenomenally well due to its target market being unaffected by inflation (Crocs continues stellar growth and the 3000+ range is where business is experiencing highest growth) - strong wage growth has compensated, which was the fundamental thesis of choosing these stocks in the first place.

Varun Beverages, Daily - Probably the best performer of the lot, along with IDFC First Bank. Seems to be resuming uptrend after 6 weeks of consolidation. The numbers have been phenomenal with strong volume growth for a seasonally weak quarter which has beaten summer quarter last year YoY. Getting Cheetos, Doritos, Lays business in Morocco could be an indicator for further in-roads into PepsiCo’s foods business that they don’t usually give out. This is probably now a BIMARU play as well with Bihar, Rajasthan, MP etc. contributing a lot to the growth. Despite the already high allocations (#1), I am always tempted to allocate more here - such has been the prospects and performance. With strong utility, cheap price points, smaller packs, I expect per capita beverage consumption to go up strongly and lead domestic consumption from the front.

Devyani, Weekly - Around 180-185 levels have been strong support and currently its trading around those levels (Also 20 WMA). Business performance has been very good here as well for a seasonally weak quarter with 45% topline growth and 21% bottomline growth (One off currency loss in Nigerian subsidiary skewing bottomline. EBITDA still highest ever across quarters, though this is a seasonally weak quarter). Store addition is the strongest with 88 stores added in the quarter which is the highest. I assumed the margin decrease was due to newly added stores but looks like there is gross margin compression as well due to inflation (confirmed in concall). Most of the RM prices from chicken, oil, gas prices though are moderating as per management so margins should come back. The topline is the highest ever which isn’t bad for a seasonally weak quarter. When margins come back, bottomline should shine as well (However tax rates might be 25% from next year)

While Metro and Devyani appear weak on the charts, so was the case with VBL and IDFC First after September and now they are the best performing, so have decided to exercise some patience since fundamentally numbers are good.

Manyavar is yet to announce results. N R Agarwal and HBL are coming soon. Haven’t seen a reason to sell any of these, so have held on as prospects are good.

Some new additions

Permanent Magnets, Weekly - Broke out of 1 year resistance, re-tested and formed a triangle from which it could be breaking out. Volumes are slim so good luck buying this. :slight_smile: The investor presentations of 2022 and 2021 and the AR offer great insights to the business. The numbers don’t seem as good as they should be due to reduction in gas meters contribution. However the contribution of EVs has been going up considerably and the vision of the business seems very promising (While they are also into current sensing and BMS, smart meters and similar space as Shivalik bi-metal, they seem like a slightly differentiated play)

Gufic, Weekly - Seems to be breaking out of the downward trendline on the weekly. I was interested in this fundamentally after going through the VP thread. Consumer focused branded pharma play, especially in the vanity space sounded like a good thing to me. Valuations weren’t demanding so took a position

Disc: Have positions in IDFC First, VBL, Devyani, Metro and Manyavar from early July or so. No trades since. Have positions in Permanent Magnets between 540-550 levels and Gufic from 220 levels. Not SEBI registered and none of this is advice. I write to make things clear to myself more than anything

40 Likes

SOUTHERN PETROCHEM, 1D Daily Chart [Rs 60.85] (spic.in)

Price stayed in small compression channel for a month long accumulation
It gave an fake upside break-out during the channel and price returned back to channel
It gave a fake downward break-out at the end of channel.
Price closed at very small doji daily candle below the channel.
Then with very high volume price made a break-out with a candle size 3x the channel.

Price closed above 200DMA

Safe to buy during pull-back when price attempt to retest 200DMA [Rs 58.8]

Fundamental

Market Cap ₹ 1,239 Cr.
Annual Sales ₹ 2219 Cr.
Current Price ₹ 60.8
EPS ₹ 12.3
Stock P/E 4.95
Dividend Yield 0.00 %
ROCE 23.3 %
Sales growth 4.58 %
NPM 8.74 %

5 Likes

JBMA [Rs 417] 1D Daily Chart Home - JBM Group

Price staying in compressed zone for a month-long period

Attempted break out, but resulted in a failed Elephant bar [Oliver Velez]

Recent candle has again shown attempt going upward of channel

There is very slight improved RSI, but bullishness confirmation is missing

One candle of size Rs 15-18 with upper quadrant closure may confirm the upward trend resumption.

Contra view: Current price is almost 10% below 200 day moving average

Fundamental

Market Cap Rs 4928 Cr
TTM Sales Rs 3788 Cr

Company has announced quarterly result yesterday

YoY changes

Revenue from Operation +30%
Earnings per Share +40%

Stock PE 27
RoCE 13.5%

Elecon, Weekly - Had posted this chart earlier around 400 levels. It corrected from there on low volumes for 3 weeks and has since then started upmove, with this week likely going to be the breakout week. Numbers came in last week and they were exceptional. Last concall had hinted at good performance and expanding margins owing to operating leverage. Looks like that is playing out.

This quarter’s call is very bullish on the outlook for the business as well. Expanding margins, improving return ratios, good order book, debt gone to zero. Its a good play on Defence as well as Industrial capex (Steel, Power, Cement). Guidance - 1500 Cr for FY23 and 2000 Cr for FY24. Margins could be around 22% on this. It looks like higher energy costs abroad are driving business (could be more structural, long-term growth). Exports will be 50% by FY30 (Right now 10-12%).

Valuation is in favour considering the growth opportunity and structural tailwinds in the business and also net debt-free balance sheet.

Vimta, Monthly - Good triangle consolidation and a breakout post Q2 results and concall. Here as well the future looks very good considering its doing well in pharma, electronics and food testing as well with diagnostic business being the only drag. The NFL setup along with FSSAI (PPP partnership) at JNPT could start contributing to numbers in the second half. Here again future could hold good topline growth along with margin expansion. Valuations not very demanding considering the growth opportunities perhaps.

There’s also a long-term 4 year C&H formation on the monthly charts

Disc: Have positions in Elecon between 350-400, added more post results. Vimta between 400-450

17 Likes

Recently took a position in Elecon Engineering:-

Thesis: Co can do 2000+ crores of rev in FY24 with expanding ROCE and sustaining Ebitda Margins at 22%. Moreover they have launched new products like Planetary Gears.

Similar thing played out in one of the other capital good companies where demand for cheaper products led to super normal exports growth. Can it play out in Elecon along with Navy orders coming in (expecting 300 crores+). Lets see

Technically: stock has broken out post results with high volumes and Relative strength vs the sector is greater. Part of satellite Portfolio.

Disclaimer: Make independent buy and selling decisions. Not a reco to buy or sell by any means.

17 Likes

Equitas SFB:-

Post the fall- the trend has finally reversed and volumes are building. Testing the trend line resistance.

Fundamental thesis:

Credit cost will fall in H2 this year going by the stated guide and write backs can start from Q3 onwards. Given they run the CV business High PCR, taken write backs when the used CV gets sold. Could be used to beef up PCR. Lets see.

BVPS post merger will be at Rs41- not factored in any street estimates at the moment.

Guidance to grow AUM is at 25%+, H2 is seasonally stronger.

Only joker in the pack is to watch the asset quality like a Hawk. GNPA’s have started falling though.

Disc: own Equitas hold co, but track SFB as reverse merger can be completed at any time, given rbi & nclt approval is here. A case study for me as I bought the Hold co at 110 first and then averaged down in 80s and 90s. Given the value that emerged. Not a reco to buy or sell by any means.

10 Likes