
Dynemic, Weekly - Price/Volume Breakout from an upward consolidation channel. Looks like the AGM has kindled the animal spirits ![]() Having firm guidance with good confidence makes market front-load a lot of the returns as those near-future earnings get discounted quickly. AGM notes in the thread nicely covers everything. At a guided FY23 EBITDA of 110 Cr, this is trading at about 8x FY23E EV/EBITDA.
Having firm guidance with good confidence makes market front-load a lot of the returns as those near-future earnings get discounted quickly. AGM notes in the thread nicely covers everything. At a guided FY23 EBITDA of 110 Cr, this is trading at about 8x FY23E EV/EBITDA.
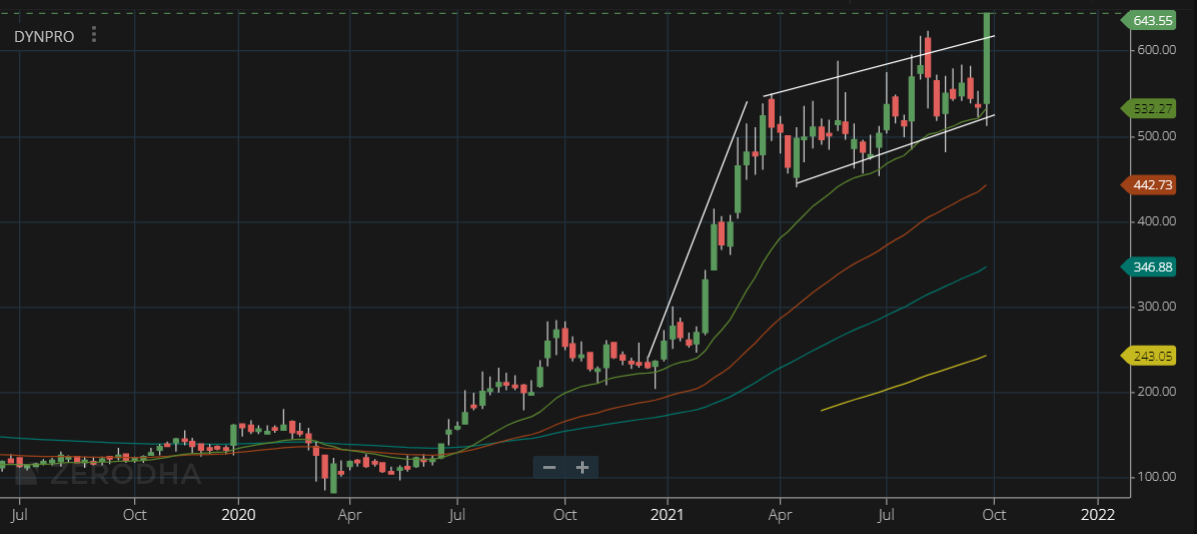
Risks: Near term, the interest and depreciation can skew the PnL a fair bit (Maybe additional 5 Cr of Int+Dep total can hit the PnL per quarter). If this becomes common knowledge, and is not a surprise, and the market is buoyed by the guidance, its perhaps nothing to worry about.
Ambika Cotton, Monthly - ATH breakout on the monthly chart couple of months back, a pullback and looks set to resume uptrend. Owing to that volatile month in 2018, it has only this week hit ATH on the weekly on closing basis. At this point, all supply from seems exhausted. Fundamentally, the management has guided for 800 Cr topline in the AGM. Provided the recently elevated margins of around 25% sustain , its currently trading at 5x FY22E EV/EBITDA at 1000 Cr.
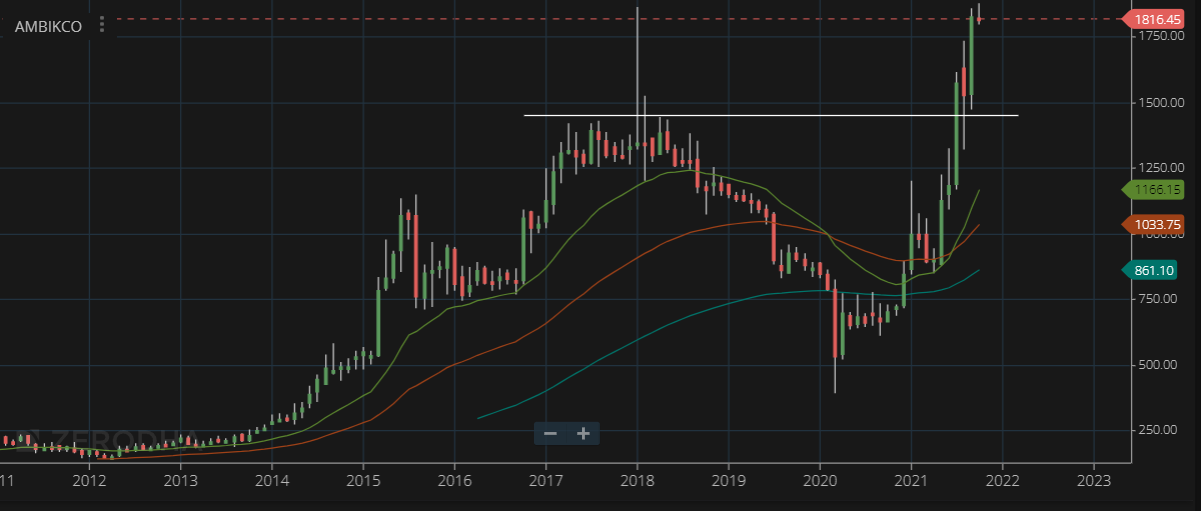
Risks: 25% margins might be over-projecting near-term tailwinds. Still at current valuation, we might be paying fair price, considering the management is good and dividend payouts have been good and the business is being bought at < 2x book.
Disc: Have positions in both. Dynemic from 500 levels or so, added further post AGM. Ambika from around 1750 or so last week. I am a novice so please consult someone more experienced or dig deeper on your own before buying.