
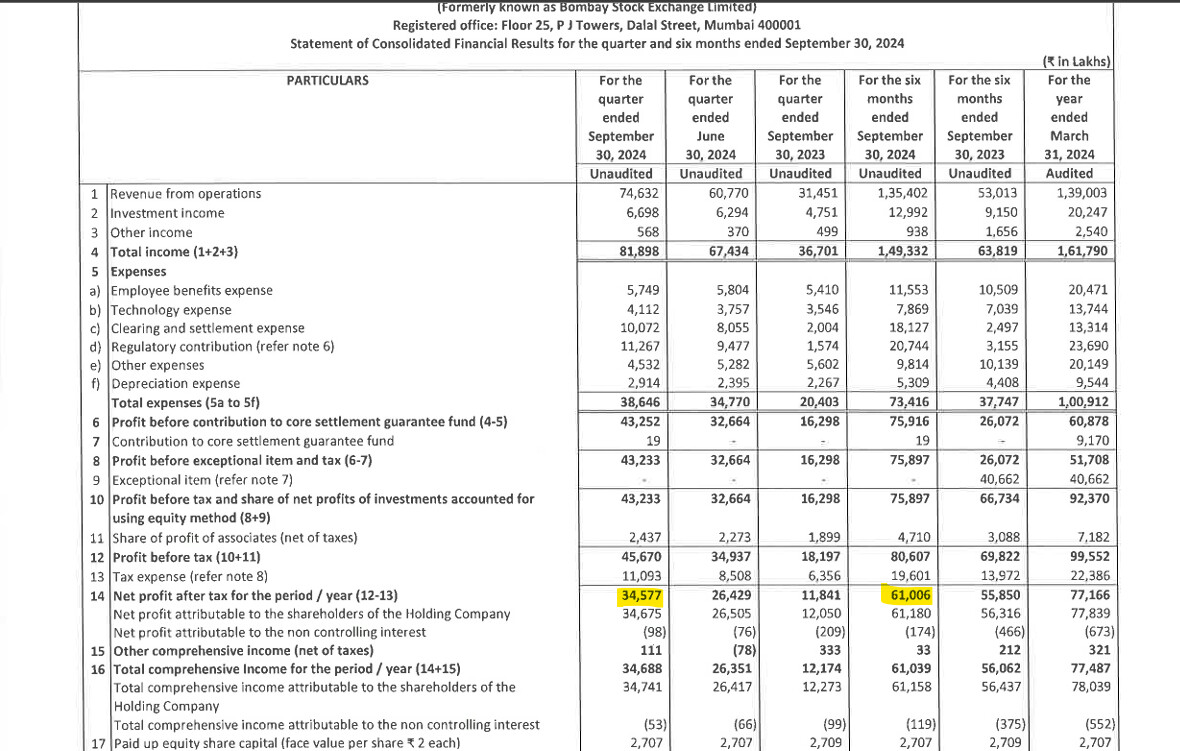
Good results From BSE Q2 NP Rs.345 Cr, H1 NP Rs.610Cr.
5 Likes
Does anyone has a good understanding the recent FnO changes introduced by SEBI? Also how do we track the impact of these changes on the volumes of BSE/NSE?
If someone can help in identifying the volume changes and the website URLs for tracking, that will be great. Also how these should be used to intepret or co-relate to PnL of the exchanges, will be a good learning.
Disclaimer: I have tried earlier but have struggled in the past, maybe missing some important links.
The date of applicability of change is 20th Nov. We have to wait to see how it plays out.
1 Like
Still early days, but good to see some data on change in option volumes
4 Likes
Q3 Update:
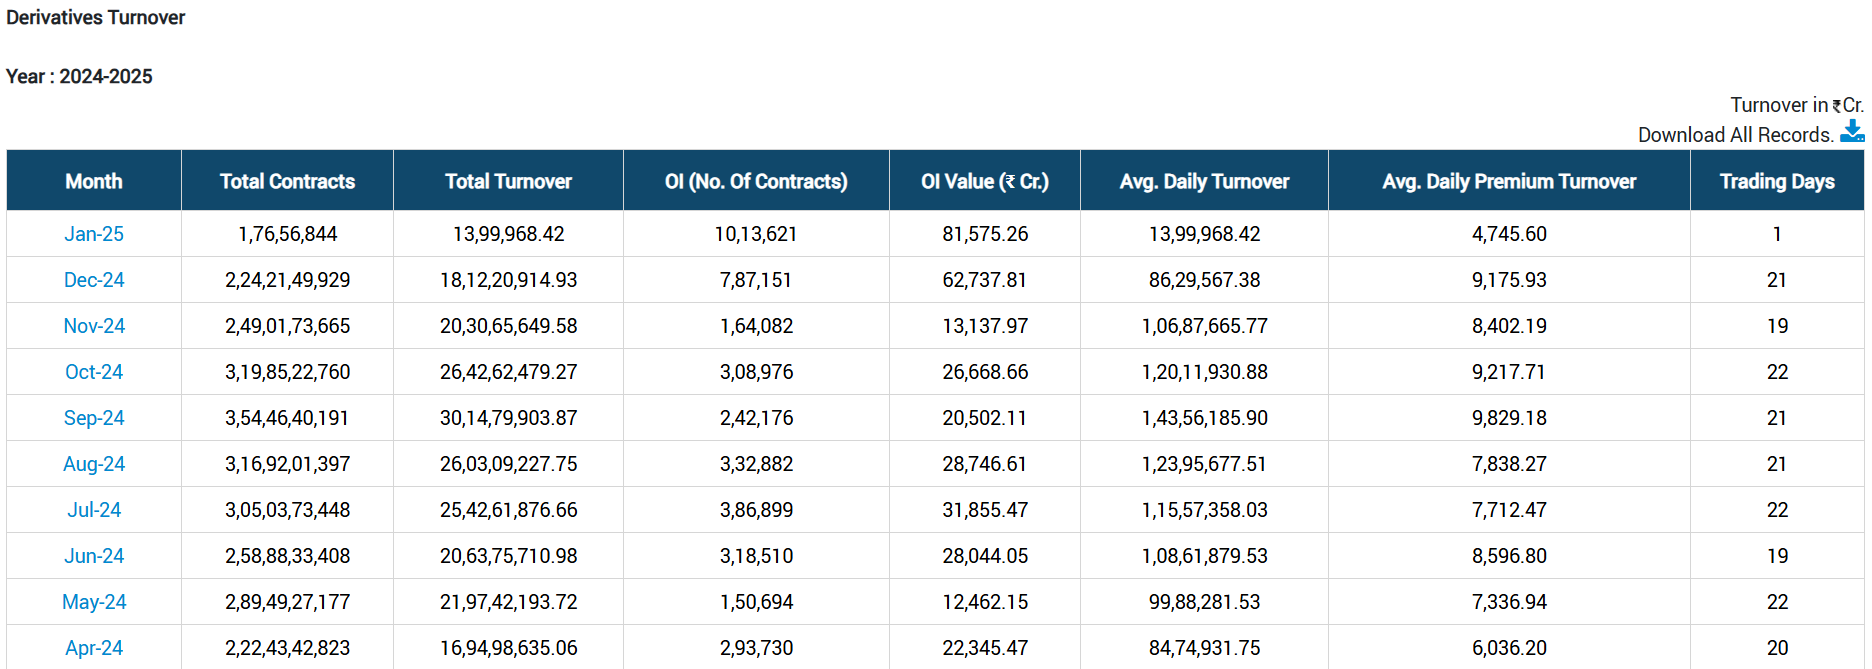
Derivatives: The average daily turnover hovered around 9000 Crore during the quarter irrespective of Bankex literally sidelined due to SEBI move to curb so called excessive trading in derivatives market. Additionally, the single stock derivatives has not really made any traction yet. The coming months will give a better picture on how Sensex as a product compete with Nifty in the derivatives market - early trends are certainly encouraging. While the average daily turnover has reduced, the open interest and the daily premium turnover has significantly grown after the new rules came into existence. Considering the reduction in charges etc during the quarter – I expect the revenue from the segment to largely be in line with what was reported during the previous quarter.
Star Mutual Fund: This is one segment where we don’t see any slow down. The number of orders processed are approximately 10% higher as compared to Q2 with the new orders remaining above 50 crore for each of the months- the revenue from the segment should be growing at similar pace.
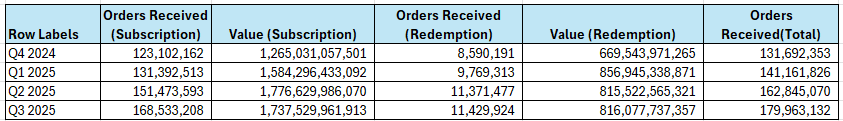
Star Mutial Fund Data
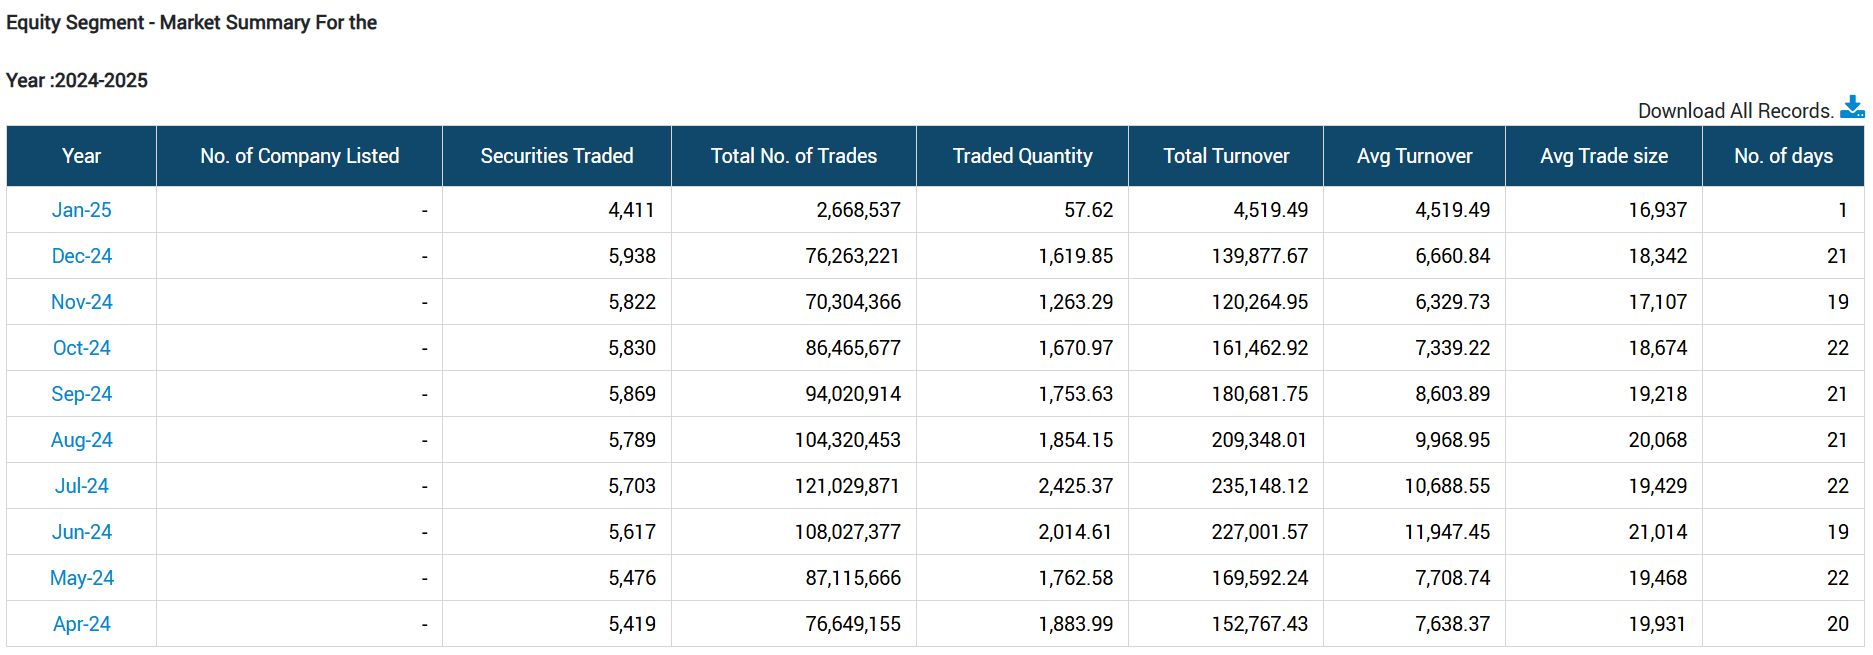
Equity segment: The numbers from equity segment has been disappointing - BSE can keep pointing out multiple factors for this fall, but this is one area that the management needs to really work on - the oldest exchange in India should be having at least 10% market share.
The revenue from the segment should be lower by 20% or more as compared to last quarter reflecting the fall in turnover.
IPO Market: IPO market remained robust during the quarter with about 36 companies hitting the IPO market during the quarter. The revenue from the segment should largly in line with what was reported during the last quarter.
Overall, the numbers are expected to be in line with what was reported during Q2.
AJ
Remain invested - made partial exit during first week of December. Remain my largest holding.
5 Likes
That mean there will not be QoQ growth?
Here is my attempt to put month wise Option Derivatives market share of BSE and NSE
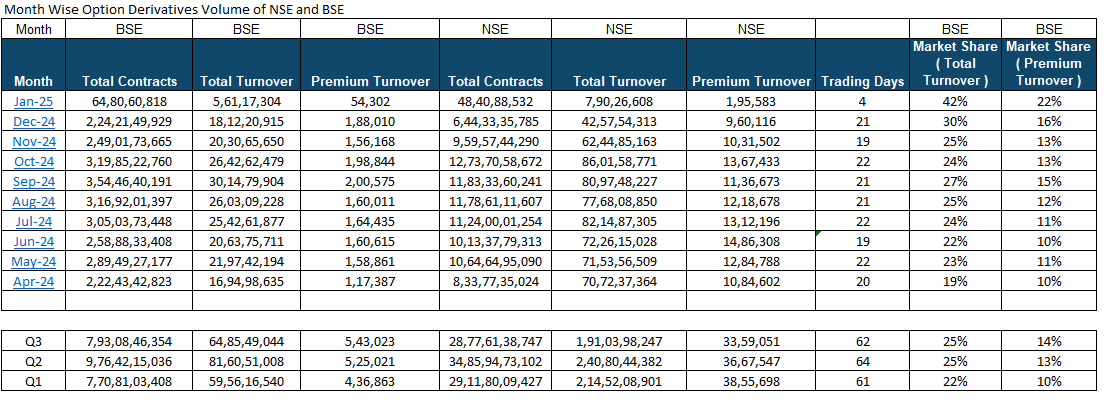
Post the change in weekly expiry rules in Nov , from the initial data it seems BSE has take significant market share from NSE in Dec 24 and Jan 25
Views Invited
Disc: Invested
8 Likes
Good data points, thank you. Would it be possible to share links to the source of data for BSE & NSE turnover?
1 Like
Link for BSE Volume : https://www.bseindia.com/markets/keystatics/Keystat_turnover_deri.aspx
Link for NSE volume : https://www.nseindia.com/market-data/business-growth-fo-segment
4 Likes
This is really helpful.
What do you think moves the revenue number more the premium turnover or total turnover?
My understanding is that premium turnover should be having direct correlation with revenues.
1 Like
Revenue number is proportional to premium turnover ; BSE charges Rs 3250 per 1 cr of premium turnover as of now for Sensex options
What I am not able to understand why is there so much disparity in premium turnover Market share and Total turnover market share vs NSE ? Can anyone pl explain this
2 Likes
Many instituitions are now adding coverage on BSE. e.g. links added below.
Couple of thing that stands out and will get confirmed over the coming months/quarter is outlined in the reports:
- increased contract sizes shall not have a significant impact on BSE’s index option premium volumes as its average number of contracts traded/order is five
- “higher contract sizes to result in lower clearing charges as clearing charges are calculated on the number of contracts cleared, which is likely to reduce. Hence, clearing charges shall drop from Rs 2,013 per Rs 1 crore of premium turnover in FY24 to Rs 734 by FY26E, contributing to EBITDA margin expansion over FY24–27,” added Nuvama : so almost 2/3rd drop in clearing charges.
Nuvama has a much aggressive price target compared to Goldman.
2 Likes
One of the assumptions i do not agree with nuvama’s report is that they have assumed only 14.9% of premium TO market share whereas in Dec itself was 16% and Jan is trending at 20%
| Month | BSE | BSE | BSE | BSE | BSE | BSE | NSE | NSE | NSE | NSE | NSE | NSE | BSE | BSE | |
|---|---|---|---|---|---|---|---|---|---|---|---|---|---|---|---|
| Month | Total Contracts | Total Turnover | Premium Turnover | A/D Contract | A/D Total TO | A/D Premium TO | Total Contracts | Total Turnover | Premium Turnover | A/D Contract | A/D Total TO | A/D Premium TO | Trading Days | Market Share ( Total Turnover ) | Market Share ( Premium Turnover ) |
| Jan-25 | 1,26,69,94,015 | 15,19,69,023.77 | 1,45,288 | 9,74,61,078 | 1,16,89,925 | 11,176 | 1,55,91,91,104 | 24,71,19,992 | 5,78,840 | 11,99,37,777 | 1,90,09,230 | 44,526 | 13 | 38% | 20% |
| Dec-24 | 2,24,21,49,929 | 18,12,20,915 | 1,88,010 | 10,67,69,044 | 86,29,567 | 8,953 | 6,44,33,35,785 | 42,57,54,313 | 9,60,116 | 30,68,25,514 | 2,02,74,015 | 45,720 | 21 | 30% | 16% |
| Nov-24 | 2,49,01,73,665 | 20,30,65,650 | 1,56,168 | 13,10,61,772 | 1,06,87,666 | 8,219 | 9,59,57,44,290 | 62,44,85,163 | 10,31,502 | 50,50,39,173 | 3,28,67,640 | 54,290 | 19 | 25% | 13% |
| Oct-24 | 3,19,85,22,760 | 26,42,62,479 | 1,98,844 | 14,53,87,398 | 1,20,11,931 | 9,038 | 12,73,70,58,672 | 86,01,58,771 | 13,67,433 | 57,89,57,212 | 3,90,98,126 | 62,156 | 22 | 24% | 13% |
| Sep-24 | 3,54,46,40,191 | 30,14,79,904 | 2,00,575 | 16,87,92,390 | 1,43,56,186 | 9,551 | 11,83,33,60,241 | 80,97,48,227 | 11,36,673 | 56,34,93,345 | 3,85,59,439 | 54,127 | 21 | 27% | 15% |
| Aug-24 | 3,16,92,01,397 | 26,03,09,228 | 1,60,011 | 15,09,14,352 | 1,23,95,678 | 7,620 | 11,78,61,11,607 | 77,68,08,850 | 12,18,678 | 56,12,43,410 | 3,69,90,898 | 58,032 | 21 | 25% | 12% |
| Jul-24 | 3,05,03,73,448 | 25,42,61,877 | 1,64,435 | 13,86,53,339 | 1,15,57,358 | 7,474 | 11,24,00,01,254 | 82,14,87,305 | 13,12,196 | 51,09,09,148 | 3,73,40,332 | 59,645 | 22 | 24% | 11% |
| Jun-24 | 2,58,88,33,408 | 20,63,75,711 | 1,60,615 | 13,62,54,390 | 1,08,61,880 | 8,453 | 10,13,37,79,313 | 72,26,15,028 | 14,86,308 | 53,33,56,806 | 3,80,32,370 | 78,227 | 19 | 22% | 10% |
| May-24 | 2,89,49,27,177 | 21,97,42,194 | 1,58,861 | 13,15,87,599 | 99,88,282 | 7,221 | 10,64,64,95,090 | 71,53,56,509 | 12,84,788 | 48,39,31,595 | 3,25,16,205 | 58,399 | 22 | 23% | 11% |
| Apr-24 | 2,22,43,42,823 | 16,94,98,635 | 1,17,387 | 11,12,17,141 | 84,74,932 | 5,869 | 8,33,77,35,024 | 70,72,37,364 | 10,84,602 | 41,68,86,751 | 3,53,61,868 | 54,230 | 20 | 19% | 10% |
2 Likes
Updates on Jan Volumes
| + | 1 | BSE Index Option market share ( on a notional turnover basis ) has improved from 29.9% in Dec to 31.7% in Jan ; Market share ( on a premium TO basis ) has improved from 16.4% in Dec to 20.3% in Jan |
|---|---|---|
| + | 2 | BSE Index Futures market share also improved from 0.7% in Dec to 0.8% in Jan |
| - | 3 | BSE Cash segment market share consistently falling down ; fallen from 6% In Dec to 5.6% in Jan |
| + | 4 | BSE Mutual fund segment continously grows ; Average Mutual fund volumes grows by 17% in Jan vs Dec |
| 5 | Equity options also growing well ; but its too small as of now |
| Month | BSE | BSE | BSE | BSE | BSE | BSE | NSE | NSE | NSE | NSE | NSE | NSE | BSE | BSE | ||
|---|---|---|---|---|---|---|---|---|---|---|---|---|---|---|---|---|
| Month | Total Contracts | Total Turnover | Premium Turnover | A/D Contract | A/D Total TO | A/D Premium TO | Total Contracts | Total Turnover | Premium Turnover | A/D Contract | A/D Total TO | A/D Premium TO | Market Share ( Total Turnover ) | Market Share ( Premium Turnover ) | BSE Premium TO as a % of Tot TO | NSE Premium TO as a % of Tot TO |
| Jan-25 | 1,56,86,61,835 | 19,69,75,885 | 2,65,241 | 6,82,02,688 | 85,64,169 | 11,532 | 3,60,90,53,742 | 42,53,74,476 | 10,38,533 | 15,69,15,380 | 1,84,94,542 | 45,154 | 31.7% | 20.3% | 0.13% | 0.24% |
| Dec-24 | 2,24,21,49,929 | 18,12,20,915 | 1,88,010 | 10,67,69,044 | 86,29,567 | 8,953 | 6,44,33,35,785 | 42,57,54,313 | 9,60,116 | 30,68,25,514 | 2,02,74,015 | 45,720 | 29.9% | 16.4% | 0.10% | 0.23% |
| Nov-24 | 2,49,01,73,665 | 20,30,65,650 | 1,56,168 | 13,10,61,772 | 1,06,87,666 | 8,219 | 9,59,57,44,290 | 62,44,85,163 | 10,31,502 | 50,50,39,173 | 3,28,67,640 | 54,290 | 24.5% | 13.1% | 0.08% | 0.17% |
| Oct-24 | 3,19,85,22,760 | 26,42,62,479 | 1,98,844 | 14,53,87,398 | 1,20,11,931 | 9,038 | 12,73,70,58,672 | 86,01,58,771 | 13,67,433 | 57,89,57,212 | 3,90,98,126 | 62,156 | 23.5% | 12.7% | 0.08% | 0.16% |
| Sep-24 | 3,54,46,40,191 | 30,14,79,904 | 2,00,575 | 16,87,92,390 | 1,43,56,186 | 9,551 | 11,83,33,60,241 | 80,97,48,227 | 11,36,673 | 56,34,93,345 | 3,85,59,439 | 54,127 | 27.1% | 15.0% | 0.07% | 0.14% |
| Aug-24 | 3,16,92,01,397 | 26,03,09,228 | 1,60,011 | 15,09,14,352 | 1,23,95,678 | 7,620 | 11,78,61,11,607 | 77,68,08,850 | 12,18,678 | 56,12,43,410 | 3,69,90,898 | 58,032 | 25.1% | 11.6% | 0.06% | 0.16% |
| Jul-24 | 3,05,03,73,448 | 25,42,61,877 | 1,64,435 | 13,86,53,339 | 1,15,57,358 | 7,474 | 11,24,00,01,254 | 82,14,87,305 | 13,12,196 | 51,09,09,148 | 3,73,40,332 | 59,645 | 23.6% | 11.1% | 0.06% | 0.16% |
| Jun-24 | 2,58,88,33,408 | 20,63,75,711 | 1,60,615 | 13,62,54,390 | 1,08,61,880 | 8,453 | 10,13,37,79,313 | 72,26,15,028 | 14,86,308 | 53,33,56,806 | 3,80,32,370 | 78,227 | 22.2% | 9.8% | 0.08% | 0.21% |
| May-24 | 2,89,49,27,177 | 21,97,42,194 | 1,58,861 | 13,15,87,599 | 99,88,282 | 7,221 | 10,64,64,95,090 | 71,53,56,509 | 12,84,788 | 48,39,31,595 | 3,25,16,205 | 58,399 | 23.5% | 11.0% | 0.07% | 0.18% |
| Apr-24 | 2,22,43,42,823 | 16,94,98,635 | 1,17,387 | 11,12,17,141 | 84,74,932 | 5,869 | 8,33,77,35,024 | 70,72,37,364 | 10,84,602 | 41,68,86,751 | 3,53,61,868 | 54,230 | 19.3% | 9.8% | 0.07% | 0.15% |
3 Likes
A 199Cr Contribution to core settlement guarantee fund, drags the Net Profit for Q3 to Rs.218Cr, vs Rs.345Cr.
It looks to have reduced, but exclude the contribution, on operational basis the profit would have been Rs.417Cr.
Links: Investor Presentation Q3-FY25
Results Q3-FY25
a quick note, do see the increase in Premium TurnOver on monthly basis in Jan’25, Feb’25 versus Oct-Dec’24. I know we are not even covered 50% of the trading days yet, but Q4 looks promosing from Derivatives premium turnover data perspective.
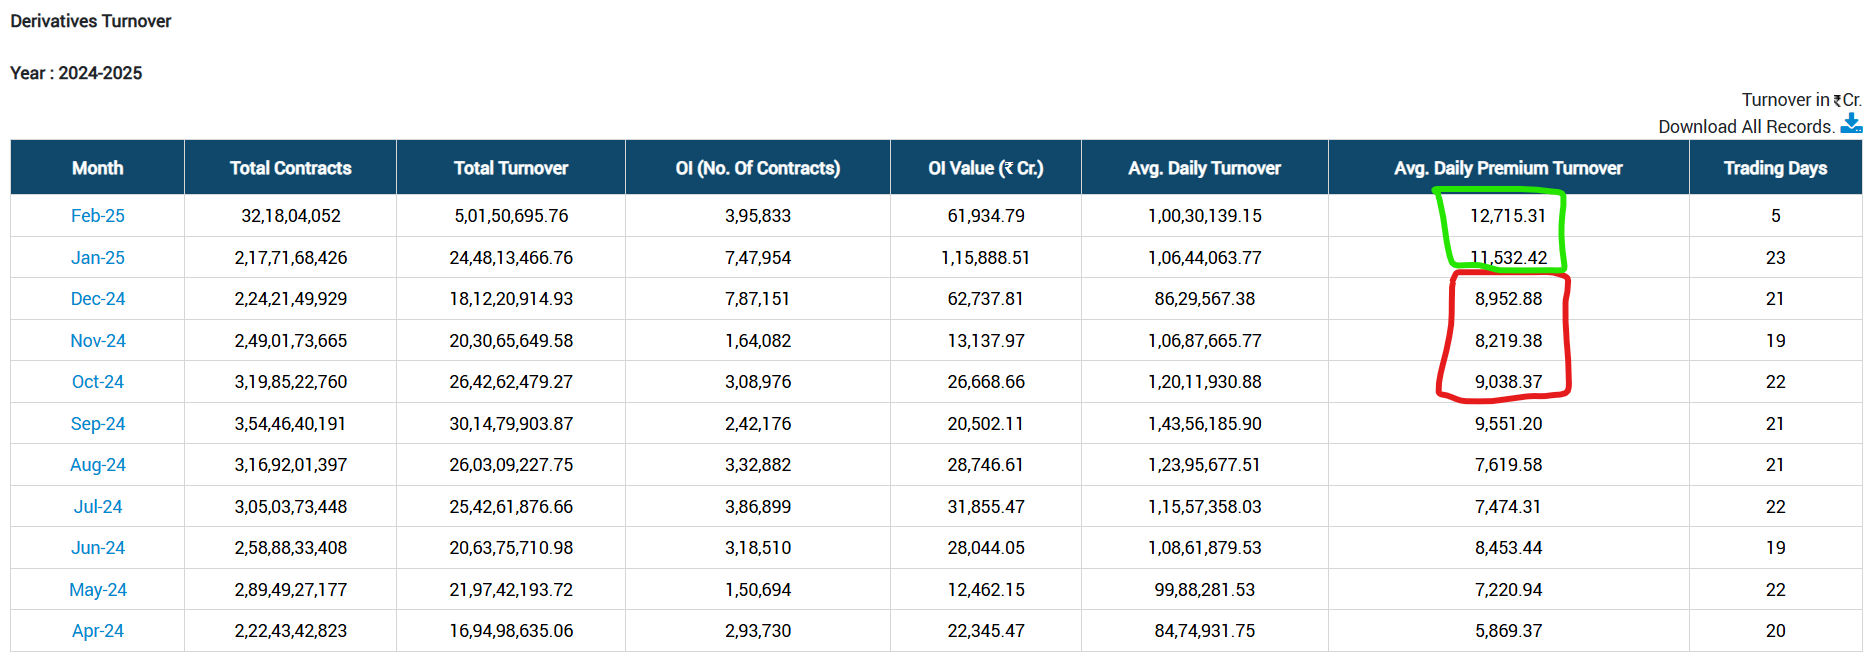
4 Likes
@ashwind : Good point ; Jan has been good indeed but feb i believe its too early as its been only 5 trading session , If they are able to deliver 12500 cr of average premium turnover in feb , that would be indeed great
I am not solve this SGF puzzle ? 190 cr provision in Dec quarter is a big drag ; can u throw any light how can we estimate this in future quarter l Iwas on a call today but management did not provide any guidance on this
2 Likes
the SGF part even Sundararaman Ramamurthy cannot answer ![]() (atleast that is what he claims in conference calls, like today, read the transcript)
(atleast that is what he claims in conference calls, like today, read the transcript)
SGF is something the exchanges pay, based on their turnover, volumes, etc which results in some risk related calculations. The primary objective of the Core SGF is to ensure the settlement of trades in case of a default by a clearing member. It acts as a buffer to absorb losses that might occur if a member fails to honor their settlement obligations.
- In case of a default, the Core SGF is used to complete the settlement process without disrupting the normal operations of the market. It ensures that trades are settled even if a member fails to meet their financial commitments.
- The fund is segment-specific, meaning there are separate funds for different market segments like cash, futures and options (F&O), currency derivatives (CD), etc., each tailored to manage risks specific to that segment.
Since the SGF is segment specific, as the volumes of BSE rises, it will have to pay this.
Per my observation in 2022 & 2023 year also it was paid in Q3. Not very sure, but other quarters this might be called based on certain factors.
3 Likes
I believe this is dependent on turnover and there also mix of long term contract ; My sense is that overall turnover would be flat or drop marginally in Q4 vs Q3
If the notional turnover does not increase in Q4 vs Q3 , should the SGF be there in Q4 ?
I was seeing the NSE numbers , they have reversed 500 crs of SGF in Q3 as they had been providing 2 pc of turnover on conservative basis
Also , are all contracts of BSE executed by ICCL or NCCL also ?
1 Like
No. The trading Member (broker) decides the clearing house ICCL or NCCL. Based on that exchange (BSE/NSE) has to pay clearing house. BSE was suffering here, with the increase in FNO revenue, it had to pay more clearing charges to NCCL, since most brokers are aligned to NCCL. But recent SEBI direction to increase contract size has helped BSE, since the clearing fees is per contract.
- “higher contract sizes to result in lower clearing charges as clearing charges are calculated on the number of contracts cleared, which is likely to reduce. Hence, clearing charges shall drop from Rs 2,013 per Rs 1 crore of premium turnover in FY24 to Rs 734 by FY26E, contributing to EBITDA margin expansion over FY24–27,” added Nuvama (from their research report) : so almost 2/3rd drop in clearing charges.
In Q3 clearing expense is 82 Cr versus 100 Cr in Q2, although revenue went up. Q3 clearing expense is 10.6% of revenue versus 13.5% of revenue. I do not have a clear idea when the contract resizing happenend in Q3, think it was towards end of Nov, - Nov 20th, so the reduced clearing charges impact is only partial. If Nuvama is correct, then reduction could be as much as 2/3rd. The 100 Cr for Q2 is for all segments, so not sure what was derivatives share. 2/3rd of this cost might be the saving on a full quarter basis for similar volume.
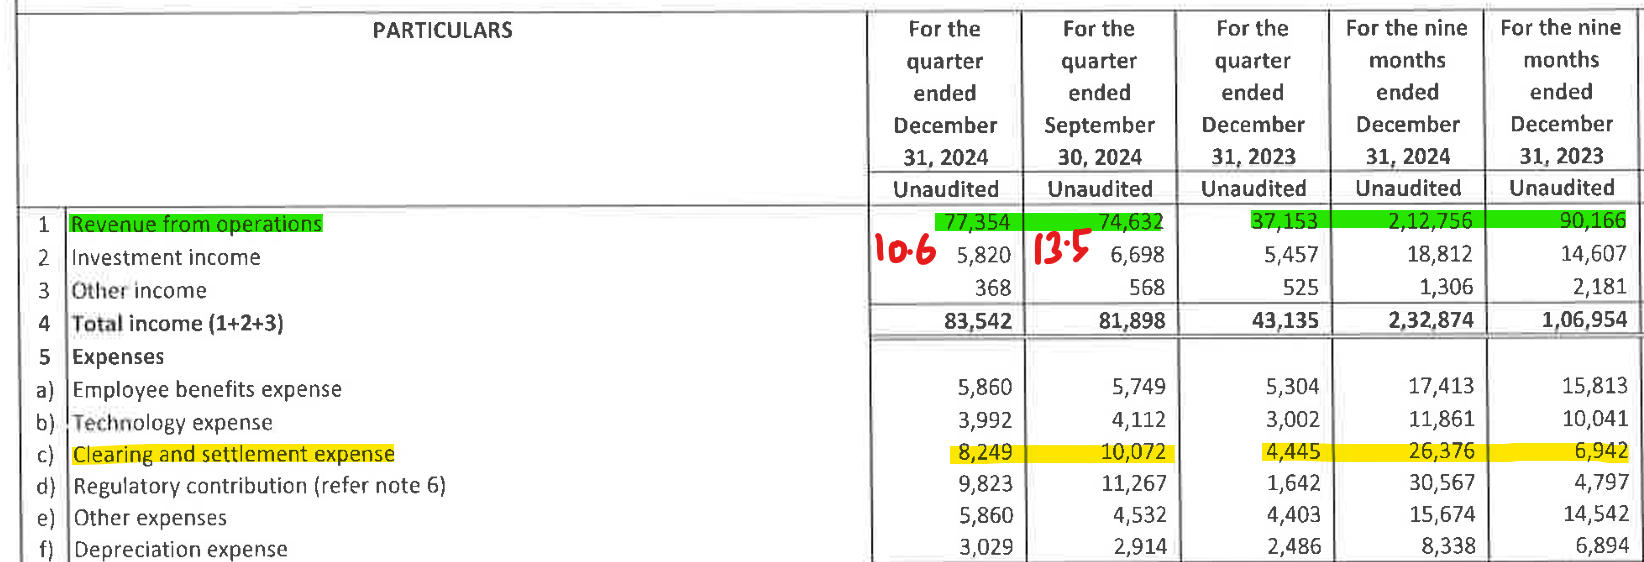
4 Likes
Clearing cost is proportional to total no of contracts ; Total no of contract traded in index option has reduced by 19% in Q3 vs Q2 and so is clearing cost
| Month | BSE |
|---|---|
| Month | Total Contracts |
| Jan-25 | 2,17,71,14,399 |
| Dec-24 | 2,24,21,49,929 |
| Nov-24 | 2,49,01,73,665 |
| Oct-24 | 3,19,85,22,760 |
| Sep-24 | 3,54,46,40,191 |
| Aug-24 | 3,16,92,01,397 |
| Jul-24 | 3,05,03,73,448 |
| Jun-24 | 2,58,88,33,408 |
| May-24 | 2,89,49,27,177 |
| Apr-24 | 2,22,43,42,823 |
| Q3 | 7,93,08,46,354 |
| Q2 | 9,76,42,15,036 |
| Q1 | 7,70,81,03,408 |
1 Like