
Please use this topic to archive complete articles if found useful to retain & absorb - along with source information.
Excerpts from howmuch.net on US Economy. Enjoyed the “Visualisation” that simplifies immensely - by presenting the Big Picture - with embedded details for the data-hungry. I am happy with the Big Picture, itself.
[It’s as if for the first time …I understood what is meant by big picture!! Kind of jaw-dropping for me, to see how much can be conveyed, in such simple, powerful ways]*
The U.S. economy may be in the middle of its largest expansion in history, but record levels of debt could signal trouble on the horizon. In February 2019, the U.S. national debt reached a record $22 trillion, and the annual deficit for this year alone is expected to be almost $1.1 trillion. At the consumer level, household debt (which includes mortgages, auto loans, student loans, and credit card debt) has risen for 19 straight quarters. With these overarching trends in mind, we compiled 10 of our recent visualizations to show a more complete picture of debt in the U.S. Here’s what we learned.
- The national debt has rapidly increased over the past 40 years, doubling in the past decade alone.
- The U.S. has one of the highest debt-to-GDP ratios in the world.
- In general, the governments in larger states incur more debt than the governments in smaller states.
- Millennials have higher debts than other generations like Gen X and Baby Boomers.
- The type of debt that consumers incur has changed over time, with mortgage debt decreasing over the past decade and student loan debt increasing.
1. How Has the U.S. National Debt Changed Over Time?
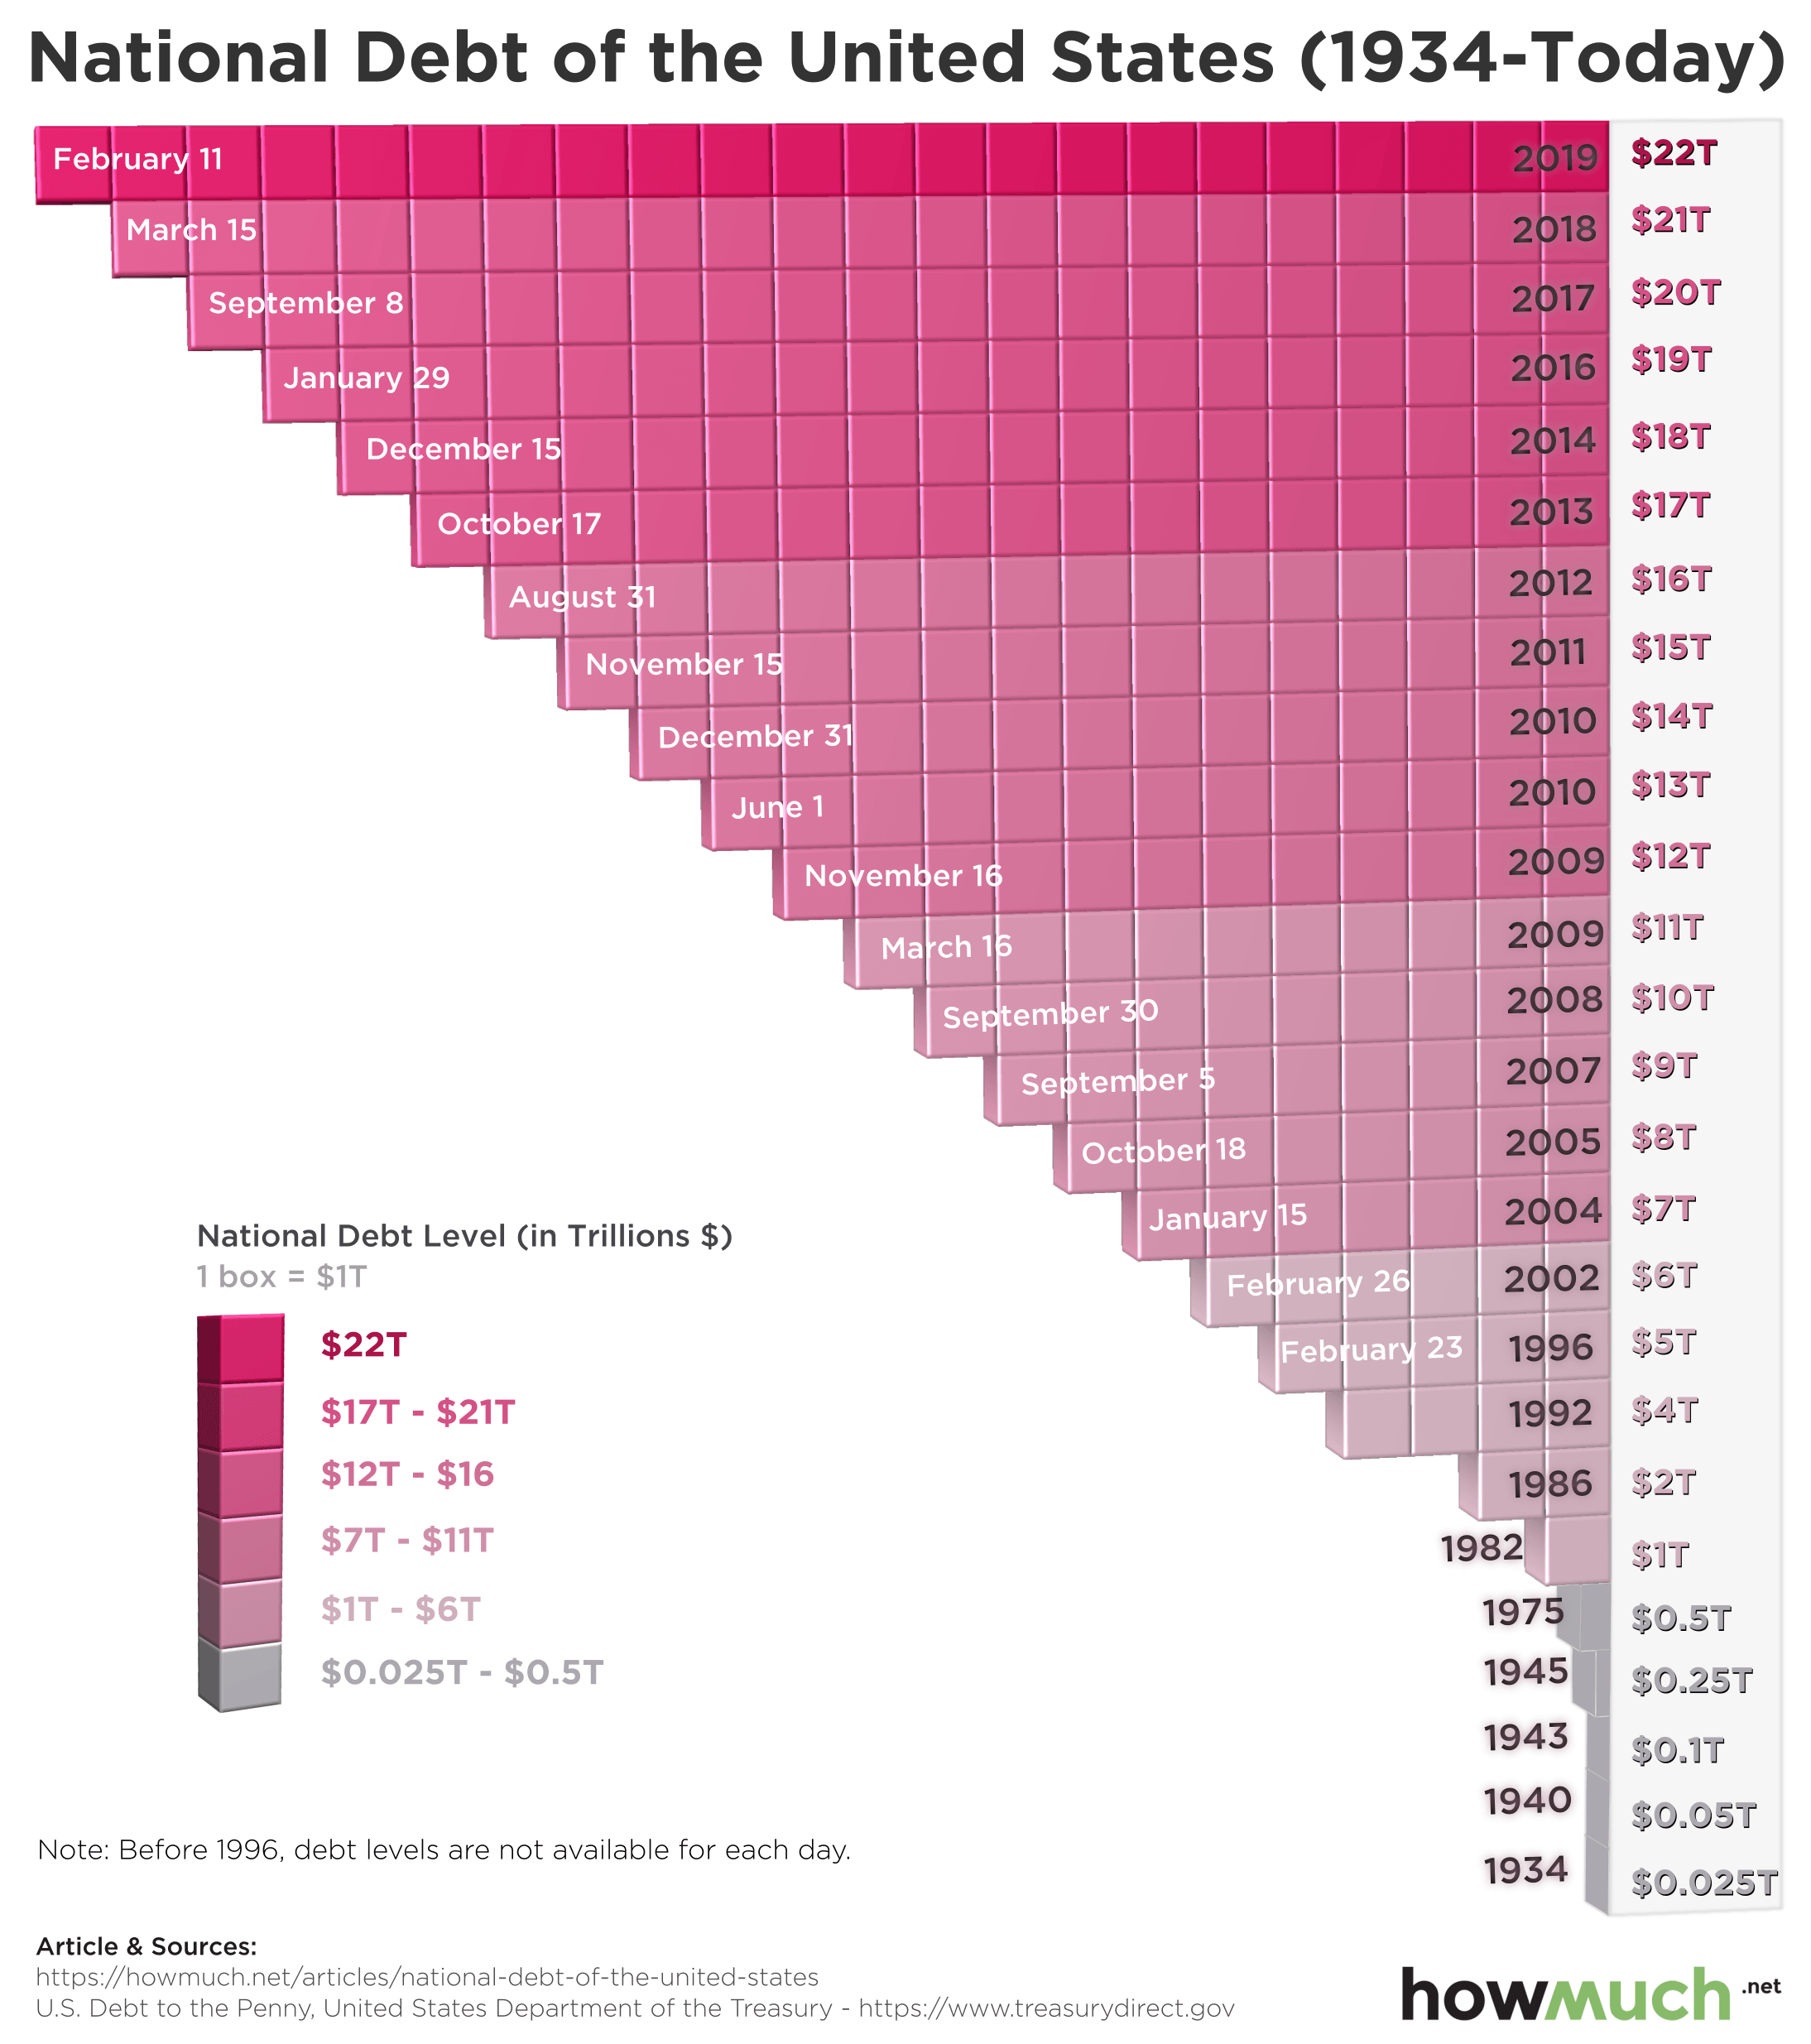
The visualization above references data compiled by The Balance from the Treasury Department’s “U.S. Debt to the Penny” report to map how much the national debt has grown since 1934. The national debt was only $25 billion back then, and it stayed below $1 trillion until 1982. After that, the national debt increased exponentially from the 1980s to the 2010s, eventually leading to the $22 trillion mark where it is today.
2. Who Should Be Blamed the Most for The Increase in National Debt?

Another way to analyze the increase in national debt is to view it in conjunction with the political leaders of the time. According to other research conducted by The Balance, the national debt soared under certain presidents. This visualization shows how much was added to the national debt during each presidency, with each block representing $3 billion in current dollars. As shown in the previous visualization, the majority of the national debt was accrued over the past 40 years. More specifically, Reagan added $1.86 trillion, George H.W. Bush added $1.55 trillion, Clinton added $1.4 trillion, George W. Bush added $5.85 trillion, and Obama added $8.59 trillion. Trump is expected to add $4.78 trillion to the national debt during his first term. The only presidents in the past century who saw a decrease in the national debt are Warren G. Harding and Calvin Coolidge.
3. Which Foreign Countries Hold the Most U.S. Debt?
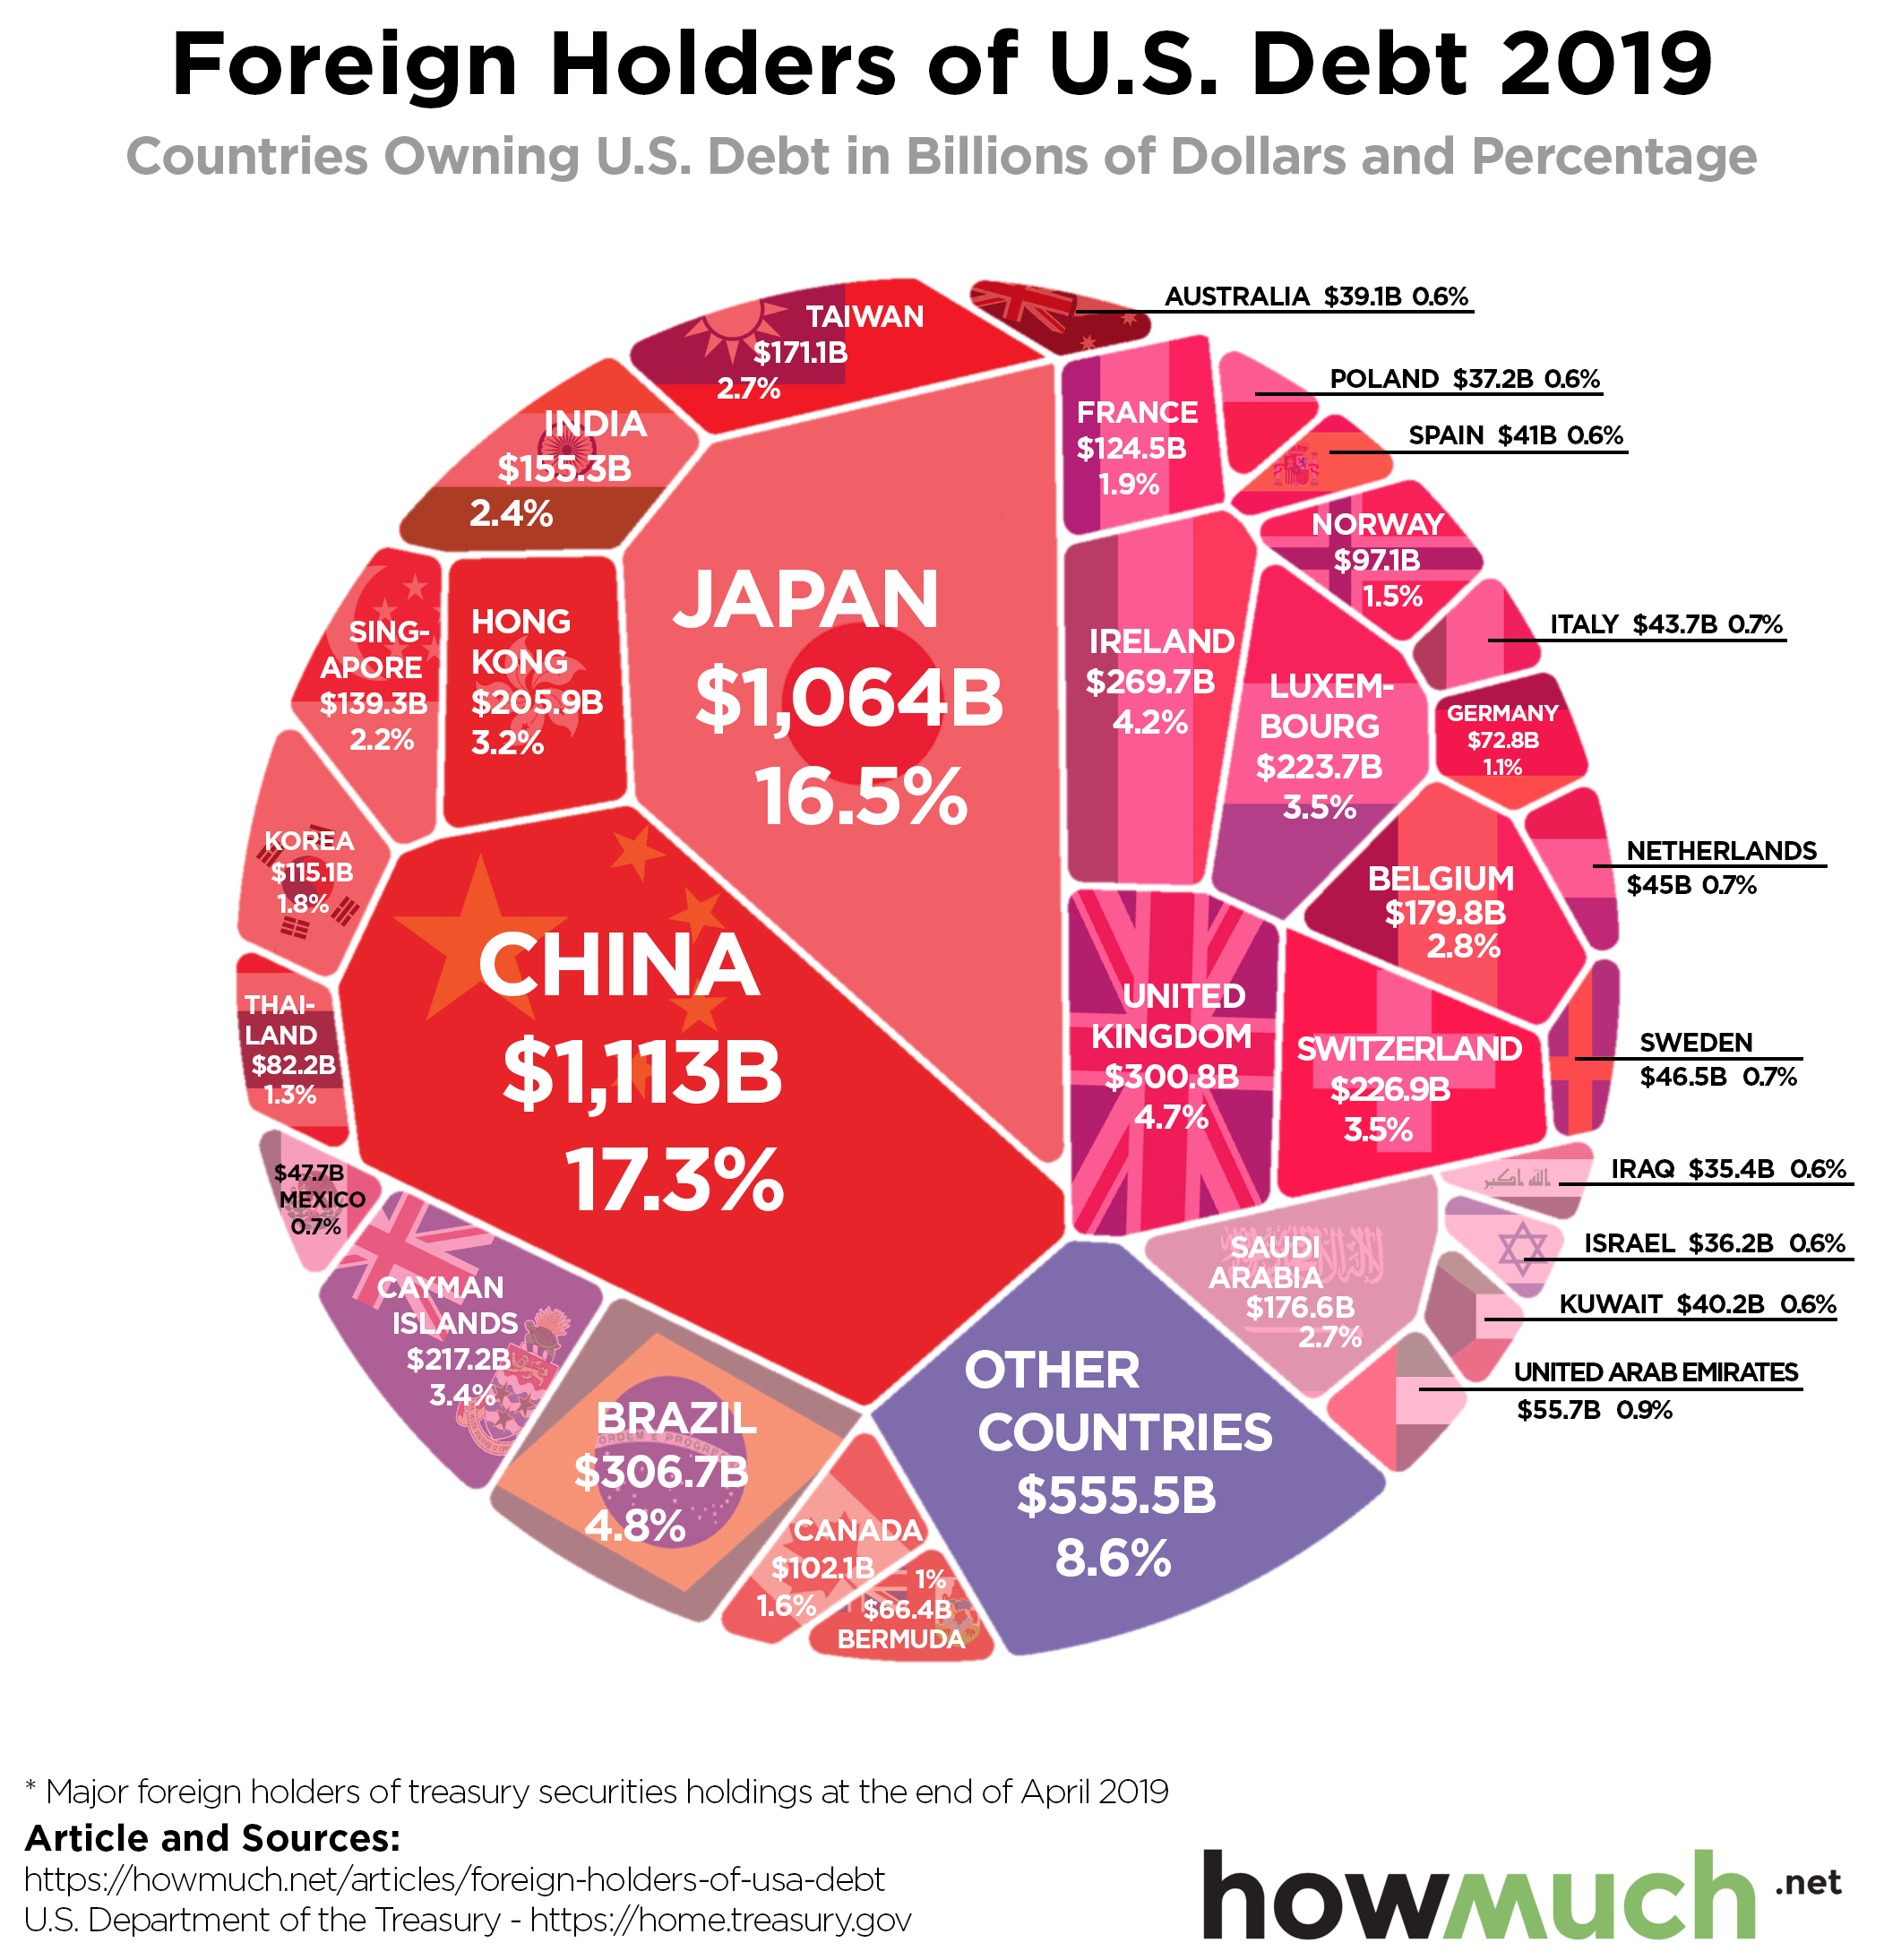
The national debt is financed by the sale of treasury securities, specifically short-term treasury bills and long-term treasury bonds. While many treasury securities are held by the American public and government agencies, foreign countries are some of the bigger holders of U.S. debt. According to the visualization above, both China and Japan each hold over $1 trillion in U.S. debt, accounting for roughly one-third of U.S. treasury securities owned by foreign countries. The data for this visualization comes from the Treasury Department’s database for Major Foreign Holders of Treasury Securities, as of April 2019. Altogether, foreign countries hold more than $6 trillion in U.S. debt.
4. How Deep in Debt is the U.S. Compared to the Rest of the World?
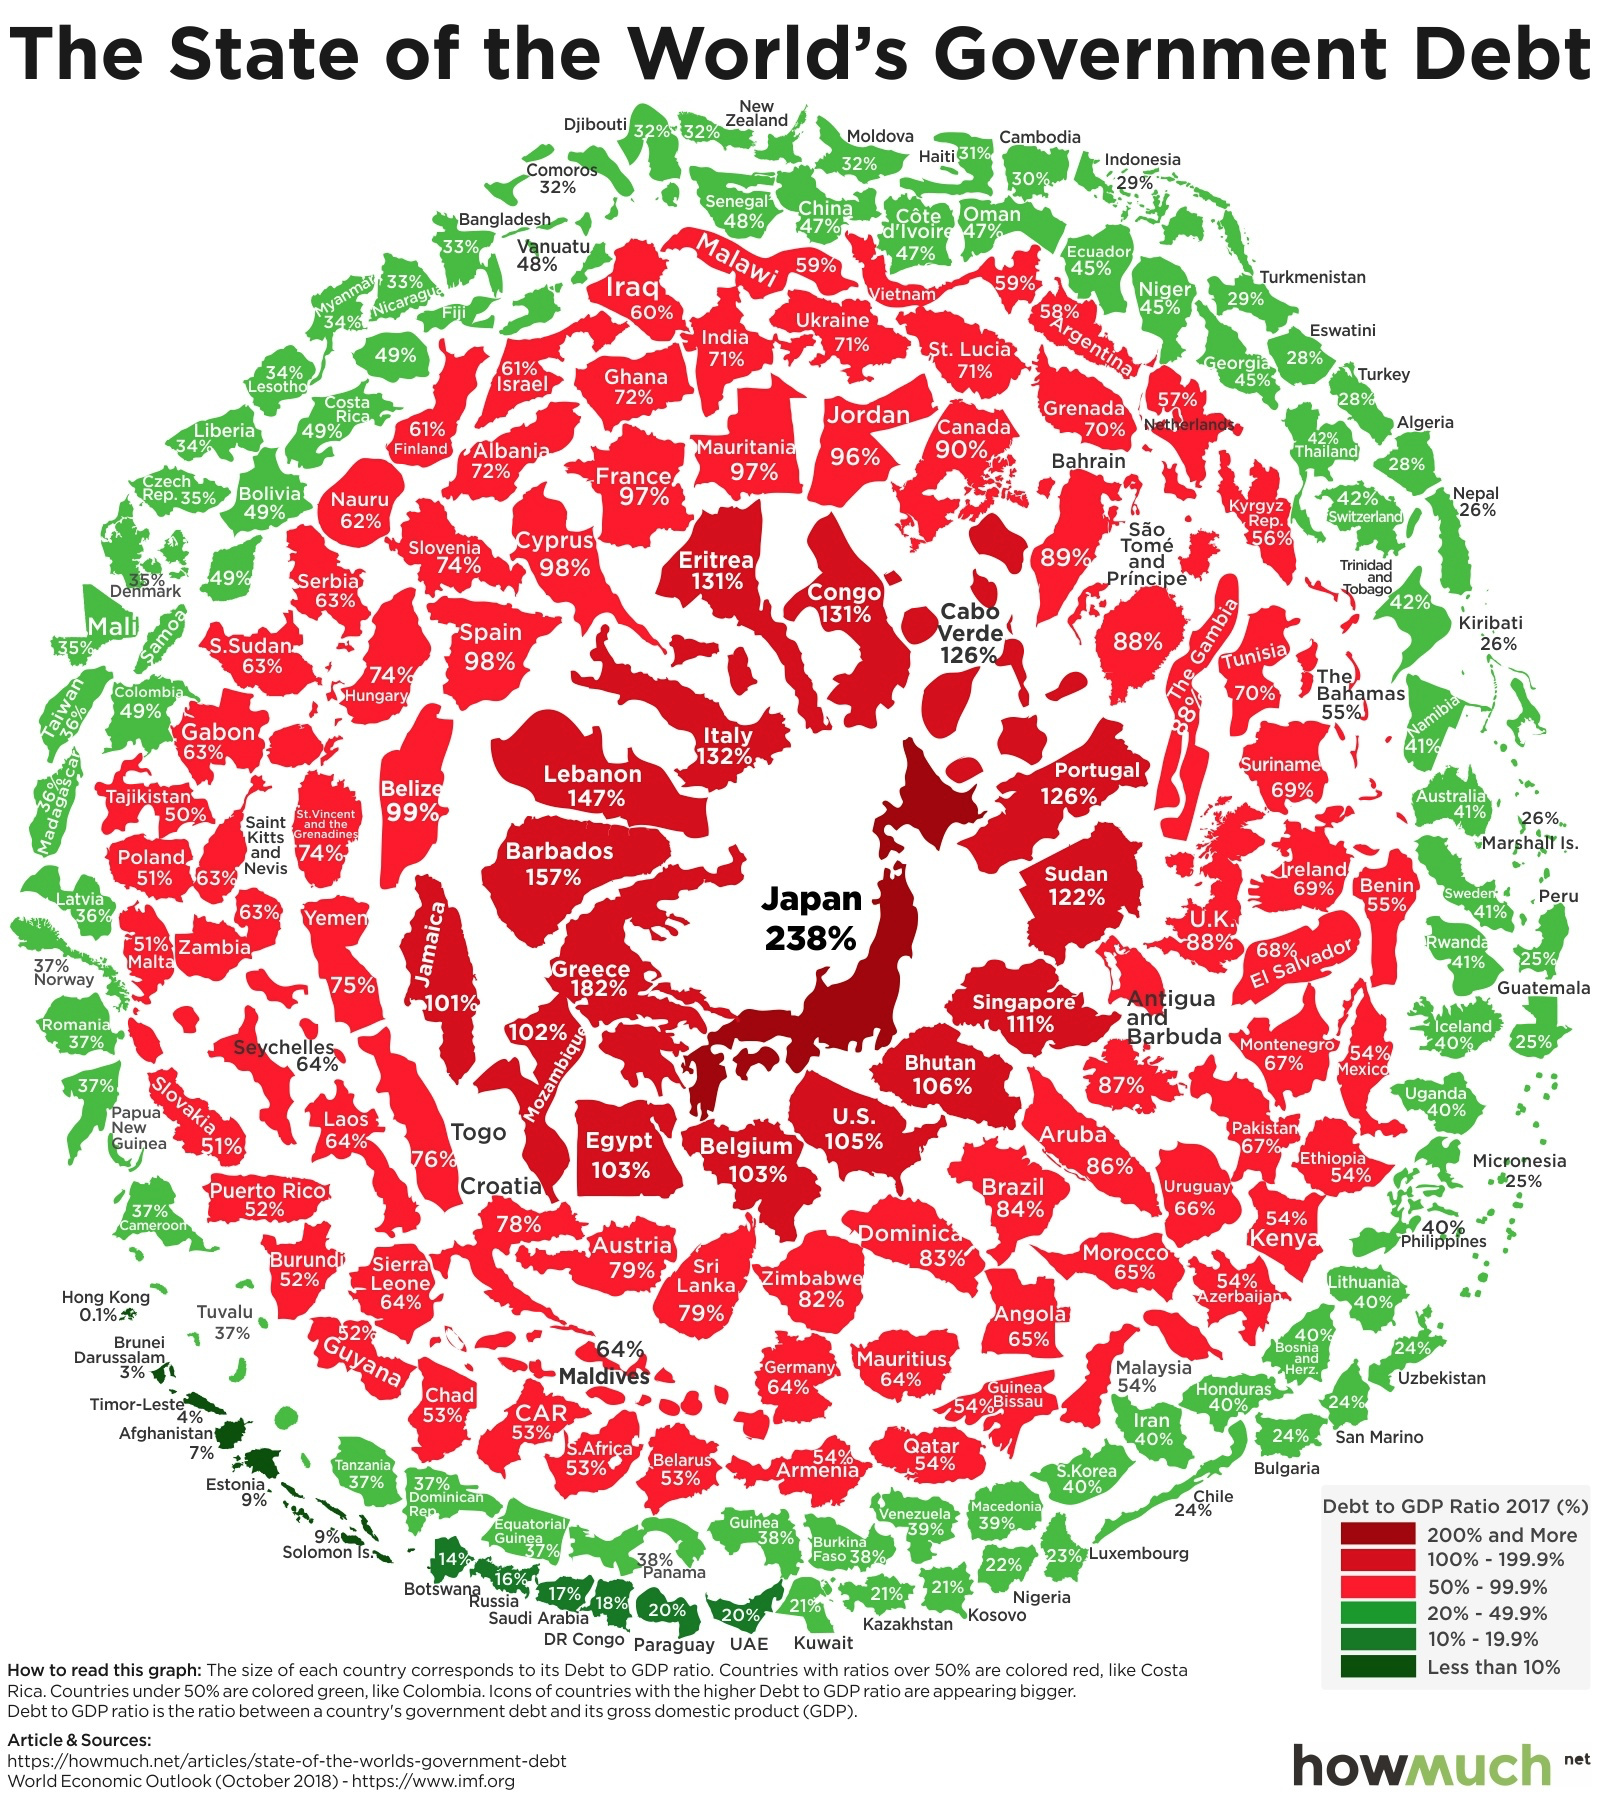
The good news is that the U.S. is not alone in its accrual of debt. While the U.S. national debt of $22 trillion is truly staggering, the country’s economic output is also much higher than other countries’. The best way to compare different countries’ national debts is to use the debt-to-GDP ratio, which compares a country’s output with its debts. The visualization above uses data from the International Monetary Fund to illustrate debt-to-GDP ratios between countries, with the larger, redder countries toward the center representing the highest ratios. The countries with the highest debt-to-GDP ratio are Japan, Greece, and Barbados. By this measure, the U.S. ranks 13th.
7 Likes
Primer | The rage called Modern Monetary Theory - Moneycontrol.com
Amol Agrawal
After Thomas Piketty’s works on inequality, if there is something that has stormed the economic world, it is Modern Monetary Theory (MMT). Just like Piketty, MMT has achieved both a rock star appeal and invited criticism from economists. The social media is rife with discussions on MMT.
What is MMT? Actually, it is not a modern theory of money as its term suggests but a combination of several historical ideas on evolution of money. There are broadly two thoughts on the advent of money. The first is that money evolved naturally (or spontaneously) as humans figured money as a better way for exchanging goods and services compared to barter. The second is that money evolved due to the State which via its system of taxation and expenditure led to money. The state by its authority prescribed only a certain form of money as legal tender and accepted its taxes only in that legal tender, leading to certain forms of money having precedence over others.
MMT takes its origins from the second thought and takes the idea forward. The core of MMT is that as the State has monopoly over currency (via the central bank), it can run its deficits without bothering about any constraints to finance the deficit. We usually think that government receives taxes first and then spends but MMTers say it is the opposite: government spends first and then receives the taxes. In fact, its adherents say that government borrowing is a “misnomer” as the government is getting its own issued currency notes and nobody can borrow its own notes. The MMTers further argue that based on this reasoning, the government can finance infrastructure projects and even fund job guarantee schemes to remove involuntary unemployment.
For many economists, MMT reads like the often criticised policy in economics called debt monetisation. Under debt monetisation, the government monetises its debt by issuing bonds and asks the central bank to buy those bonds. This is what was happening in India too. In the 1950s, the government initially asked RBI to monetise its debt which became automatic as the debt was financed continuously. This resulted in the government not caring about its widening fiscal deficit, resulting in high inflation. The 1991 crisis is often seen as a fiscal deficit crisis first before it became a balance of payments problem. As part of the 1991 reforms, RBI and government phased out this practice, ending it in 1997. In fact, this problem of deficit financing was not limited to India alone but has been a bane of many countries. Most episodes of hyperinflation also go back to similar linkages between debt and money.
Given this broad sweep, why would MMT folks support these ideas? The answer is conditions in developed countries have surprised the economists. As the global financial crisis hit world economies and central banks cut rates to zero levels and infused liquidity like never before, there was a feeling that inflation would soon hit these economies. After all before MMT took centre stage, the quantity theory of money held that too much money leads to more inflation in the economy. However, this has hardly been the case with most developed economies struggling with low inflation. The economists are debating whether the Phillips curve has flattened, which means that a large change in unemployment will only bring about a marginal change in inflation. This is quite surprising as it was felt central banks could easily create inflation but it has not been the case despite large scale monetary infusions by these institutions.
Another variable which has surprised is the low interest rates on bonds. It was widely felt that with rising debt and deficit levels in developed economies, interest rates on bonds will increase sharply. However, this has also been missing with the yield curve remaining much lower than expected.
Both missing inflation and lower than expected interest rates have led to the emergence of MMT. The supporters say that as inflation has been absent despite high debt and monetary stimulus, it shows MMT has been working. They also draw inspiration from the Japanese case where despite years of monetary easing and high debt levels, inflation levels have barely increased. Thus, they argue the US could also take advantage of similar conditions and its government could spend without worrying about inflation.
In fact, what MMTers have been saying is not very different from mainstream economists such as Lawrence Summers and Olivier Blanchard. Both have been arguing that the US government should take advantage of lower interest rates and issue more debt to finance the next generation infrastructure, education demands and so on. Hence, both camps believe that the US should take advantage of this situation but the modes of financing are different. The MMT camp believes that spending can be financed by the central bank whereas the mainstream camp believes it can be financed by financial markets.
The supporters of MMT draw their inspiration from JM Keynes, Abba Lerner and Hyman Minsky, whose works have become popular during the financial crisis. Currently MMT ideas are led by economists such as Stephanie Kelton (Stony Brook University, also an adviser to US presidential candidate Bernie Sanders) and L Randall Wray (Levy Economics Institute at Bard College). Their ideas have got even more criticism as they represent mainly heterodox schools. Summers recently dubbed MMT as fallacious and remarked that “these new ideas are being oversimplified and exaggerated by fringe economists.” They also criticise that MMT would lead to hyperinflation. This is unduly harsh and mean as Summers himself has similar ideas as shown above. Second, ideas can come from anywhere and history tells us fringe ideas eventually go onto rule the world. Third by naming them fringe economists, we are again seeing the mainstream economists make the same mistake of hubris and arrogance they showed before 2008 crisis.
In my view, MMT is neither modern nor a monetary theory really. It is more like this special case which can be applied to certain economies given their existing economic conditions. These conditions exist in the US, Japan and some of the European conditions. Neil Irwin recently commented in the New York Times that MMT should first be tried in a small country as applying it in the US would be risky given its size. But then it is difficult to find any such country. The small emerging markets are unlikely to try it as most have suffered inflation due to similar fiscal ideas. Even some of the European countries are likely to reject it given their history of hyperinflation. Japan could be interesting but it is going through its own problems and has already done many policy experiments to get out of the situation. Thus, it is only US where these ideas can be applied and that is also the place where it is being widely discussed as well.
Amol Agrawal is faculty at Ahmedabad University. Views are personal.
5 Likes
1 May 2020 Edit Note: This is the first part of the interview transcribed so far by me. It was something that got me hooked to thinking structurally better …on macro issues. Will get down to transcribing the other half soon…got distracted from this important mission …by many other deliverables.
Meeting Notes – industry veteran and keen watcher of Market Cycles.
8th Apr, 2020
Q1: Sir, the sharpness of the recent fall has taken everyone by surprise, most of us were caught napping. We scrambled to take corrective measures. And then while everyone has taken note of 1st order effects, we are unclear about how and in what timeframes 2nd order and 3rd order effects will come into play.
We also realise that at VP we are weak at observing and understanding Market Cycles. Thought it was the right time for us to get initiated into understanding the Macro situation/impact better. Thanks a lot for talking to us, and giving us the opportunity.
A1: Sure. Lets get started.
Three Aspects to Macro Understanding
- Global Economy – In particular US, EU, China and RoW
- Domestic Macro – Government, Central Bank, Economy
- Corporate Credit Cycle (Industrial …., Structural ……to be cleared)
All three exert different level of impact on Portfolio stocks partly due to a) sector they belong to b) their user Industry demand drivers.
India’s GDP 81% is domestic driven, and 19% is Exports driven. On global contraction, 1st order thinking will indicate Exports will suffer. But then IT Exports is different and Textiles Exports is different. Again, for a sector like Chemicals – it accounts for only 4% of domestic GDP – but there are 2nd order demand drivers from the Global economy!
So we have to look at the Sector’s composition, and global/local demand drivers that we have to look at – at least, to get some sense of impact of Covid 19 – And these will probably be different for different businesses, even within the same sector.
Q2: Great, this gives us important clues on how to start thinking. If you were to get us started in a more structured way, how would you suggest we go about it?
A2: I can certainly share with you a video slide presentation where we have captured our thoughts, updated with user Q&A generated aspects, and use that as the backdrop for our discussion this evening.
Q3: Great Sir, really grateful for the opportunity, your valuable time. That will be wonderful, if you take us through the slides, as you elaborate.
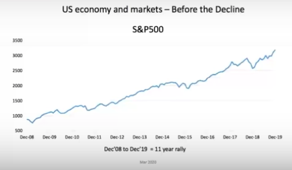
A3: Let’s look at the first slide. This captures an 11 year rally, probably the longest rally in US the last 60-70 years, also the sharpest. Valuations rose phenomenally, even by US standards, almost 400+%. If we take just one year, i.e. last year, US GDP grew by about 2.1%. In a $20T economy, 2.1% or $400Bn is not small, but should be seen from the context that Corporate Earnings growth last year was flat. And in the few years prior, corporate earnings grew by 6-7-8% which was good, but we all know there were big tax savings (rates declined from 40+% levels to 20-25% levels), as also large interest savings as rates declined dramatically, in last 2 years.
No Corporate Headroom to Grow
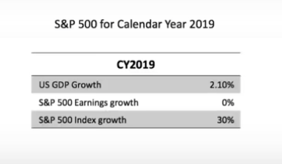
So, if we look at last year again even with the backdrop of flat corporate earnings growth, S&P 500 index went up 30%. Very very sharp one year 30% rally. One could make a case probably that this recent fall is not entirely due corona virus, probably it acted as a catalyst to bring down valuations that even otherwise needed a crack.
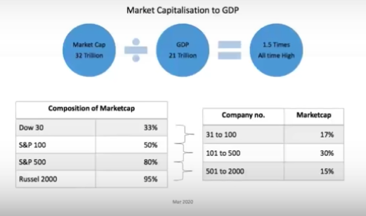
Now before the fall, US Marketcap was ~$32T to a GDP of $21T or about 1.5x which is again an all time high, higher than 2008 pre-Lehman crisis. Almost one-third US Market Cap was accounted for by Dow-30, Top 100 companies accounted for 50% and 80% by Top 500 companies. This is relevant to note to get the context right (and note the significance of this number) for Indian Markets that we will come to later, and appreciate why Indian Markets and US Markets need to be looked at a bit differently?
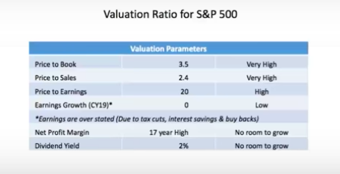
For Equity Markets, Valuations were at peak levels, as we can see from the slide above. Earnings as discussed before (in previous years) were optically higher because of tax savings, interest rate cuts, and leveraging the balance sheet by doing buybacks, and reducing equity. Margins were at 17 year high (2018 levels). Yields at 2% again were at historical highs. No room to grow. And a different matter altogether that earnings growth in the last year was zero/flat.
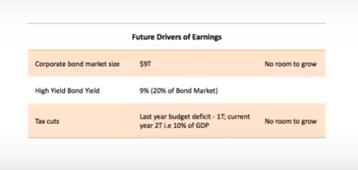
It may come as a surprise to many of us that only follow Equity Markets closely, that the same story prevailed in Bond Markets. Perception may be that US Corporate BS is very strong and US Corporates are underleveraged, looking at some of the top companies. However picture is different if we look at the US Bond Market, currently at $9T, at all time high, with fully leveraged positions.
A more complete US debt picture (though a bit dated) is collated here.
Q4: To get the perspective right, what was the Corporate Debt levels at the height of Lehman crisis, as compared to this $9T?
A4: Think that was $5T at the height of the Lehman crisis. And now we are at higher than $9T!
Almost 20% of this Bond Market is trading at near double digit yields, maybe indicating troubles ahead?
Q5: Sorry to interrupt, but could you explain the implications a bit more?
US doesn’t have any Monetary policy headroom, nor the Fiscal headroom
A5: When QE (Quantitative Easing) was started during GFC (Global Financial Crisis), the Fed started buying bonds to inject money into the Financial system. Whole of 2008, Fed was buying Treasury Bonds. This time round, however Fed is not buying Treasury Bonds (they are saying its not the Fed’s job). They were pushing the Banks to buy more Corporate Bonds. But Banks are reluctant owing to their own issues. So the Fed is ending up buying Corporate Bonds and ETFs. This has happened for the first time in the history, of US $Bonds.
Whereas US fiscal deficit situation last year crossed $1T, and is now expected to cross $2T -$2.5T (as of last week) at the rate this government is doling out, which is like 11-12% of fiscal deficit (US GDP, $21T). Not much room the government has, to continue doling out!
Q6: And if we were to look at the Indian Context with a similar lens, how would you put it?
A6: Yes, lets bring in Indian situation in, the last 4-5 years. Even though GDP growth in nominal terms has been going down from 12-11-9-8%, our Tax collections have been growing at 17-18% per annum for the last 5 years. As the Tax collections went up, Government expenses did not go up proportionately! Fiscal deficit was 5.5% in 2014 and it is 3.2% last year. Incremental tax collections came to the rescue for reining in/meeting the fiscal deficit targets.
This year Indian GDP is $2.8T. 3.2% deficit is like ~5 lakh Crores. From a GOI Standpoint, it might be right in thinking that it has the fiscal room to say, spend 5 Lakh Crores additionally, that would only move the fiscal deficit back to 2014 levels (5.5% of GDP, vs. US 11-12% of GDP).
That is the luxury US Government doesn’t have today, with Tax rates coming down significantly, and all 3 arms – Buyer (Banks), Seller (Corporates), and the Financial System (Fed) fully leveraged. Unless one of the arms unwind, the system can’t move ahead!
To give you a similar Indian context again, this is like the Mumbai Real Estate market. Financial System (Banks) fully leveraged. All sellers fully leveraged. Buyers/Speculators highly leveraged. One of the 3 has to break!!
Q7: Thank you for so beautifully weaving the Indian Context in. Some of this is actually beginning to sink in, for me now! Let’s get back to the presentation.
Typical Value Investor Actions
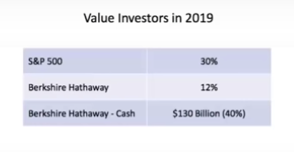
A7: So, while the longest rally was on, what were typical value investors doing? Many Value investors in that market are on 30-40% cash levels. If we look at last year, where index went up by 30%, people with very long-term track record like Berkshire Hathaway, portfolio went up by about 12%. They had moved $100-130 Bn in Cash, which is like almost 40% of Portfolio.
When most sophisticated Global investors (including from India) were flocking to the US Market (clocking 30-40% growth), Resident US investors with long-term focus chose to be significantly in Cash. And that was mostly in T-Bills earning 0.5 to 1% yields.
The reason cited for moving so much into Cash being expensive valuations, it has been an observation historically that on most occasions (similar actions, and) when Birkshire Hathaway has underperformed the Index by a significant margin, subsequently the Index has declined!
Signal 1: Contraction of Global Economy
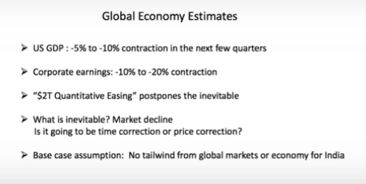
One signal that is probably coming out clear is that Global economy contraction is NOT a possibility anymore, it’s a reality! The size of the contraction may depend on how the virus situation, its containment and lifting of lockouts, play out eventually, but -5% to -10% contraction to US GDP is a number being put out by various people. EU contraction expected slightly higher than this. Earnings hit to businesses is expected to be dramatically higher.
Some of the supportive measures like the $2T QE by Fed and some more by EU may serve to postpone, but what is inevitable is Market decline. A sharp 30% correction, or range bound for 2-3 years with lot of volatility and no returns.
The base case assumption can be easily made that we can NOT expect any tailwind from the Global Markets/Economy for India.
Q8: Before we go on to India specific impacts, could you please outline Global Economy composition, possibly different contraction rates for some of the other major players, and reasons for continued contraction in US/EU Markets to get a better handle on this?
A8: Right. Global Economy is ~$80T today.
Of this US and EU accounts for ~50%; US $21T, EU $18T
50% of Global Economy is expected to contract between negative 5-10%.
There will be negative news flow for some time 3m-6m maybe, or more as Coronavirus containment takes its time. However post coronavirus, it cannot be expected that US Market returns to normal; it was over-heated from much before. What is inevitable is that excesses in US Markets will get corrected. May take little more time, if say another $2T QE is put into the Bond Market. But that is NOT too critical for Indian Markets in my opinion.
China $14T, Japan $6T, India $2.8T, RoW comprising the balance 50%.
Some like China, India are expected to contract for 1 or 2 quarters, before slowly limping back to normalcy, post Coronavirus. We may see overall global economy contracting by say negative 2-3%, is what some of the numbers being put out are saying.
Q9: How should we take this into account, while thinking for ourselves, on what lies ahead in Indian Equity Market?
A9: Should we be really that concerned on the Indian Economy? Don’t think so, let me explain our view.
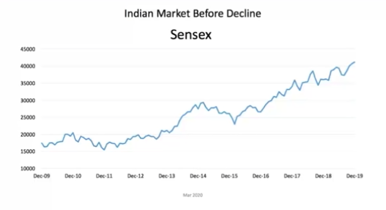
How Sensex fared in last 10 years? We didn’t perform like US Markets but rose about 200-250% since 2009. This picture is of Jan 2020, prior to the Covid crash. Indian Market Cap was at $2.1 T, but of course since then there has been major 20-30% plus corrections since then, but it’s instructive to check the composition of that $2.1T Market Cap.
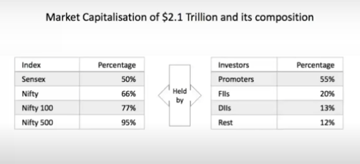
50% of $2.1T Market Cap was 30 Sensex Companies. Two-Thirds came from Top 50 Nifty companies. And 77% of Market Cap is from Top 100 Nifty companies – a totally skewed Market Composition map? This kind of skew is not a recent phenomena. If we take last 20 years – say 2003 share for Top 100 companies was 75%, 2007 was 71%, 2013 was 81%, and now its 77%. So we have been more or less around there – between 70-80%. And Institutional FII presence (Insurance companies, pension funds) would naturally be mostly there as that is 70-80% of Indian Market Cap. Rest of the market companies did not see much Institutional presence/awareness.
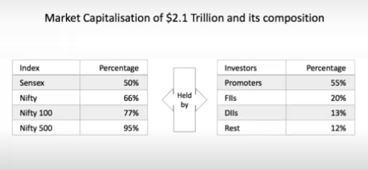
Now this $2.1T Market Cap is held by whom? An interesting phenomena unique to India is that Promoters hold 55% (you wont find many businesses in US with such high promoter holding). FIIs hold 20%, DIIs hold 13%, Rest 12%. So FIIs are holding ~40% of Free-Float. When taken in isolation, this might give the impression that FIIs are dominant investors in our Market pool. But this FII holding (20% holding of $2.1T) comes to ~400 Bn.
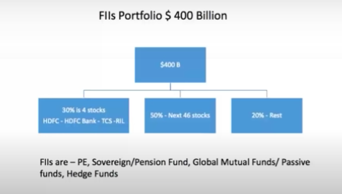
Almost 30% of this is in just 4 stocks – HDFC, HDFC Bank, TCS & RIL. Another 50% is invested in balance 46 stocks in Nifty 50. Effectively 80% of FII investment in India is in just Nifty 50 companies. Only 20% investment is outside Nifty 50 companies. So FII influence in non-Nifty companies is relatively much less, may be in few pockets only.
Not all FII money is the same colour. Among the FII Pool, there are Private Equity Funds, Pension Funds, Insurance Funds, Sovereign Funds, who take relatively long term calls 5, 10 years, some even 15 years, some have done very well too.

And there are Hedge Funds, Passive Funds, Index Funds, Global Mutual Funds who are basically asset allocators. They take derivative calls, hedged calls, short term calls, trading calls. Most of these calls – their experience in Indian Market has been terrible. There’s a beautiful study done by IIMB which shows if someone had mimicked such FII calls – bought and sold every time these FIIs bought and sold, the 7 year returns would have been zero, negative even!
And the timing is perhaps more influenced by their liquidity position, than India fundamentals (basically liquidity is good if past performance is good). On the other hand domestic funds have performed much better.
23 Likes