
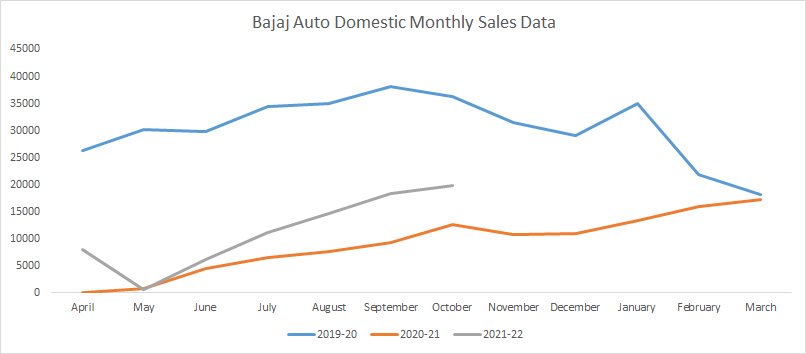
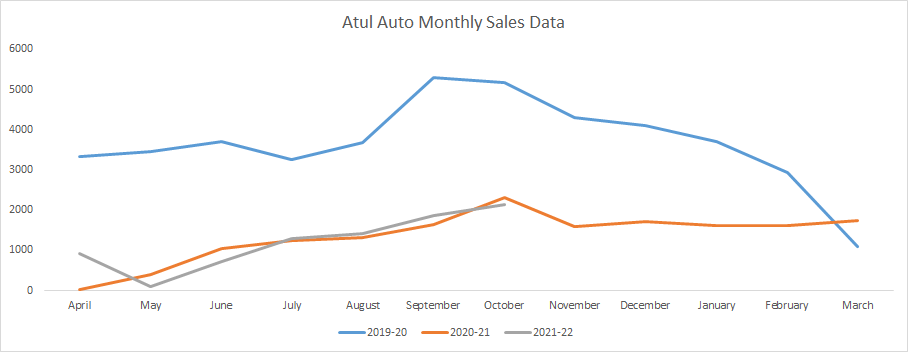
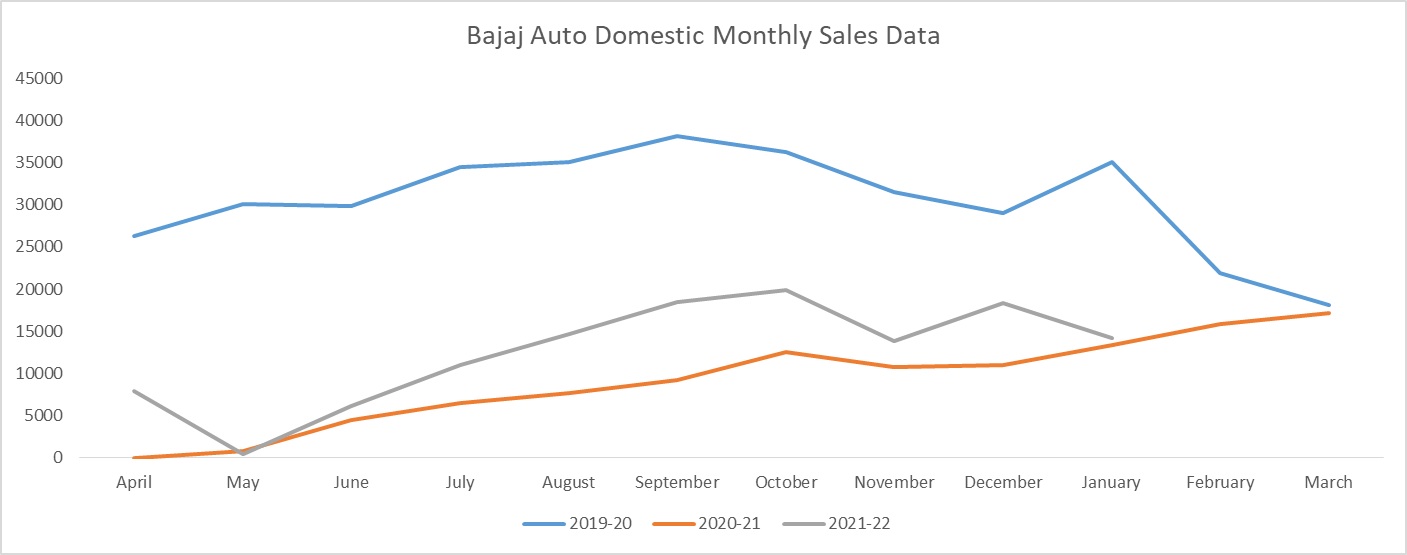
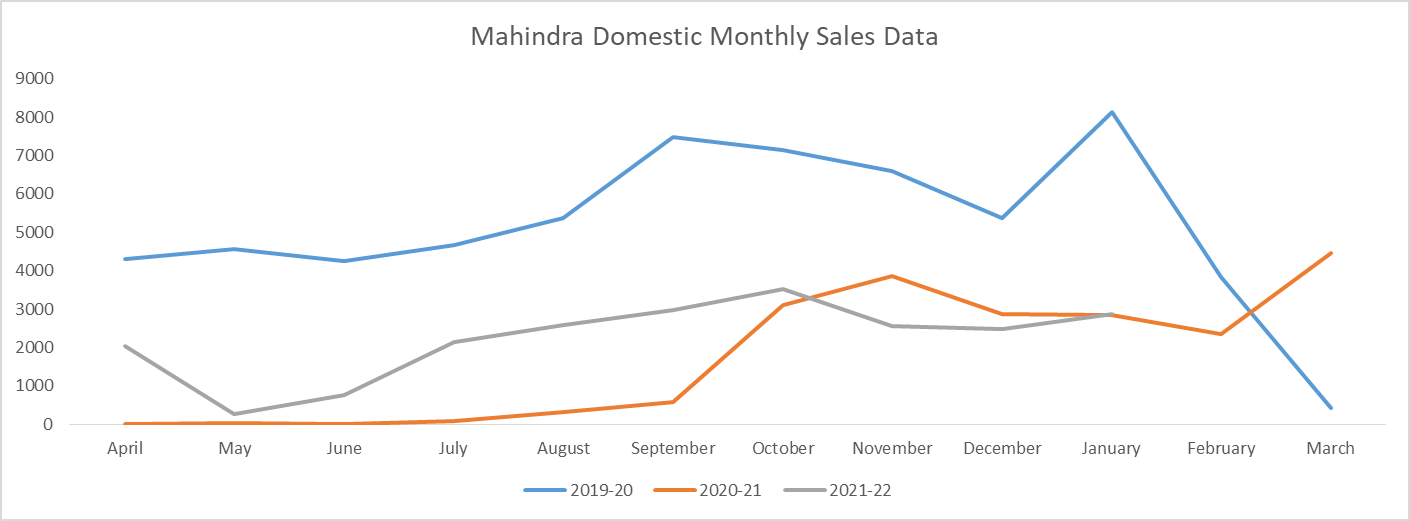
It is important to look at auto sales in comparison with someone like bajaj. Atul is actually not doing too badly considering Bajaj is market leader and accrues the benefits of that.
1 Like
Understanding the ‘Disruption’ in 3 Wheeler Market
The current 3 wheeler EV, which is powered by lead acid batteries, is not right alternative for conventional vehicles. The lithium ion battery EV will be right alternative to the conventional vehicle.
There are lithium ion EV 3 wheeler players in market right now, even Atul has a few experiments going on. EV powered with lithium ion battery is still expensive. Expect in a few years when product is proved in market and availability of financers is there then can expect some great volumes from the EV segment.
Believe EV is a virgin market. There is no genuine comparison on competition. Not many known auto manufacturers who have ventured into EV. New entrants making few vehicles is one thing, but continuously producing quality vehicles is another thing. Mahindra, Piaggio, Bajaj, TVS, Atul are seasoned players in conventional 3 wheelers and they have higher chance to do better in EV segment vs newer players.
Also, Auto drivers not educated to the shift to EVs yet.
More importantly, in current environment, there is shift from diesel to alternate fuels – CNG/LPG/Petro. Diesel demand will keep lowering from current levels and there will be a shift from diesel to alternate fuels in urban and semi-urban areas. In rural areas diesel demand will still be there for next few years.
There are lot many excitements and announcements by government on EV, but India is yet to get prepared for the adjustments and reality on the road. There will be gradual growth for EV in Indian context. But until then diesel is being discouraged and alternate fuels like CNG will fill up that demand. Question is how fast? Depends on CNG network. Lots of states yet to set CNG infrastructure in rural and deeper areas.
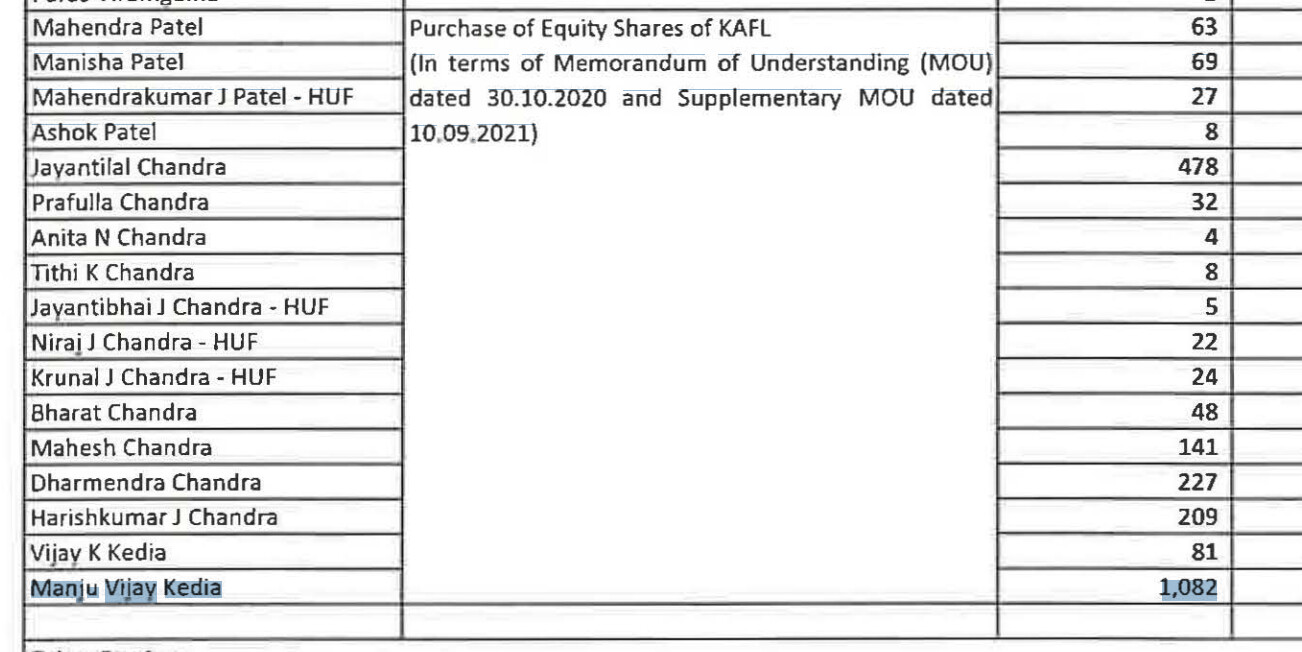
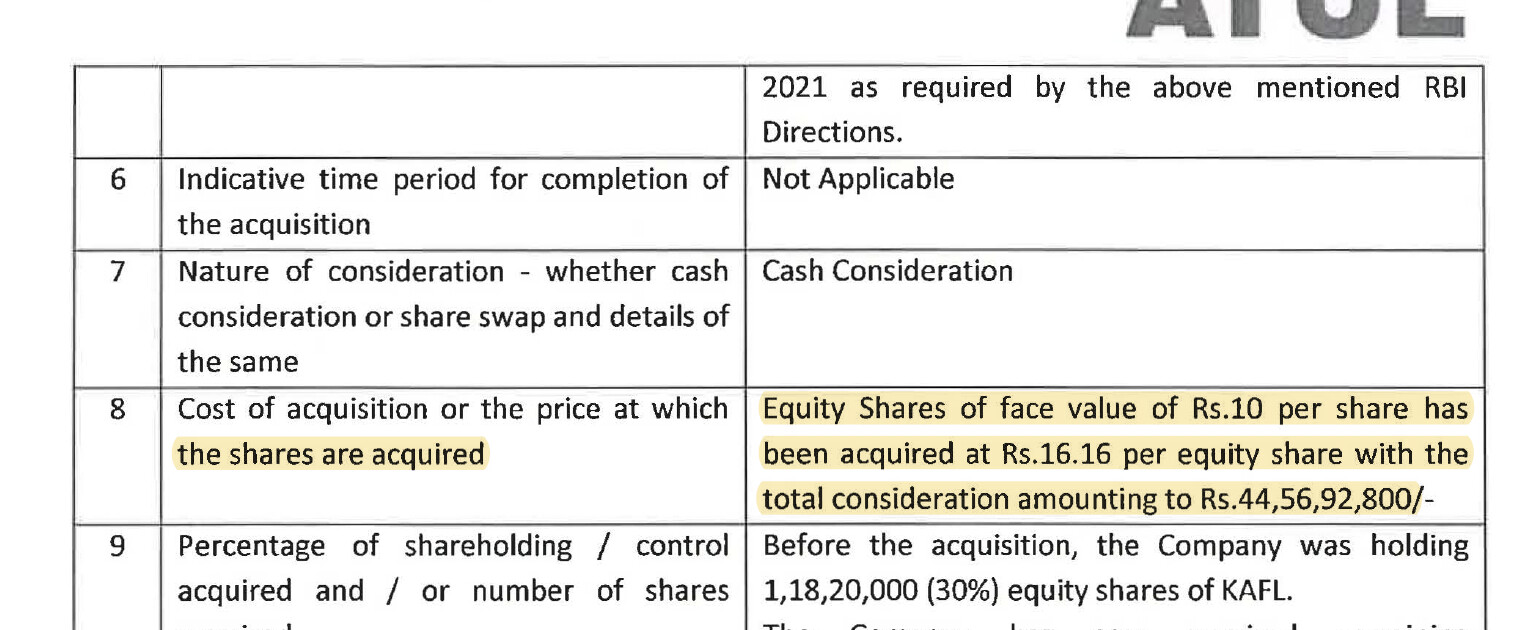
Acquisition of 70% stake of Khushbu Auto (NBFC) by Atul Atul Auto for ~45 Cr is something that requires further investigation. Why?
Although this is not a huge amount for the company, this 70% stake was owned by Promoters / Promoters relatives / Mr Kedia (see below). So, I want to investigate if this transaction is done on arms lenght basis or not?

Now why its difficult to understand this transaction is because of the preference shares issued to the erstwhile promoters of Khushbu Auto (for 70% stake)
So, does it mean that this is a cashless transaction? Atul Auto is not paying 45 Cr in cash , rather issuing preference shares for 70% stake that’s equivalent to 45 Cr and will be paid after five years? I was not able to get clarity if I this is the right way to look at this deal.
By the way, when Khushbu Auto was owned by Atul Auto (30% stake) and Promoter related Parties (70%), why was this deal required at all? They were controlling the NBFC the way they wanted as they were the complete owners.
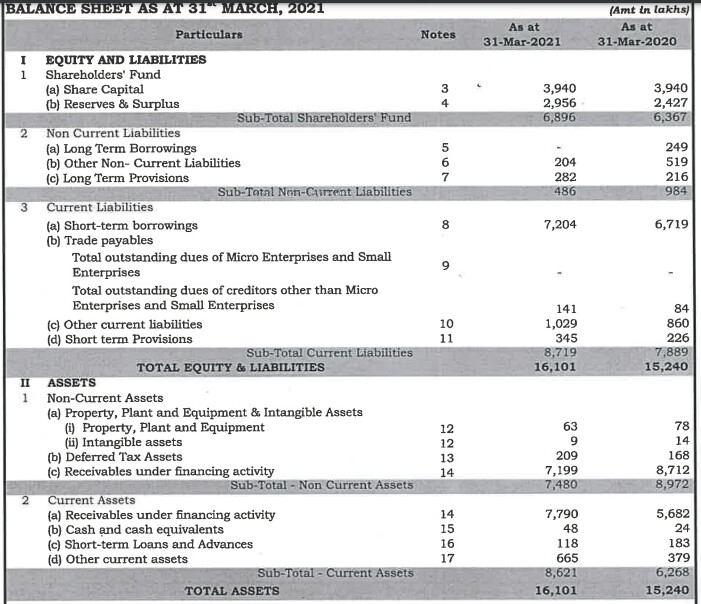
Khushbu Auto is well capitalized based on its balance sheet (below), but still no bank lends it without Atul Auto guarantee (see below). Can it be the case banks get more comfort to lend to Khushbu if Atul Auto has complete ownership? I am not sure, sorry, I have many curious questions but no answers. Please write back if you have more insights:

Khushboo Balance Sheet
3 Likes
I don’t think this understanding is correct, the shareholders of Khusbu finance have been paid out in cash (and not in the form of any preference shares). This is also disclosed in the related party transaction in H1FY22. Manju Vijay Kedia held 17%, Khusbu finance was valued at 63.67 cr. so the 17% should be 10.82 cr. which was the amount paid out in H1FY22.
This is also clearly mentioned in the earlier press release that payment will be made in cash.
Now coming to valuations of Khusbu finance, lets first understand their financial history (compiled from annual reports).
FY17: Invested 6.82 cr. (cumulative: 7.81 cr.); stake brought down to 30% from 49.91%; Khusbu raised 25.8 cr. (3 cr. pref + 22.8 cr. rights issue); disbursed loans of 23.34 cr (1’572 customers); AUM: 32.99 cr.; PAT: 1.77 cr.
FY18: Invested 5.4 cr. through rights issue (cumulative: 13.21 cr., 30% stake); disbursed loans of 100.44 cr. (6’050 customers); AUM: 114.7 cr.; PAT: 8.61 cr.
FY19: disbursed loans of 98.97 cr. (6’592 customers); AUM: 139.8 cr., PAT: 7.64 cr.
FY20: disbursed loans of 91.47 cr. (5’090 customers); Networth: 63.66 cr.; AUM: 146.86 cr., PAT: 3.2 cr. ROE: 5%
FY21: disbursed loans of 64.47 cr. (2’798 customers); Networth: 68.96 cr.; AUM: 152.93 cr., PAT: 5.29 cr. ROE: 7.7%
In FY17-21, company disbursed cumulative loans of ~379 cr. and recorded cumulative PAT of 26.5 cr. Atul auto has invested 13.21 cr. cumulatively for 30% stake + 44.57 cr. for remainder 70% stake ~ 58 cr. FY21 reported networth of Khusbu is 68.96 cr., so the valuations are not out of whack. Now we can comment on the very low ROE made by the company. This is probably more of a function of overcapitalization of the NBFC (d/e of 1x in FY21, 1.09x in FY20). If this d/e was 3-4x (in-line with other vehicle financiers), ROE would have been >15%.
Valuations were appropriate, being complete owners means alignment of interest. Why should a minority shareholder not benefit from 100% of operations of Khusbu Finance when its being managed by the same team as Atul auto.
Hope this clarifies my thought process.
Disclosure: Invested (position size here)
4 Likes
Thanks Harsh, very insightful. This clears lot of questions, except one.
If entire deal is settled in cash, what’s the purpose of Participatry Preference Shares (PPS) that are issued to erstwhile promoters for 70% stake?
Appreciate if you can answer this question.
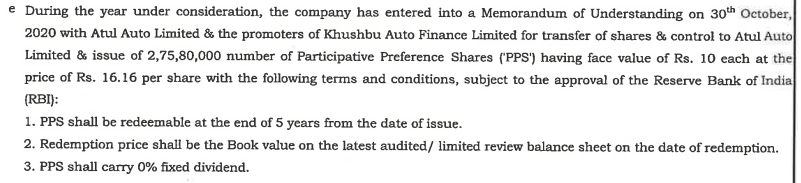
I don’t think PPS were ever issued to promoters of Khusbu finance. Here is the exact excerpt from the annual report.

What this (probably) means is after Atul auto buys 70% remaining shares of KAFL, they might infuse further capital into KAFL. The requirement of this further capital is not at all clear to me, maybe they are facing issues on the asset side. Management hasn’t been conducting concalls, so we need to wait for their annual report.

interesting update in Q3FY22 results:
Company has a subsidiary called Atul Greentech Private Ltd which is into - "manufacturing battery packs, battery management system, battery charger, tools, equipment, fittings, raw material etc. for the purpose of electric vehicles of Atul Auto Limited"
In this qtr results, scope of business for Atul Greentech Private Ltd has increased to - "manufacture, assemble, and sale of electric three wheelers"
There will also be an infusion of Rs 15 Crores into this subsidiary by Vijay Kedia.
Although the infusion of money is a good confidence booster for growth in coming years in the EV business, shareholders’ stake in the story is being diluted. Further explanation should be given my management on this move.
1 Like
So what changes? Atul is already selling their e 3W. Management has indicated 10% of their total sales come from ev. earlier they were manufacturing under Atul Auto and now under Atul Greentech.
Company is not selling lithium ion ev yet. Only lead acid battery.
1 Like
My mistake. Money will be raised in atul green.
View on Atul’s valuation -

Any contradictory views?
disc: invested; not a recommendation
Ujjawal
WealthCulture
SEBI Registered RA
Current capacity is now 10000 per month but sales figure is only 1500 per month. Even after Covid relax no upward sales is seen.
2 Likes
True Sir. That is precisely the point and hence it is available cheap today. I am talking from a long term perspective when the situation improves and both the plants are operational. This is a 5 year view as you can see in the table here.
The above 5 years of extrapolation are not correct. The question here is about demand in the market, not supply and manufacturing capacity. Atul Auto hasn’t used 100% of its capacity utilization till now. So expecting sales around 1,20,000 units in next 5 years is too optimistic.
Disc- Invested
Agree Manthan.
Have been tracking month on month numbers and I agree that the execution is nowhere near the levels I had imagined specially in a Post-Covid environment. My view on the stock has changed.
Since the execution doesn’t stand upto our assessment, we have exited Atul Auto in our smallcase portfolios too. Will start looking at this once they get to a decent level of utilization.
disc: previously invested; exited now
1 Like
Here are my notes from their AR22
- Growth was impacted due to lower availability of retail finance, higher contribution of resale vehicles and cost increase due to transition from BS4 to BS6
- Atul’s market share decreased to 5.51% in FY22 (vs 6.99% in FY21). This was due to sudden change in industry product mix, where share of CNG 3Ws in domestic industry raised 51% vs a decrease of 29% in diesel 3Ws
- Developed a unique range of 24 Business Application Vehicles customized to demands of retail and institutional consumers
-
EV foray:
o Company has a tested and homologated model in 3W EV L5 category with fixed Lithium-ion Battery Packs, which will be launched in FY23
o Signed MOU with a renowned European brand that will provide technological support for development of own BMS on turnkey basis.
o Tied up with Honda to produce Swappable Batteries in the near future - Have the entire range of vehicle offerings (CNG/LPG/petrol/diesel/electric)
- Exports grew from 13.33 cr. in FY21 to 25.62 cr. in FY22
- Average sales realization per vehicle decreased by 2.88% to 1,58,789 due to change in product mix
-
KAFL:
o Acquired remainder 70% stake for 44.57 cr. and became 100% owned by Atul auto
o Company has raised 29.54 cr. by issuance of 1,82,79,400, 0.001% Participative Preference Shares
o Net worth: 100.42 cr.
o Primarily finances 3-wheelers of Atul Auto and 2-wheelers in regions where other financers are not easily available
o Disbursed loan of 79.55 cr. (vs 64.47 cr. in FY21). AUM grew by 12.96% to 172.75 cr. (vs 152.93 cr. in FY21). Revenue was 30.59 cr. (vs 33.80 cr. in FY21). PBT was 2.19 cr. (vs 7.01 cr. in FY21). PAT was 1.61 cr. (vs 5.29 cr. in FY21)
o Has presence in 47 locations in 12 states - Atul Green Automotive Private Limited: Sells spare parts of Atul vehicles to certain international markets. Had revenues of 2.08 cr. with PAT of 1.54 lakhs
- Atul Greentech Private Limited: Invested 5 cr. to taking share capital to 10 cr. from 5 cr. in FY21. In May 2022, subsidiary raised 15 cr. by allotment of 25 lakh shares at a price of 60/- on private basis resulting in Atul auto’s shareholding falling to 80% (valuation of 75 cr.)
- Term loan: Withdrew 75 cr. from the sanctioned loan of 90 cr. from EXIM Bank for part financing green field project at Bhayla (Ahmedabad)
- Average increase in salaries of employees other than managerial personnel was 6.47% and for managerial personnel was 15.95%
- Executive Directors forgave ~40% of remuneration
- Contractual employee: 341 (vs 335 in FY21), Permanent: 700 (vs 809 in FY21)
- R&D: 94.68 lakhs (vs 1.86 cr. in FY21)
Below are the detailed business metrics since FY07
| In crores | FY07 | FY08 | FY09 | FY10 | FY11 | FY12 | FY13 | FY14 | FY15 | FY16 | FY17 | FY18 | FY19 | FY20 | FY21 | FY22 |
|---|---|---|---|---|---|---|---|---|---|---|---|---|---|---|---|---|
| Net sales | 121.77 | 80.39 | 116.81 | 119.85 | 201.59 | 298.29 | 362.86 | 429.25 | 490.07 | 528.00 | 472.19 | 551.22 | 661.35 | 617.51 | 290.27 | 286.34 |
| Raw material cost | 91.60 | 156.20 | 241.86 | 283.15 | 330.39 | 372.20 | 384.87 | 346.15 | 402.20 | 494.97 | 443.13 | 239.19 | 240.39 | |||
| Employee cost | 7.03 | 10.54 | 16.48 | 21.01 | 27.36 | 30.30 | 34.91 | 39.04 | 40.13 | 47.68 | 54.55 | 37.74 | 39.66 | |||
| EBITDA | 8.75 | 6.86 | 5.69 | 14.20 | 20.06 | 28.14 | 42.06 | 48.31 | 57.61 | 71.52 | 59.86 | 75.12 | 88.35 | 74.46 | -5.76 | -19.16 |
| Depreciation | 1.95 | 2.29 | 2.46 | 3.87 | 4.25 | 4.26 | 4.44 | 5.21 | 5.60 | 5.29 | 5.28 | 5.26 | 5.54 | 6.40 | 6.56 | 9.33 |
| Exceptional items | - | - | 0.23 | - | - | 0.13 | - | - | 1.65 | - | - | - | - | - | - | - |
| Interest | 2.78 | 1.71 | 0.76 | 0.40 | 0.35 | 0.59 | 0.78 | 0.58 | 0.42 | 0.86 | 1.03 | 0.88 | 4.00 | |||
| PBT | 7.15 | 14.06 | 23.24 | 37.22 | 42.75 | 59.25 | 71.53 | 56.52 | 69.43 | 81.95 | 67.03 | -13.20 | -32.49 | |||
| Tax | 2.61 | 4.64 | 8.40 | 11.30 | 12.95 | 19.20 | 24.35 | 19.20 | 23.24 | 28.83 | 14.64 | -3.00 | -7.62 | |||
| Cash tax | 1.22 | 4.94 | 6.96 | 12.19 | 13.37 | 16.47 | 25.36 | 19.53 | 23.20 | 27.10 | 19.40 | 0.29 | 0.46 | |||
| PAT | 3.15 | 1.27 | 0.46 | 4.54 | 9.42 | 15.59 | 25.92 | 29.79 | 40.57 | 47.40 | 37.32 | 46.19 | 53.12 | 52.39 | -10.20 | -24.87 |
| Dividend | 0.54 | 0.29 | 0.29 | 1.17 | 2.34 | 3.66 | 6.58 | 8.23 | 10.98 | 11.51 | 11.51 | 9.33 | 11.52 | 6.03 | - | - |
| Dividend tax | 0.38 | 0.59 | 1.12 | 1.40 | 2.22 | 2.35 | 2.35 | 1.90 | 2.37 | 1.24 | - | - | ||||
| Equity share capital | 5.58 | 5.58 | 6.08 | 6.08 | 6.08 | 7.55 | 10.97 | 10.97 | 10.97 | 10.97 | 10.97 | 10.97 | 10.97 | 10.97 | 10.97 | 10.97 |
| Reserves | 20.52 | 21.08 | 24.39 | 27.56 | 34.27 | 48.54 | 63.10 | 83.27 | 109.86 | 143.40 | 169.50 | 208.42 | 247.63 | 292.28 | 282.26 | 257.82 |
| Net worth | 26.10 | 26.67 | 30.48 | 33.65 | 40.36 | 56.09 | 74.07 | 94.47 | 121.07 | 154.60 | 180.70 | 219.39 | 258.60 | 303.25 | 293.23 | 268.79 |
| Debt | - | - | - | 15.00 | 80.38 | |||||||||||
| Gross fixed asset | 40.51 | 50.23 | 57.34 | 59.28 | 63.30 | 61.13 | 68.63 | 83.45 | 146.84 | 149.64 | 152.25 | 272.38 | ||||
| Net fixed asset | 32.32 | 39.80 | 44.78 | 42.82 | 42.65 | 41.54 | 48.07 | 53.33 | 93.36 | 92.10 | 88.77 | 198.41 | ||||
| Market cap | 41.31 | 28.10 | 12.84 | 26.19 | 67.88 | 83.93 | 162.38 | 394.59 | 1’221.25 | 1’139.50 | 1’024.64 | 968.13 | 745.96 | 305.78 | 392.23 | 354.27 |
| CAPEX | 4.03 | 8.47 | 9.60 | 10.57 | 33.59 | 10.79 | 7.91 | 6.85 | 69.83 | 143.47 | 39.57 | 10.51 | ||||
| Outstanding shares | 5’851’520.00 | 7’314’400.00 | 10’971’600.00 | 10’971’600.00 | 21’943’200.00 | 21’943’200.00 | 21’943’200.00 | 21’943’200.00 | 21’943’200.00 | 21’943’200.00 | 21’943’200.00 | 21’943’200.00 | ||||
| Low price | 42.55 | 86.00 | 89.95 | 143.15 | 328.35 | 330.00 | 391.00 | 389.30 | 266.95 | 116.80 | 130.85 | 146.50 | ||||
| High price | 159.90 | 155.00 | 226.90 | 379.75 | 834.80 | 635.00 | 567.95 | 512.00 | 466.75 | 372.90 | 203.40 | 270.00 | ||||
| Total shareholders | 1’537.00 | 1’905.00 | 2’833.00 | 3’555.00 | 14’764.00 | 19’007.00 | 21’653.00 | 21’573.00 | 21’108.00 | 21’342.00 | 35’247.00 | 43’525.00 | ||||
| Disputed taxes | 1.06 | 1.06 | 1.52 | 1.56 | 1.80 | 2.87 | 3.30 | 2.44 | 1.86 | 1.37 | 1.36 | 0.78 | ||||
| CFO | 9.58 | 16.73 | 18.79 | 40.66 | 30.71 | 35.79 | 10.86 | 72.30 | 26.11 | 34.55 | 57.40 | 52.09 | -18.98 | |||
| Director remuneration | 1.79 | 1.41 | 1.74 | 2.17 | 2.51 | 2.88 | 2.95 | 3.21 | 3.76 | 1.98 | 2.30 | |||||
| Auditor remuneration | 0.07 | 0.09 | 0.10 | 0.12 | 0.12 | 0.17 | 0.15 | 0.18 | 0.06 | 0.07 | 0.07 | 0.06 | 0.10 | |||
| Employees | 951.00 | 919.00 | 808.00 | 868.00 | 927.00 | 993.00 | 809.00 | 700.00 | ||||||||
| Median employee salary | 116’808.00 | 142’836.00 | 166’416.00 | 179’712.00 | 192’072.00 | 202’680.00 | 171’089.00 | 204’057.00 |
Disclosure: Invested (position size here, no transactions in last-30 days)
2 Likes
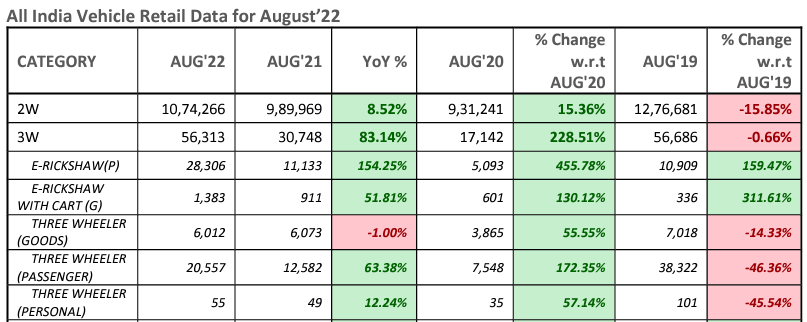
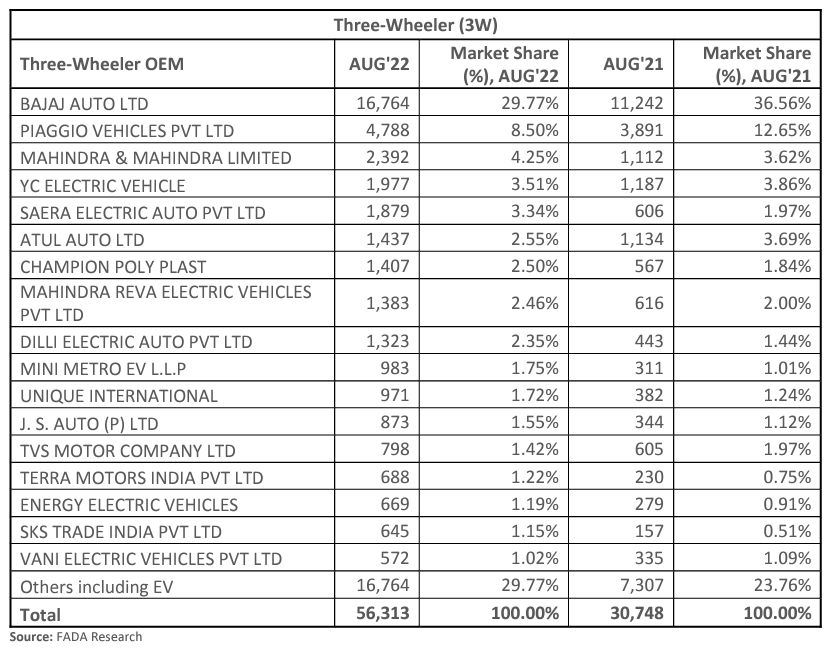
Aug 2022 3W sales data from FADA. Looks like there’s quite a bit of competition for Atul Auto and also evidence that electric 3W sales are increasing. Atul Auto being an experienced company would come through their sales issues and start showing improvement moving forward
Note: Aug 2022 sales is back to Aug 2019 (pre-covid leves) for the industry
4 Likes
I attended Atul Auto’s AGM and am sharing my notes below. Questions are highlighted in bold.
1. Its impressive to see growth in spares and e-rikshaw sales. Congrats on that. Coming to our core operations, can you give a split between diesel vs non-diesel vehicles in overall volumes and our plans to grow non-diesel volumes?
Sales composition for Atul Auto is in-line with industry (SIAM figures are 27% diesel + 60% alternate fuel + 9-10% EV)
For Atul auto, alternate fuel 3-wheeler accounts for 57% of FY22 sales. Sold 9336 alternate fuel vehicles in FY22 vs 2697 in FY21. Were late in seeding the market
2. How much of our current sales are from CNG vehicles?
55-60% of total sales (present in both 0.35 and 0.5 ton segments)
3. In the past, we used to share a sales breakup across different models. Is it possible to share the same for FY22 and FY21?
Get in touch with IR to get this data
4. We reached peak sales volume of 5500+ in export markets in FY19. However, this has come down to 1605 in FY22. However, our competitors like Bajaj auto and TVS have not seen such large de-growth. Can you talk more about this?
Exports have picked up in FY22 and is picking up month on month. Currently in seeding phase and getting some repeat orders. Africa has a volatile economy, monthly numbers may not give exact scenario. Expecting higher volume in FY23 vs FY22. In long term, expect exports to contribute 20-25% to overall sales
5. When do we plan to start selling EV 3W? It seems that despite having a strong distribution base and our own manufacturing, a lot of start ups have taken the lead.
Currently selling L3 category (lead acid battery powered) 3-wheelers. Right comparison is with L5 vehicles which will be launched in a couple of quarters. For fixed battery vehicles, batteries will be manufactured by Atul Greentech. For swappable batteries, have tied up with Honda and batteries are currently under trial
6. We used to have 200 primary and 130 secondary dealers until FY18. Have we ramped up our dealer network and how many dealers do we have now?
More or less this no remains the same
7. Can you talk more about our NBFC operations. What are the NPAs in this business, and do we exclusively finance our own vehicles?
Khusbu is exclusively funding Atul 3-wheelers (70% of book). Also funding 2-wheelers and LAP. Have seen stress in the 3-wheeler segment and restructuring loans where there is a potential of money coming back. Pre-covid book is still not out of woods and should run off by FY25. Portfolio built after 2nd COVID wave is performing well
In terms of capital adequacy, Khusbu is adequately financed and company does not have plans to infuse further capital in FY23. Will come back with fresh plan with pickup in growth
Have tie-ups with regional and national NBFCs (M&M, IndusInd bank, Hinduja Finance, AU Small bank, IDFC First bank, regional NBFCs like Kanakdurga Finance)
8. Our stock price continues to trade at very low valuations. Any thoughts of management on value un-locking?
Focusing on improving business
Breakeven nos: keeps on fluctuating and do not disclose
Long term debt: 75 cr. (expansion from Bayla plant). Total capex including maintenance was ~250 cr. with 75 cr. coming from long term debt and rest from internal accruals
Preferential allotment to Vijay Kedia (Atul Greentech): Atul Greentech has 12.5 cr. long term debt and 3.5 cr. working capital term loan. Will roll out commercial production in near term
Marketing team: different person for each geography
Disclosure: Invested (position size here, no transactions in last-30 days)
6 Likes
Thanks for sharing the details. Did they give any indication on when the sales volumes will go back to pre-covid levels? Also, is the current production capacity is 1,20,000 vehicles per year (due to the recent capex) OR when do they expect to get to that capacity levels?
1 Like