Hinduja Leyland Finance – A small History
Introduction – Hinduja Leyland Finance (HLF) is majority-owned (92.4%) by the Hinduja group entities. Through Ashok Leyland (ALL) they hold 61.8% of HLF. If one is interested in ALL it is imperative to study the status of their main subsidiary HLF. ALL’s vehicles form 36.4% of HLF’s loan book as of Q2FY20.
Within HLF there is another company as well which focuses on housing finance.
Everstone invested in HLF sometime in 2013, since then HLF tried to come with an IPO twice, once in 2016 but them DEMON happened and the company cancelled IPO plans in mid-2017. The company filed for a DRHP again in mid-2018, roadshows were started as well but after the DHFL fiasco (probably IL&FS as well) the management decided to cancel the IPO plans again due to limited interest from investors.
As usual, I will post a chart repository at the end for you to get a better view of the charts.
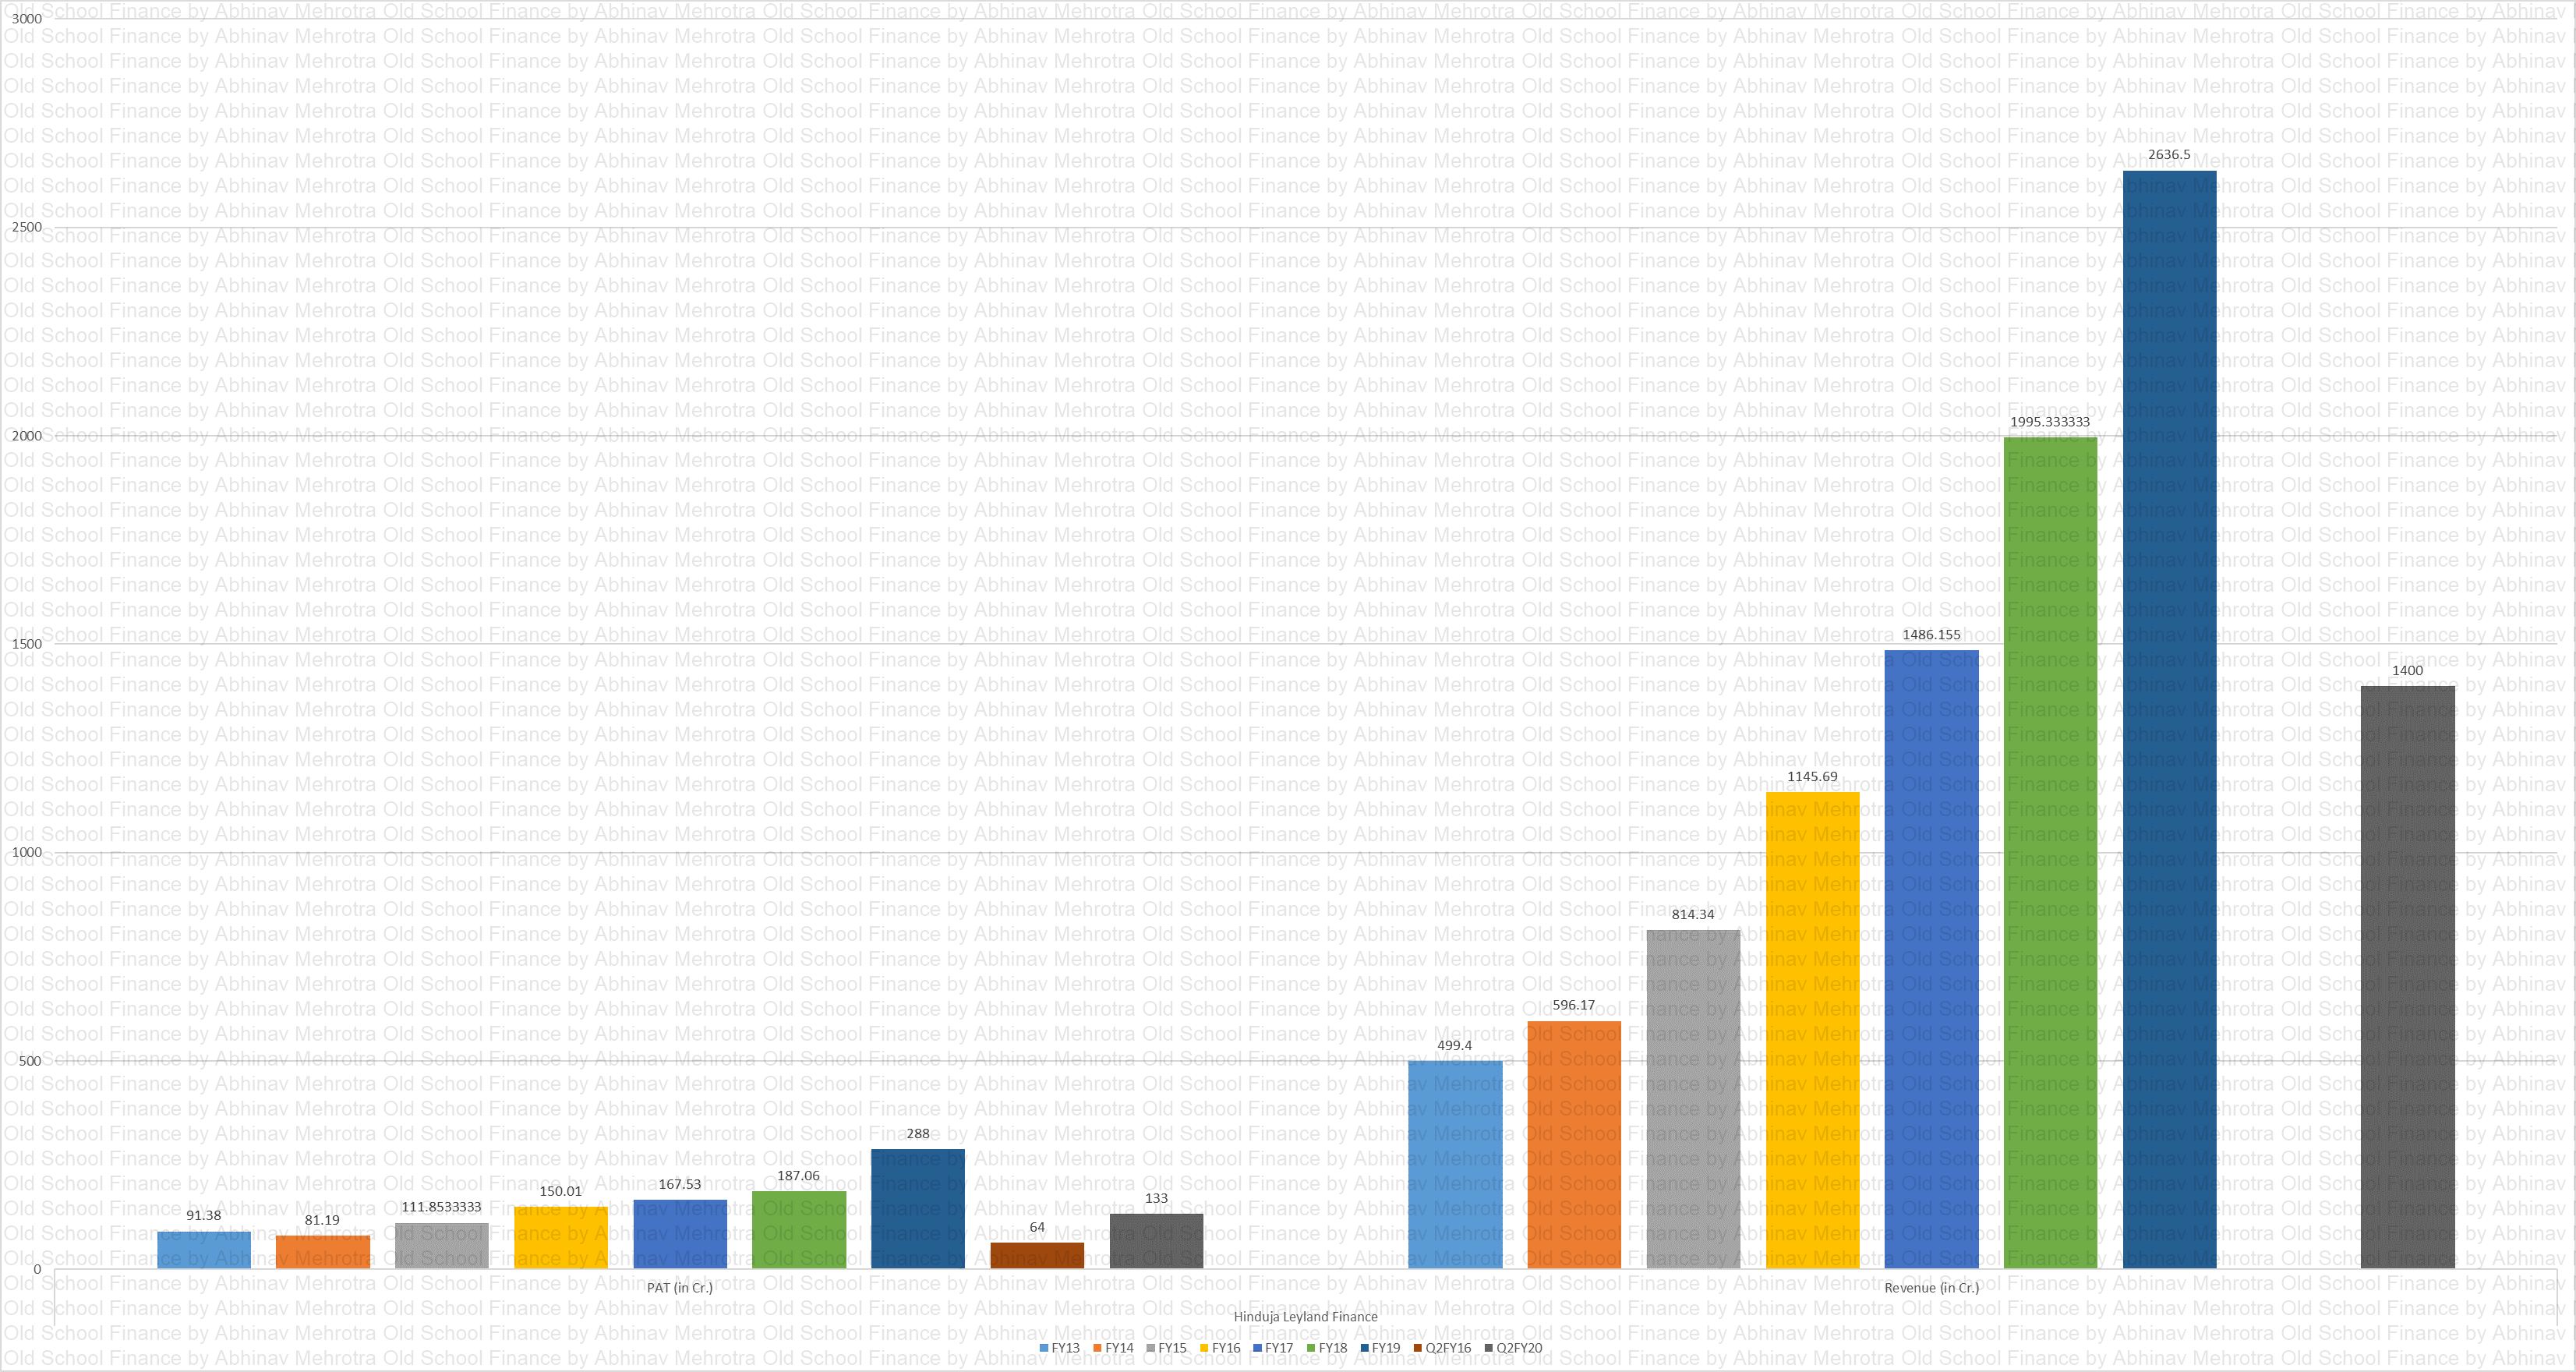
P&L
Chart 1 – Both topline and bottomline have witnessed decent growth over the years.
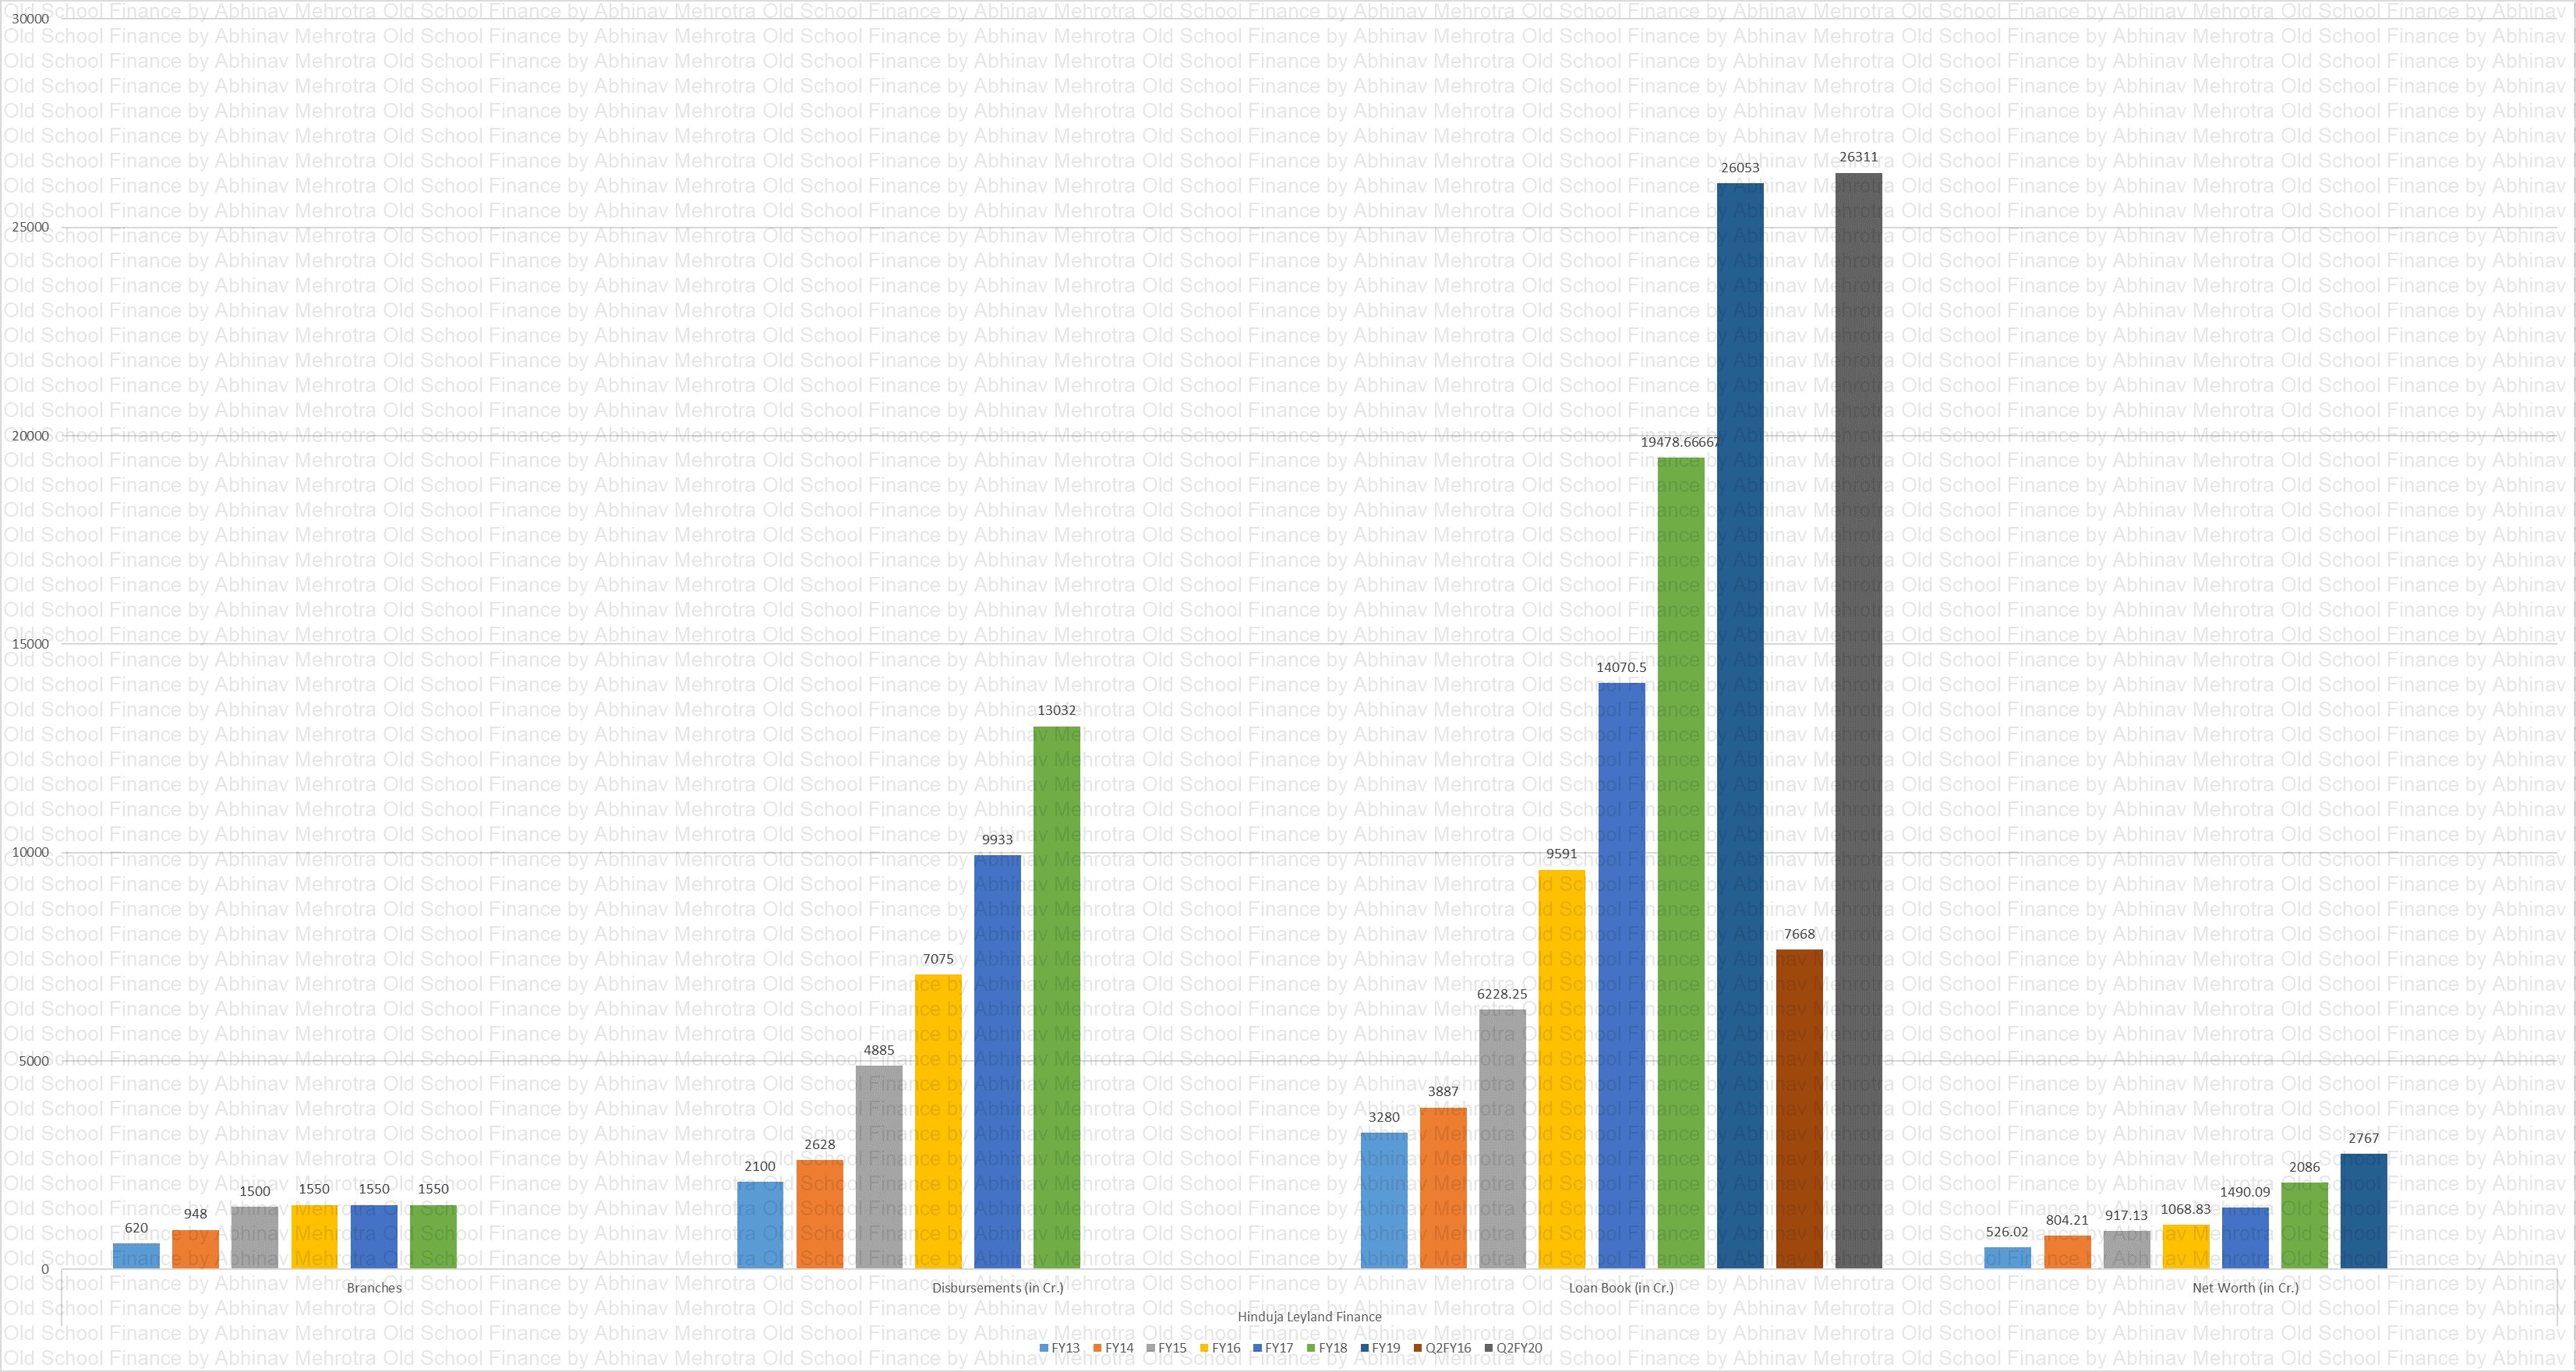
Absolute Figures
Chart 2 – Depicts branches, disbursements, loan book and net worth.
Most of the branch network is set up in the ALL showrooms, which results in easier customer acquisition.
Both disbursement and loan book has clocked decent growth supported by healthy shareholder’s equity.
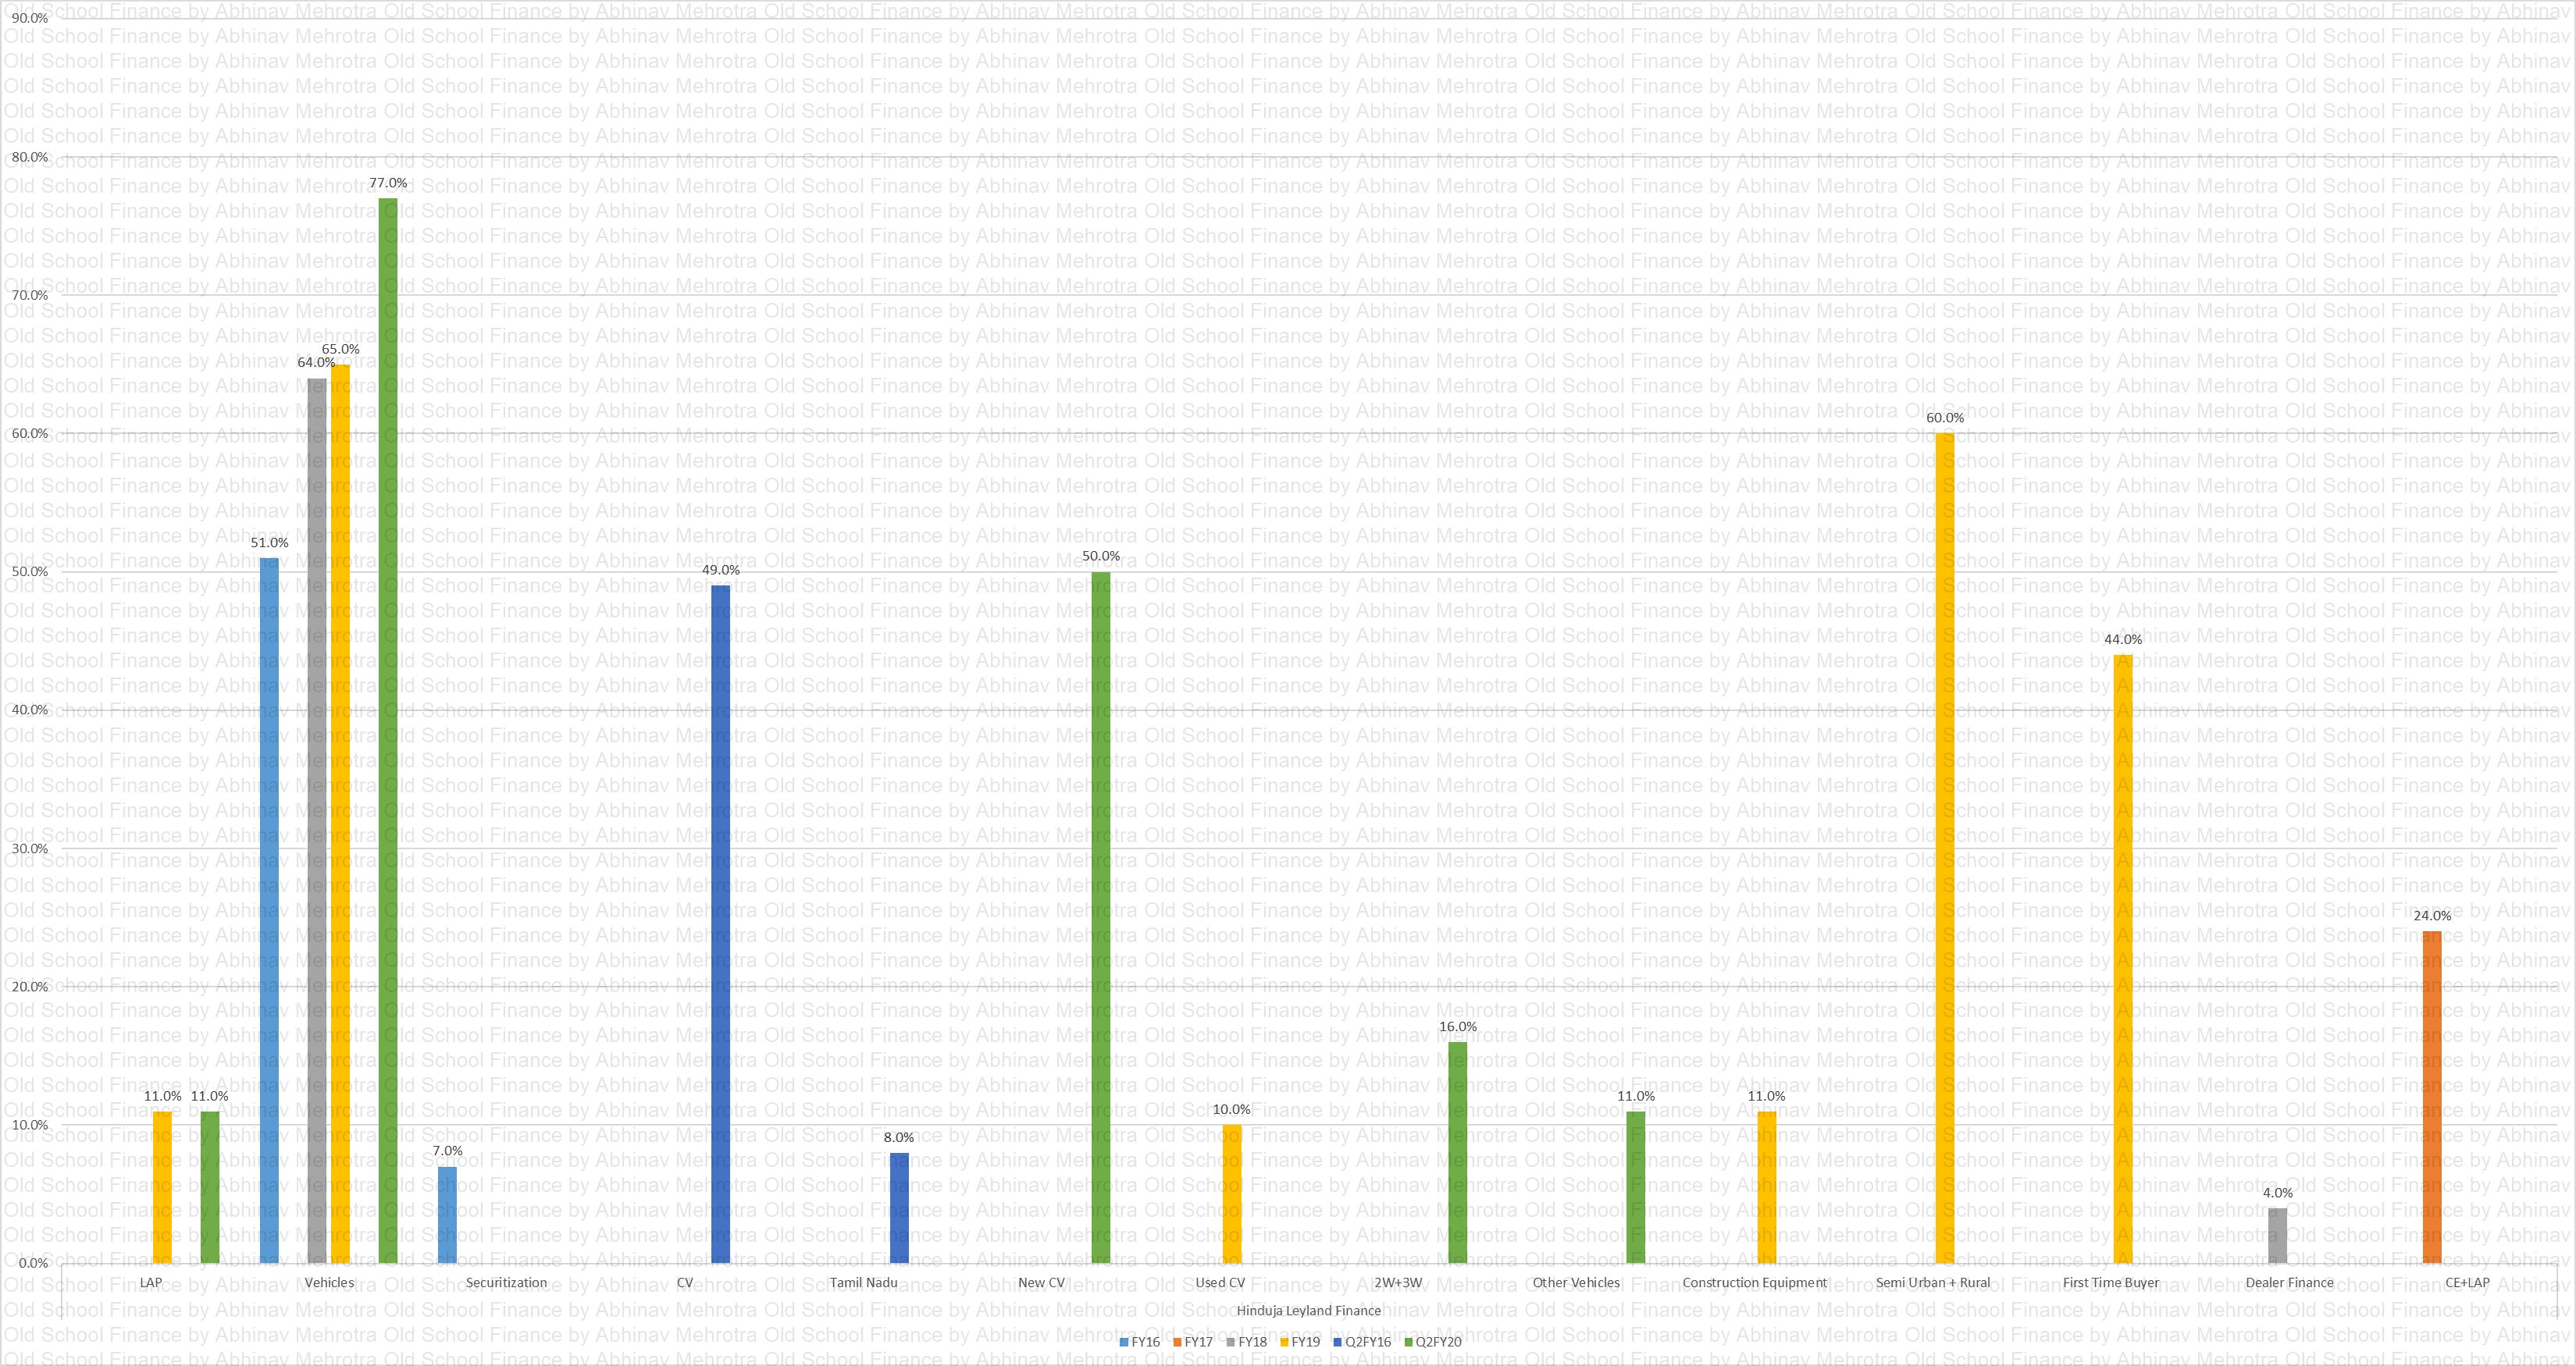
Loan Book Segmentation
Chart 3 – As of Q2FY20 the loan book comprised of 11% in LAP, 77% in vehicle finance. The company used to deploy some capital in the structures assets as well which were 7% of the loan book in FY16. New commercial vehicles form 50% of the book, 2+3W form 16. As of FY19, used commercial vehicles formed 10% of the book, and construction equipment finance 11%. Semi-urban and rural geographies formed 60% of the loan book while the share of first-time buyers was 44% in FY19.
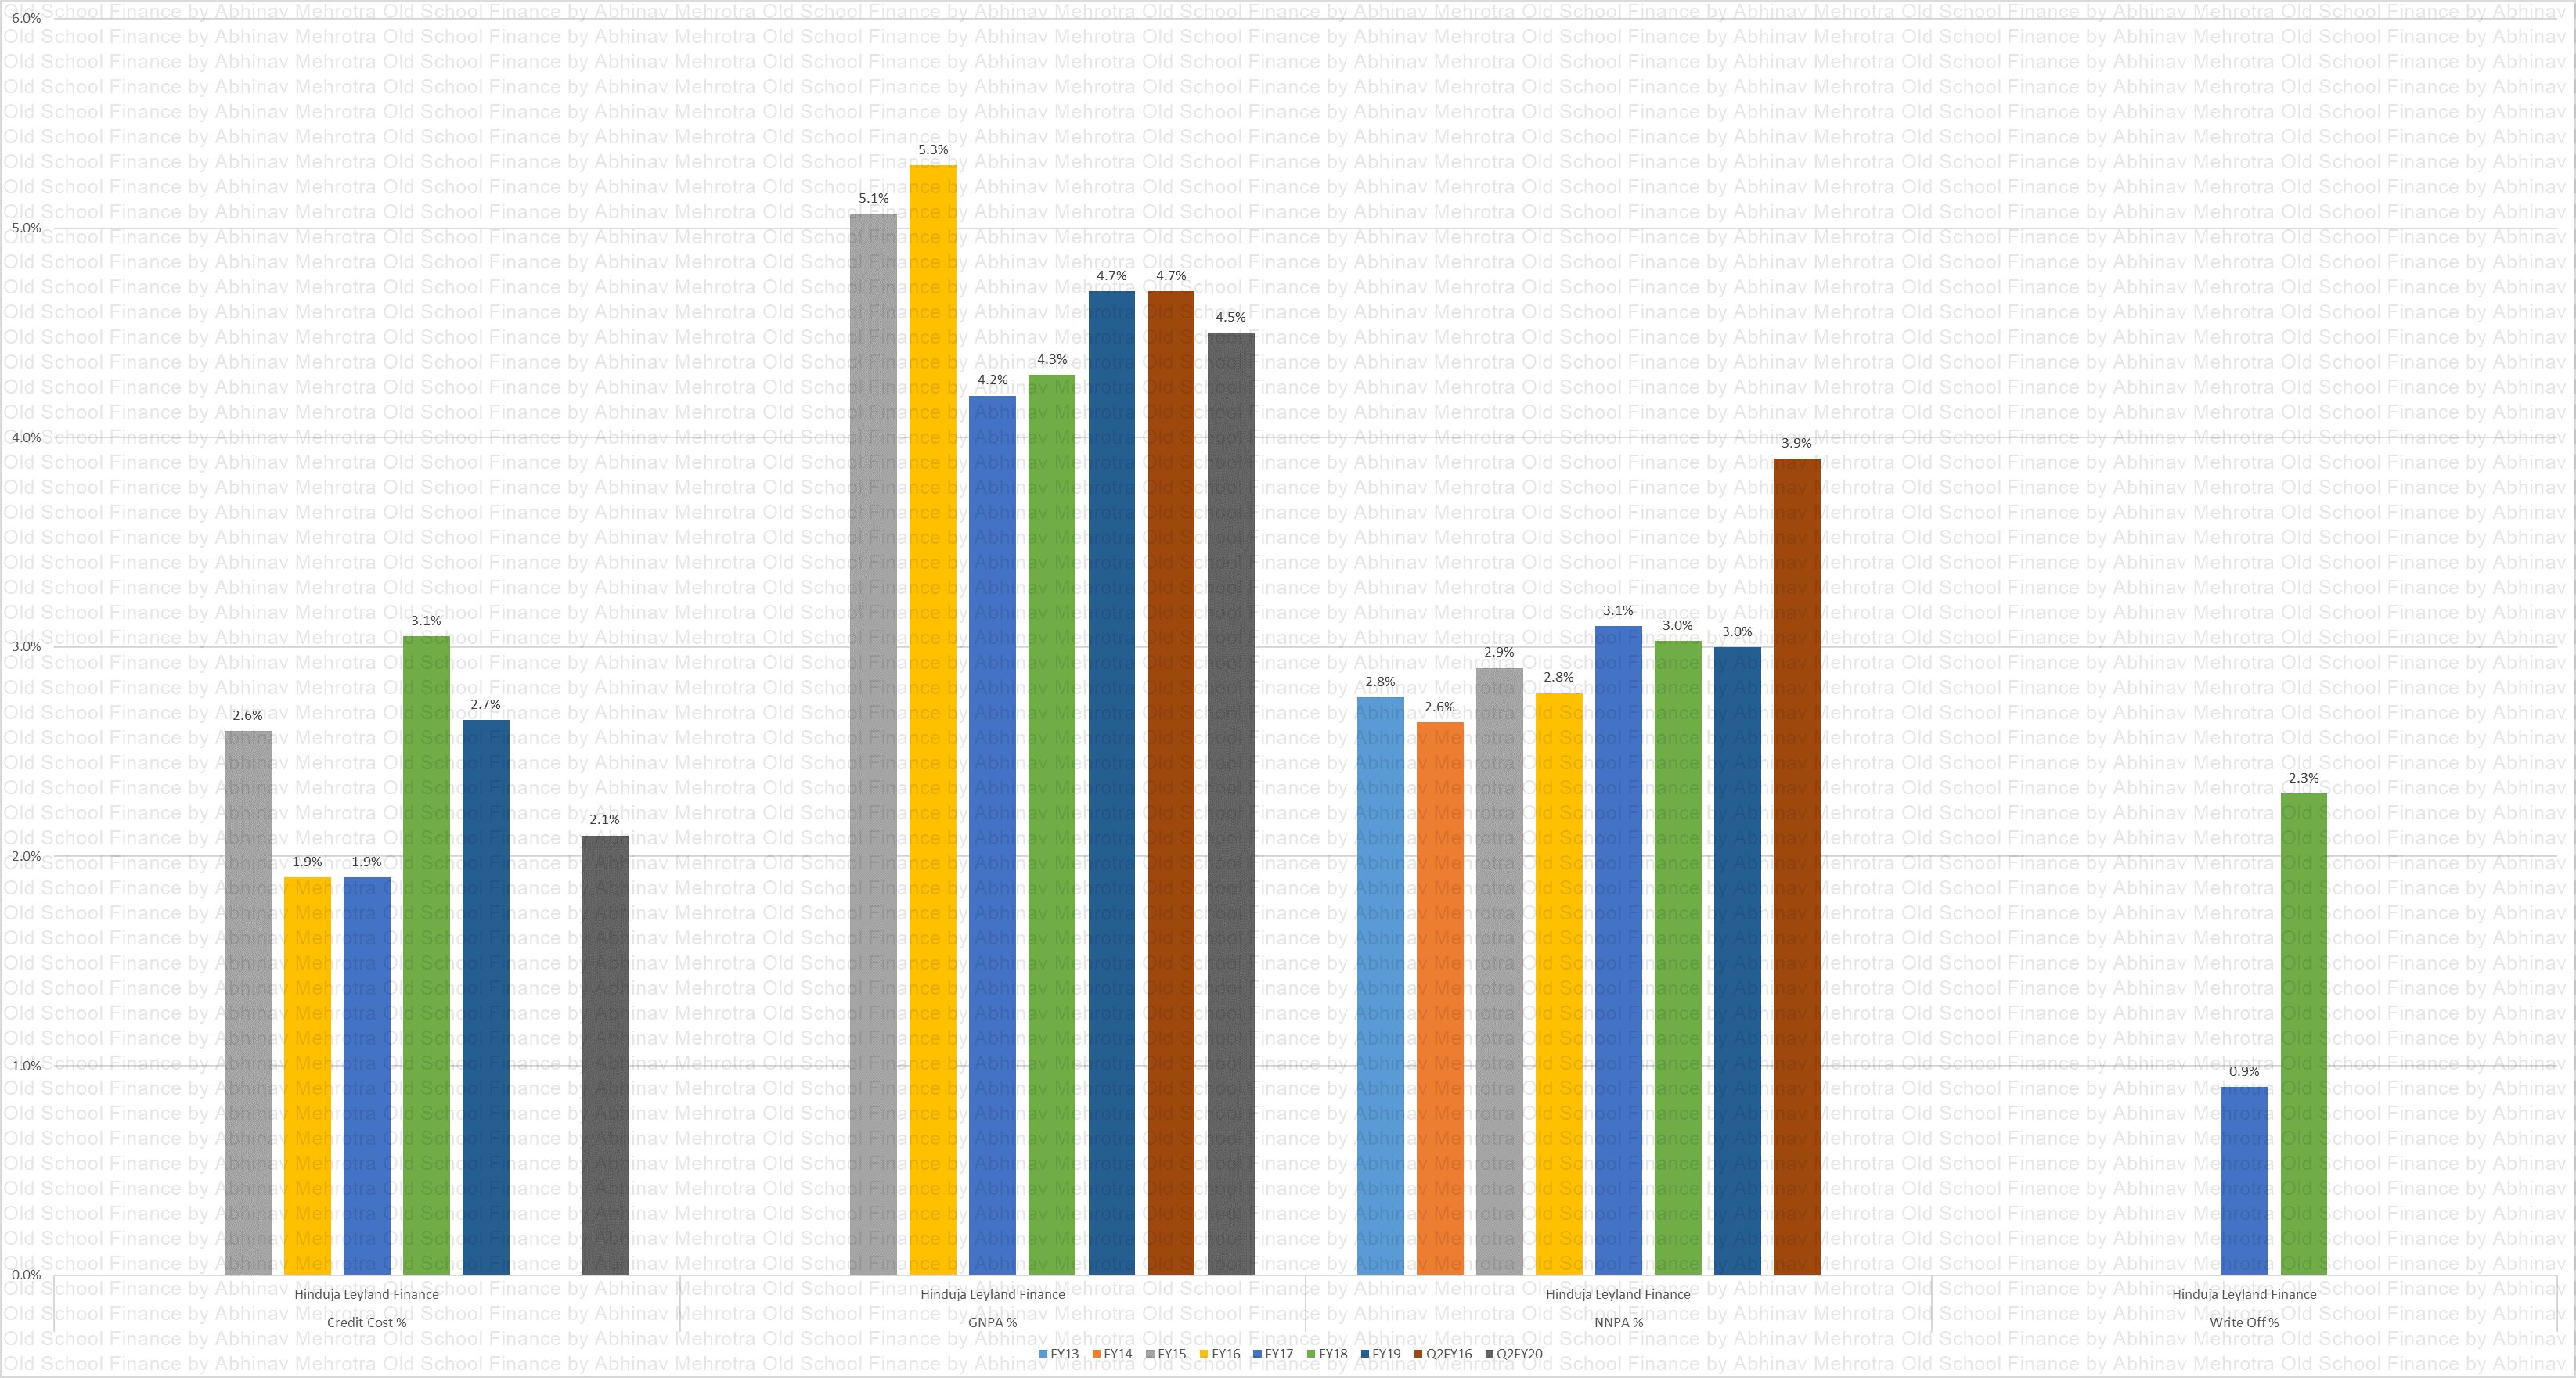
Underwriting
Chart 4 – As I have said before, growing the balance sheet and P&L is easy in the lending business, surviving is not. The company is suffering from elevated GNPA and NNPA levels. Some of the increases are attributed to the management moving from 180+ DPD recognition norm to 90+ DPD. It should be noted that the management adopted the stricter NPA recognition norms well before the deadlines mandated by the regulator.
Write-offs and credit costs are also an issue, even after repossession of the collateral. Improvement in underwriting is warranted, though I must say they are doing better than Shriram Transport Finance Corporation (STFC) in NPAs currently.
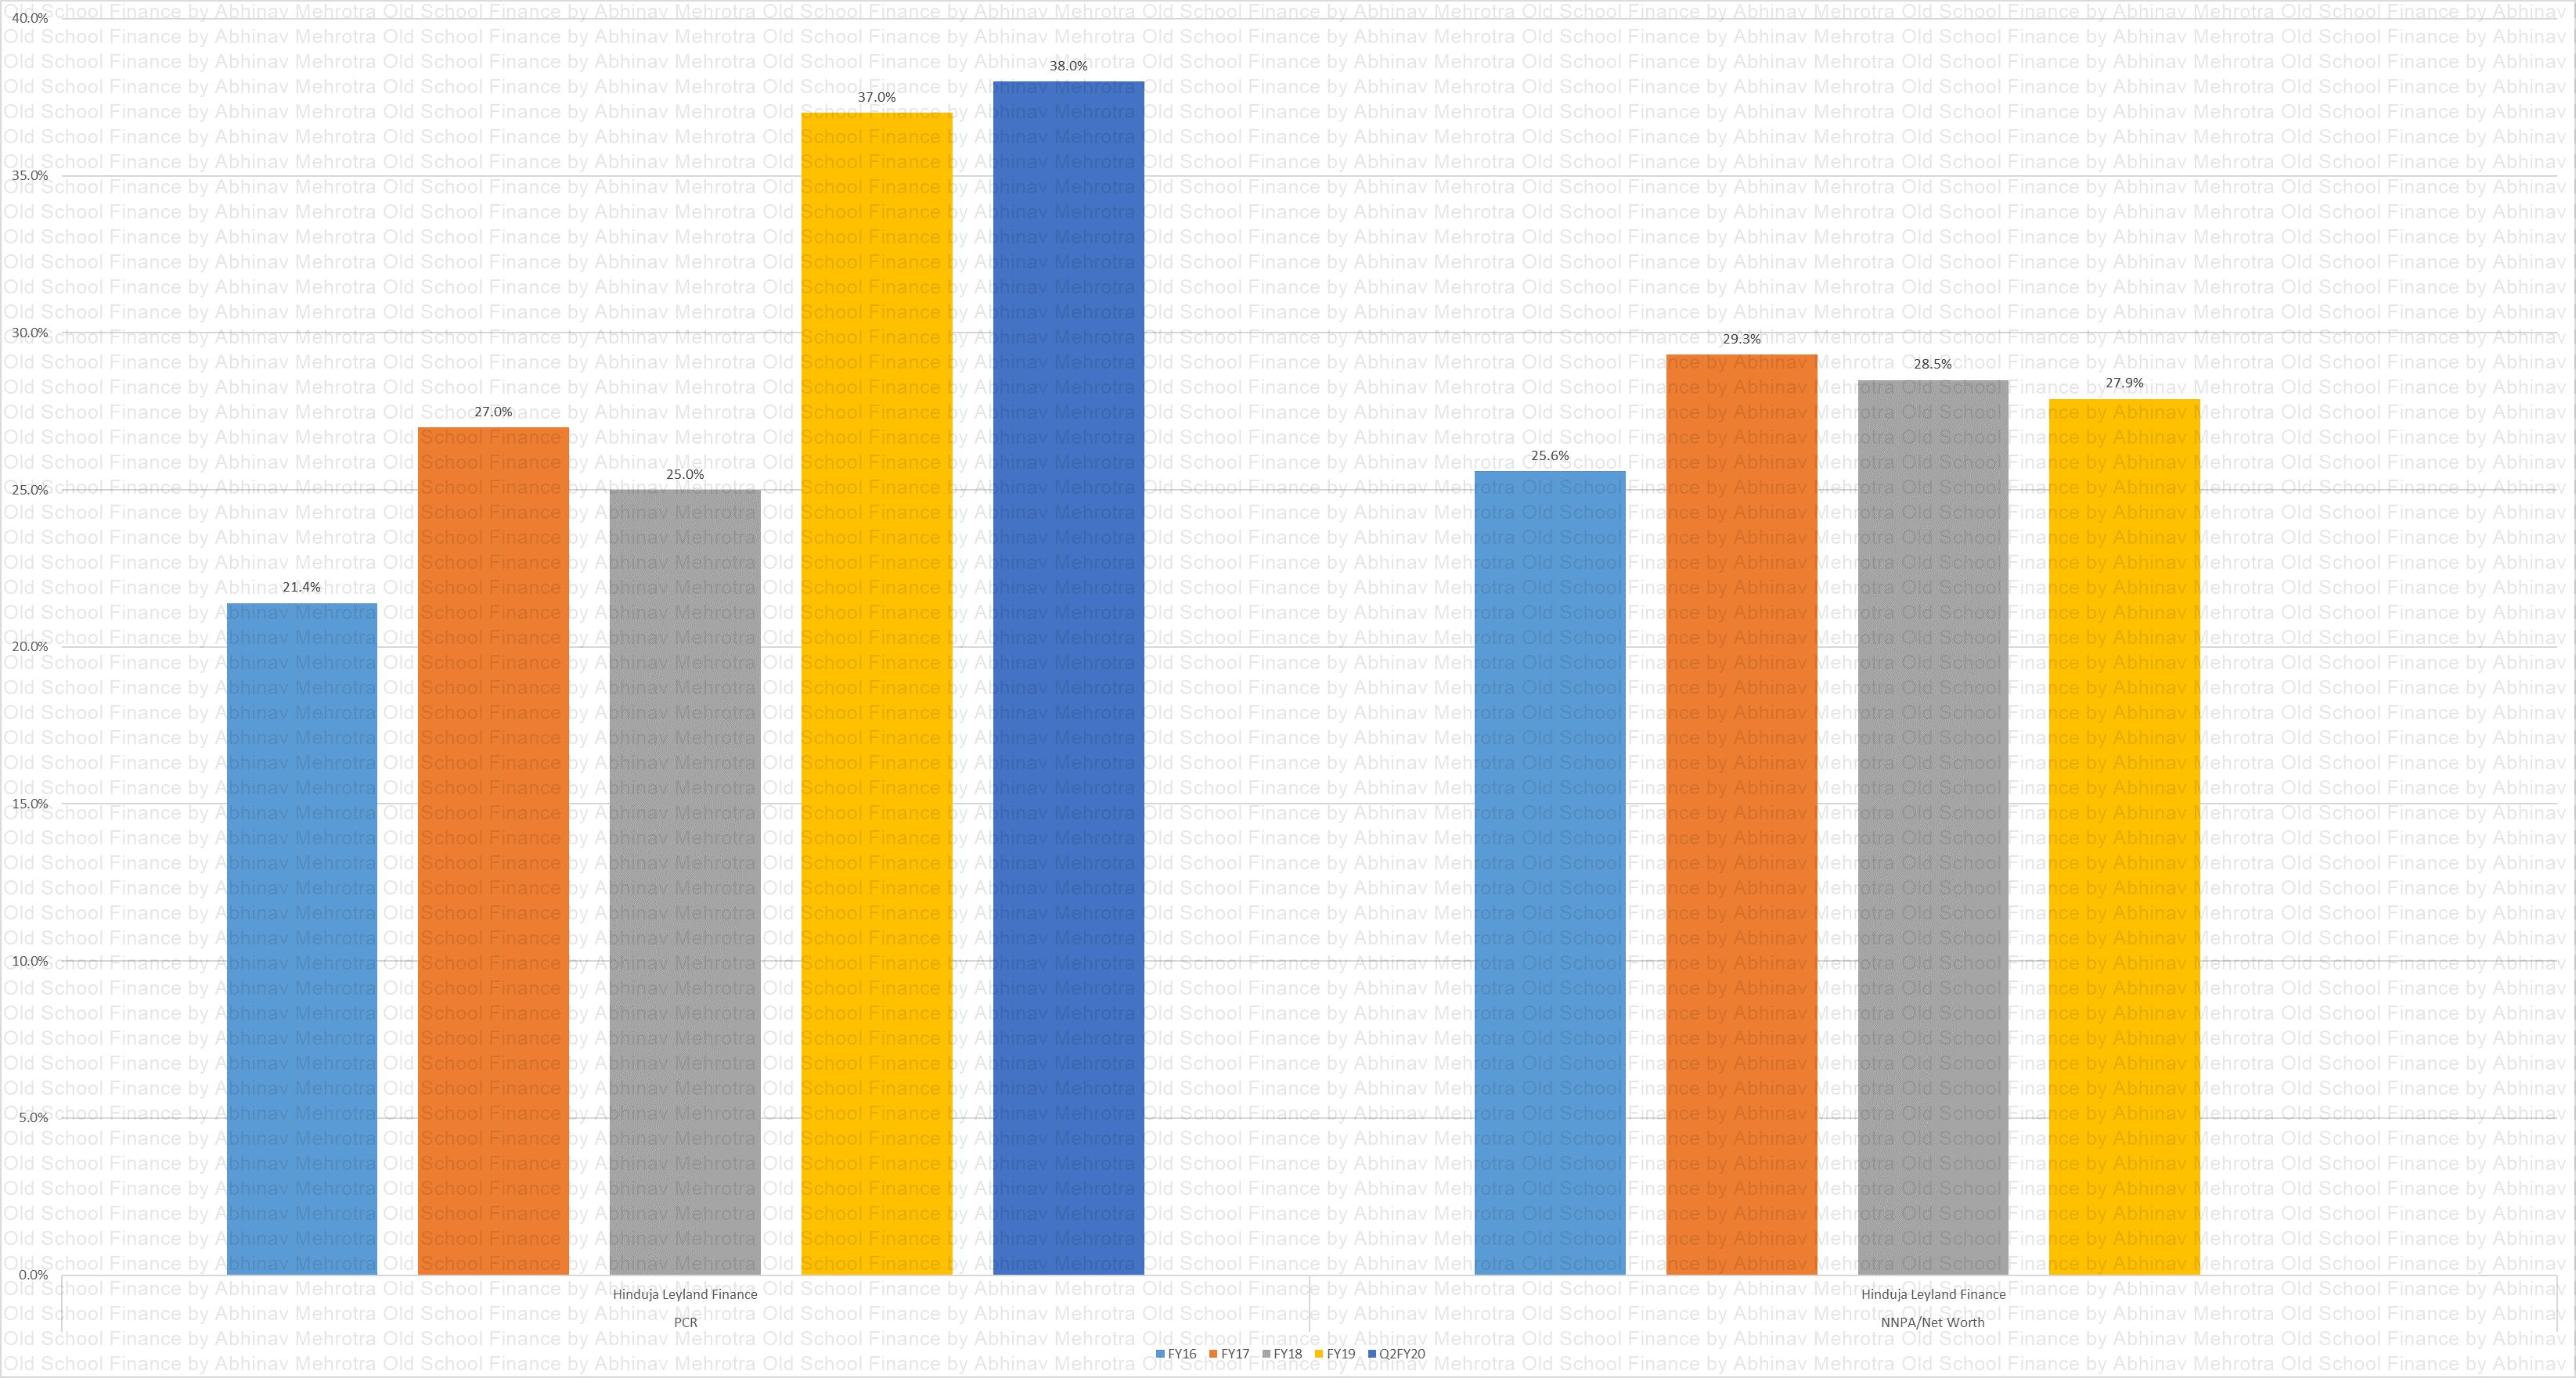
Underwriting
Chart 5 – Provision Coverage Ratios are rising which is a must, a new metric here, NNPA/Net Worth is worrisome though declining. If all of the NNPAs are written off we would wipe out a substantial part of the company’s net worth.
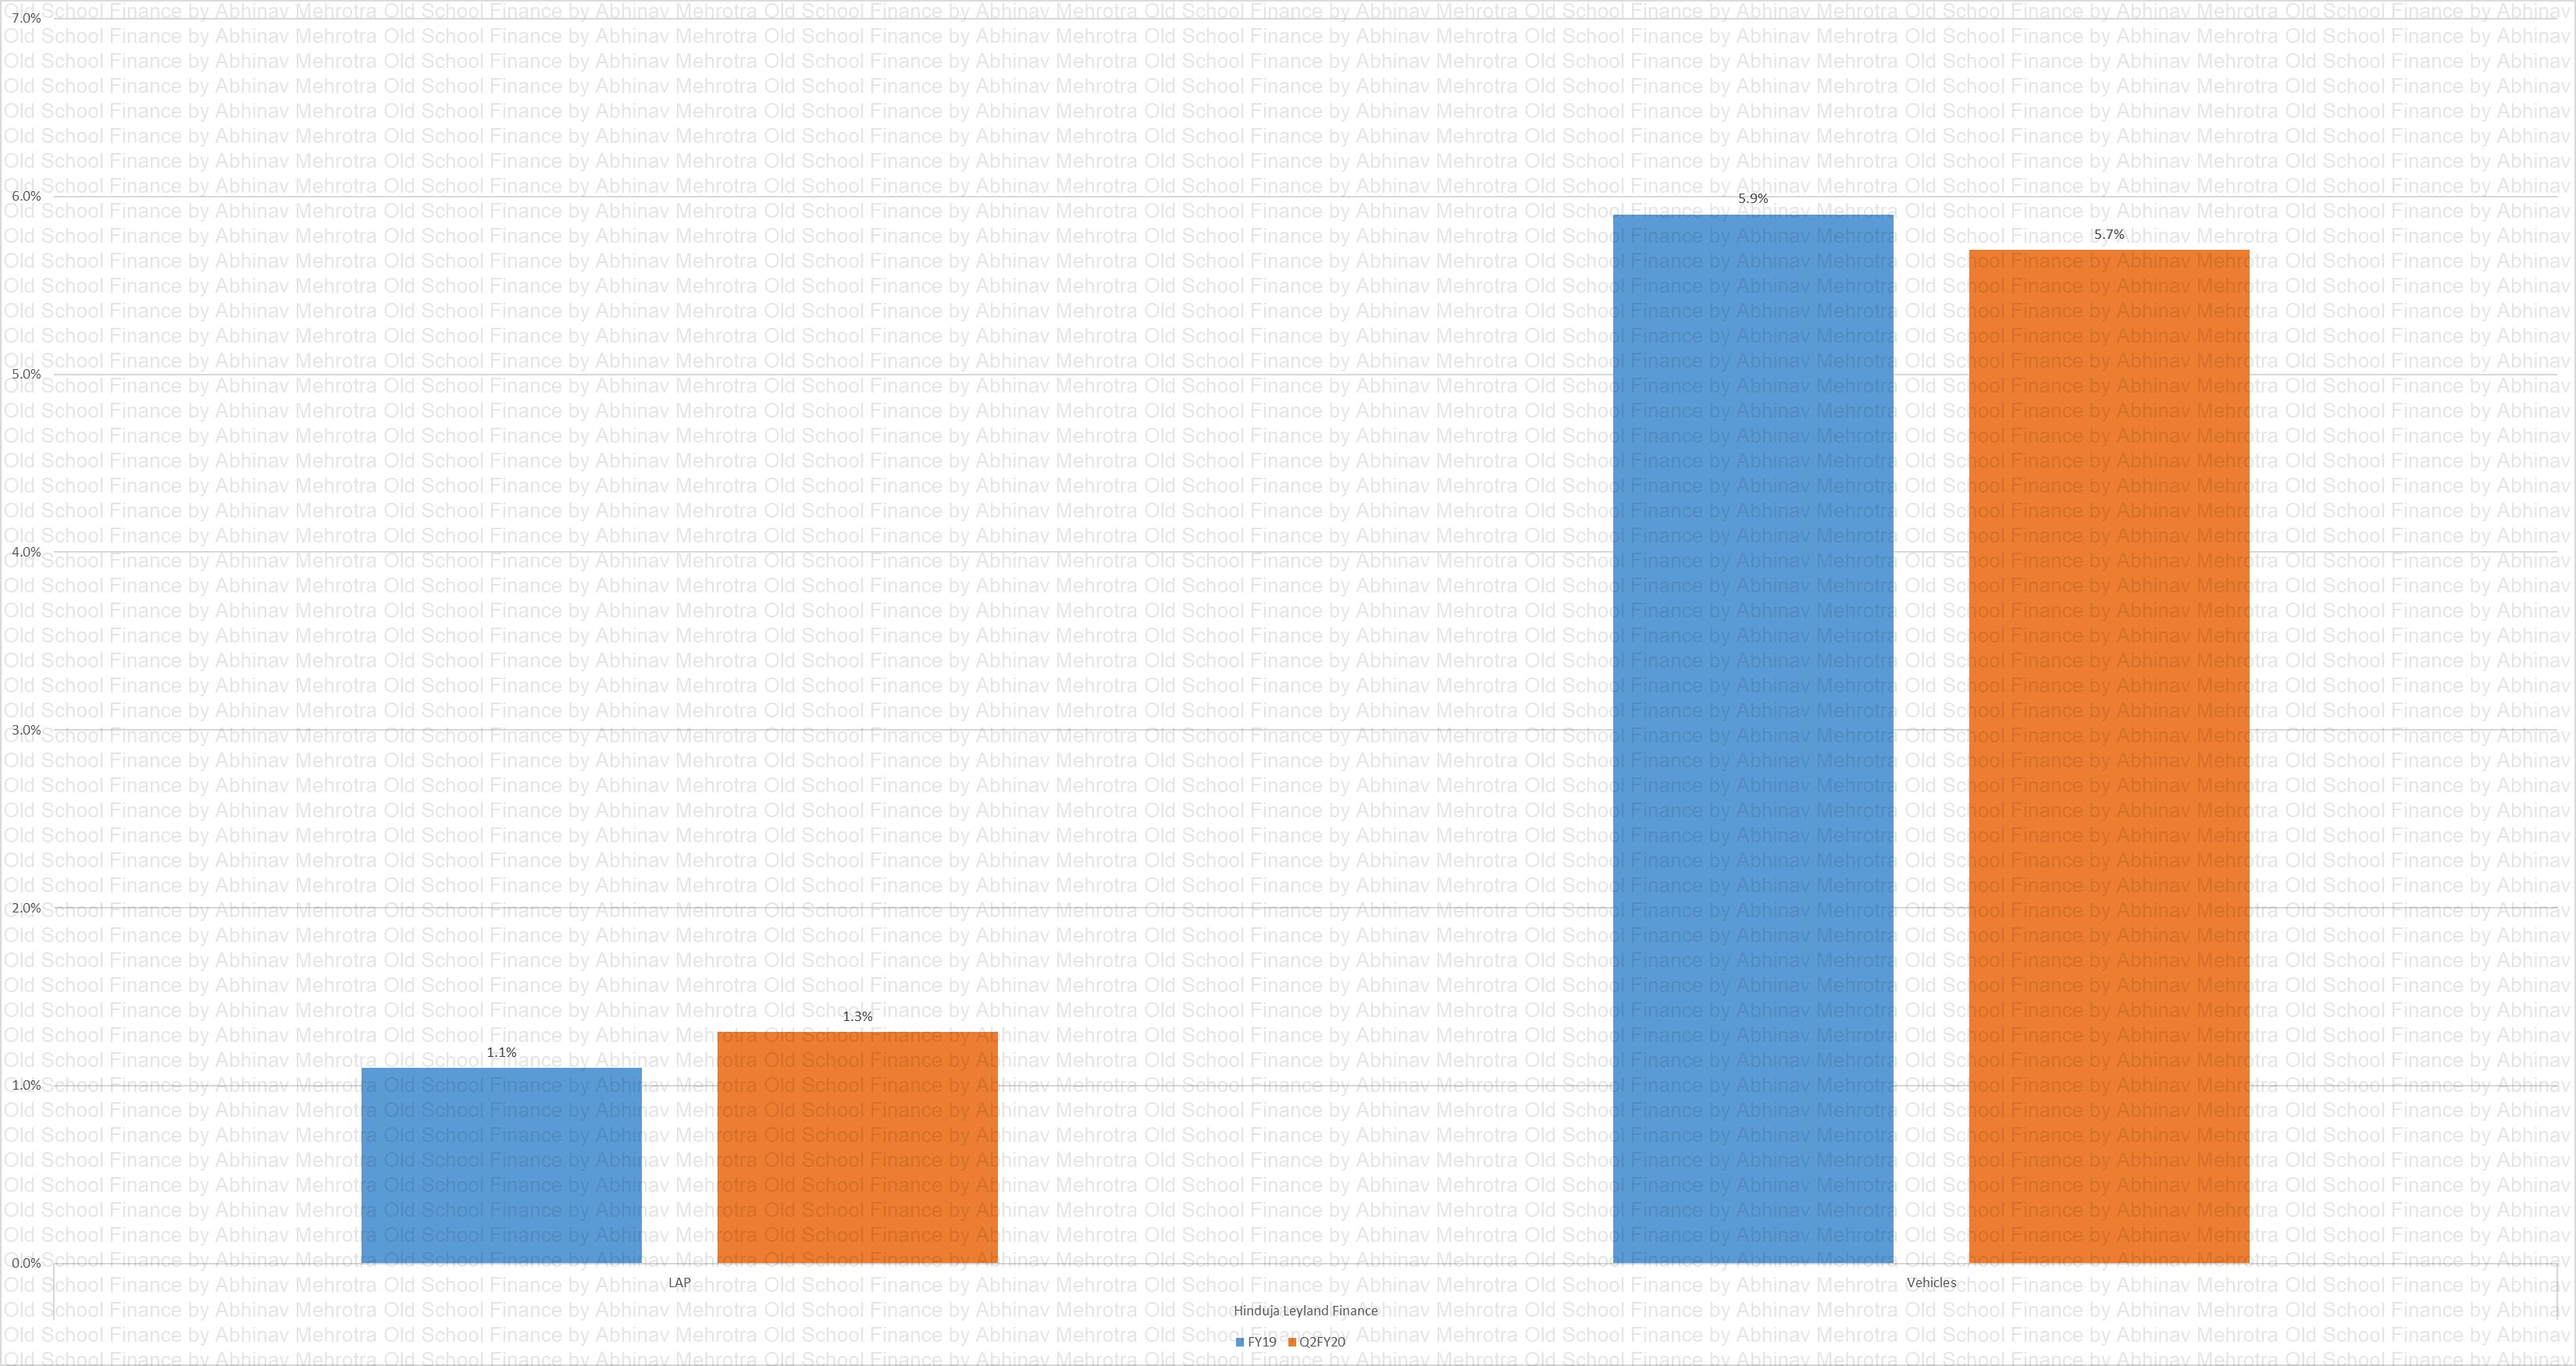
Segmented GNPA
Chart 6 – Segmented GNPA %. LAP book has not been seasoned and thus witnessing lower GNPA. Vehicle portfolio is the main cause of the elevated consolidated GNPA.
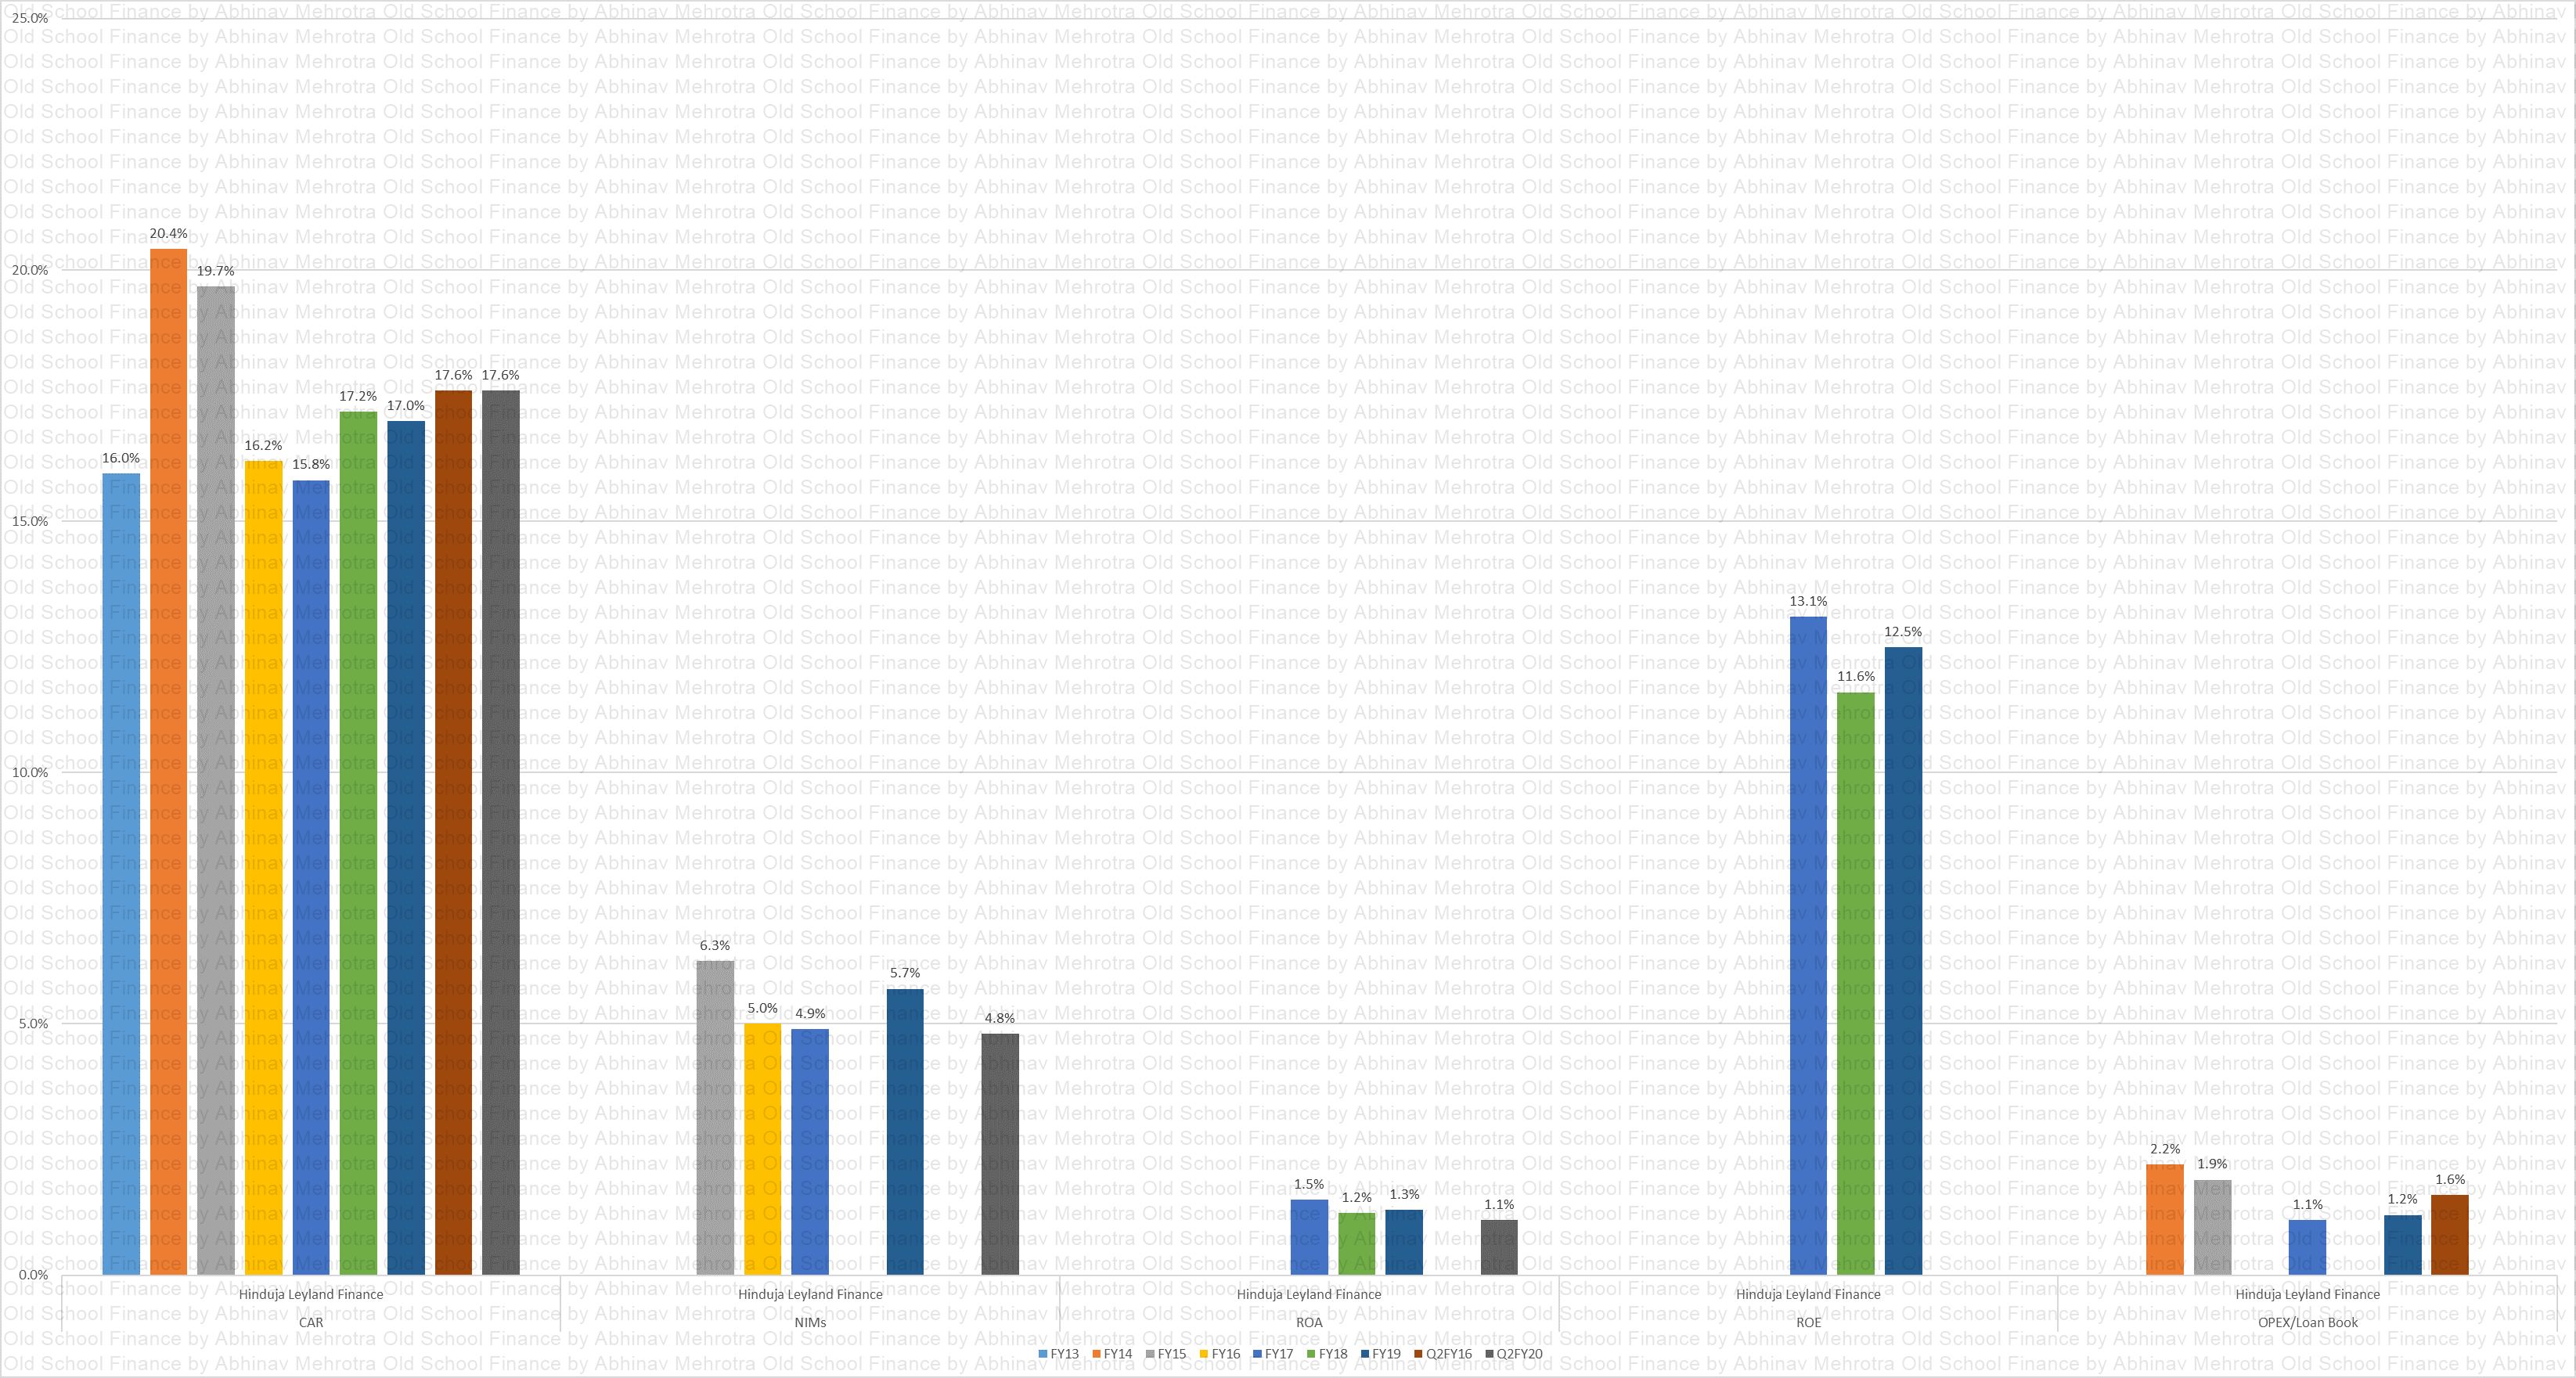
Efficiency Metrics
Chart 7 – Company is maintaining healthy Capital Adequacy, NIMs have reduced over the years. I do not have the data but it is due to either higher cost of funds or lower book yield. ROA and ROE have declined somewhat due to higher credit costs. OPEX is in check.
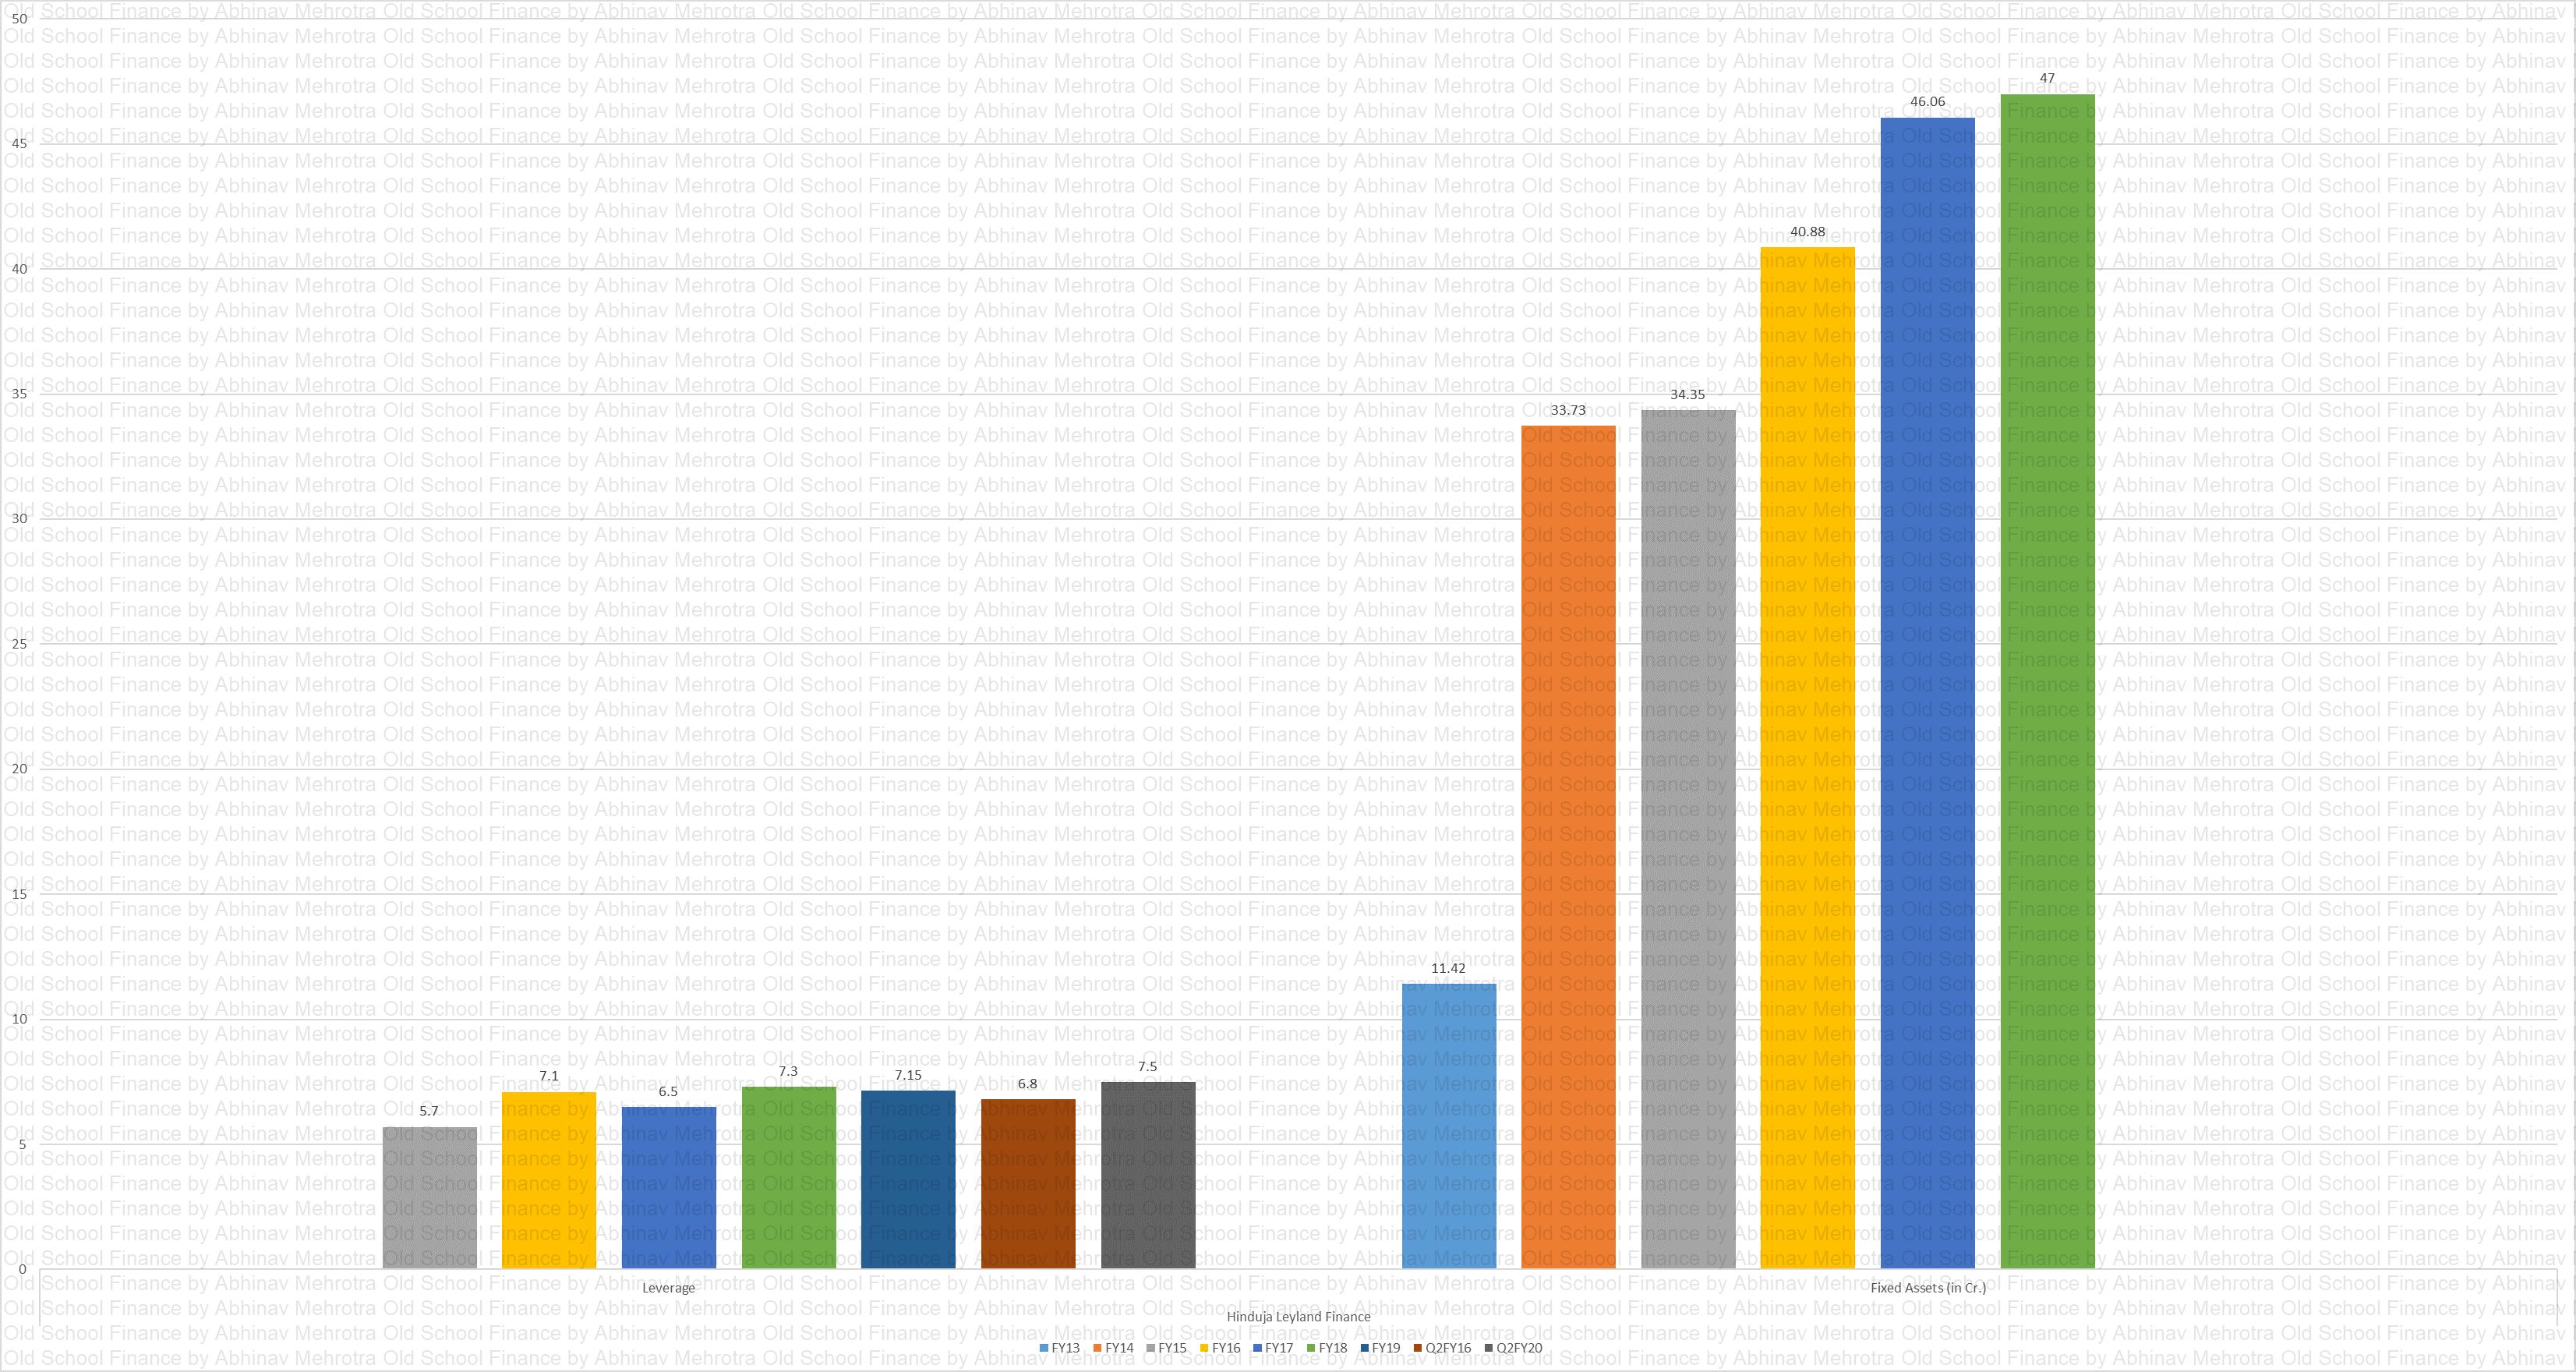
Leverage
Chart 8 – Company has increased leverage over the years but has maintained it around 7.5x.
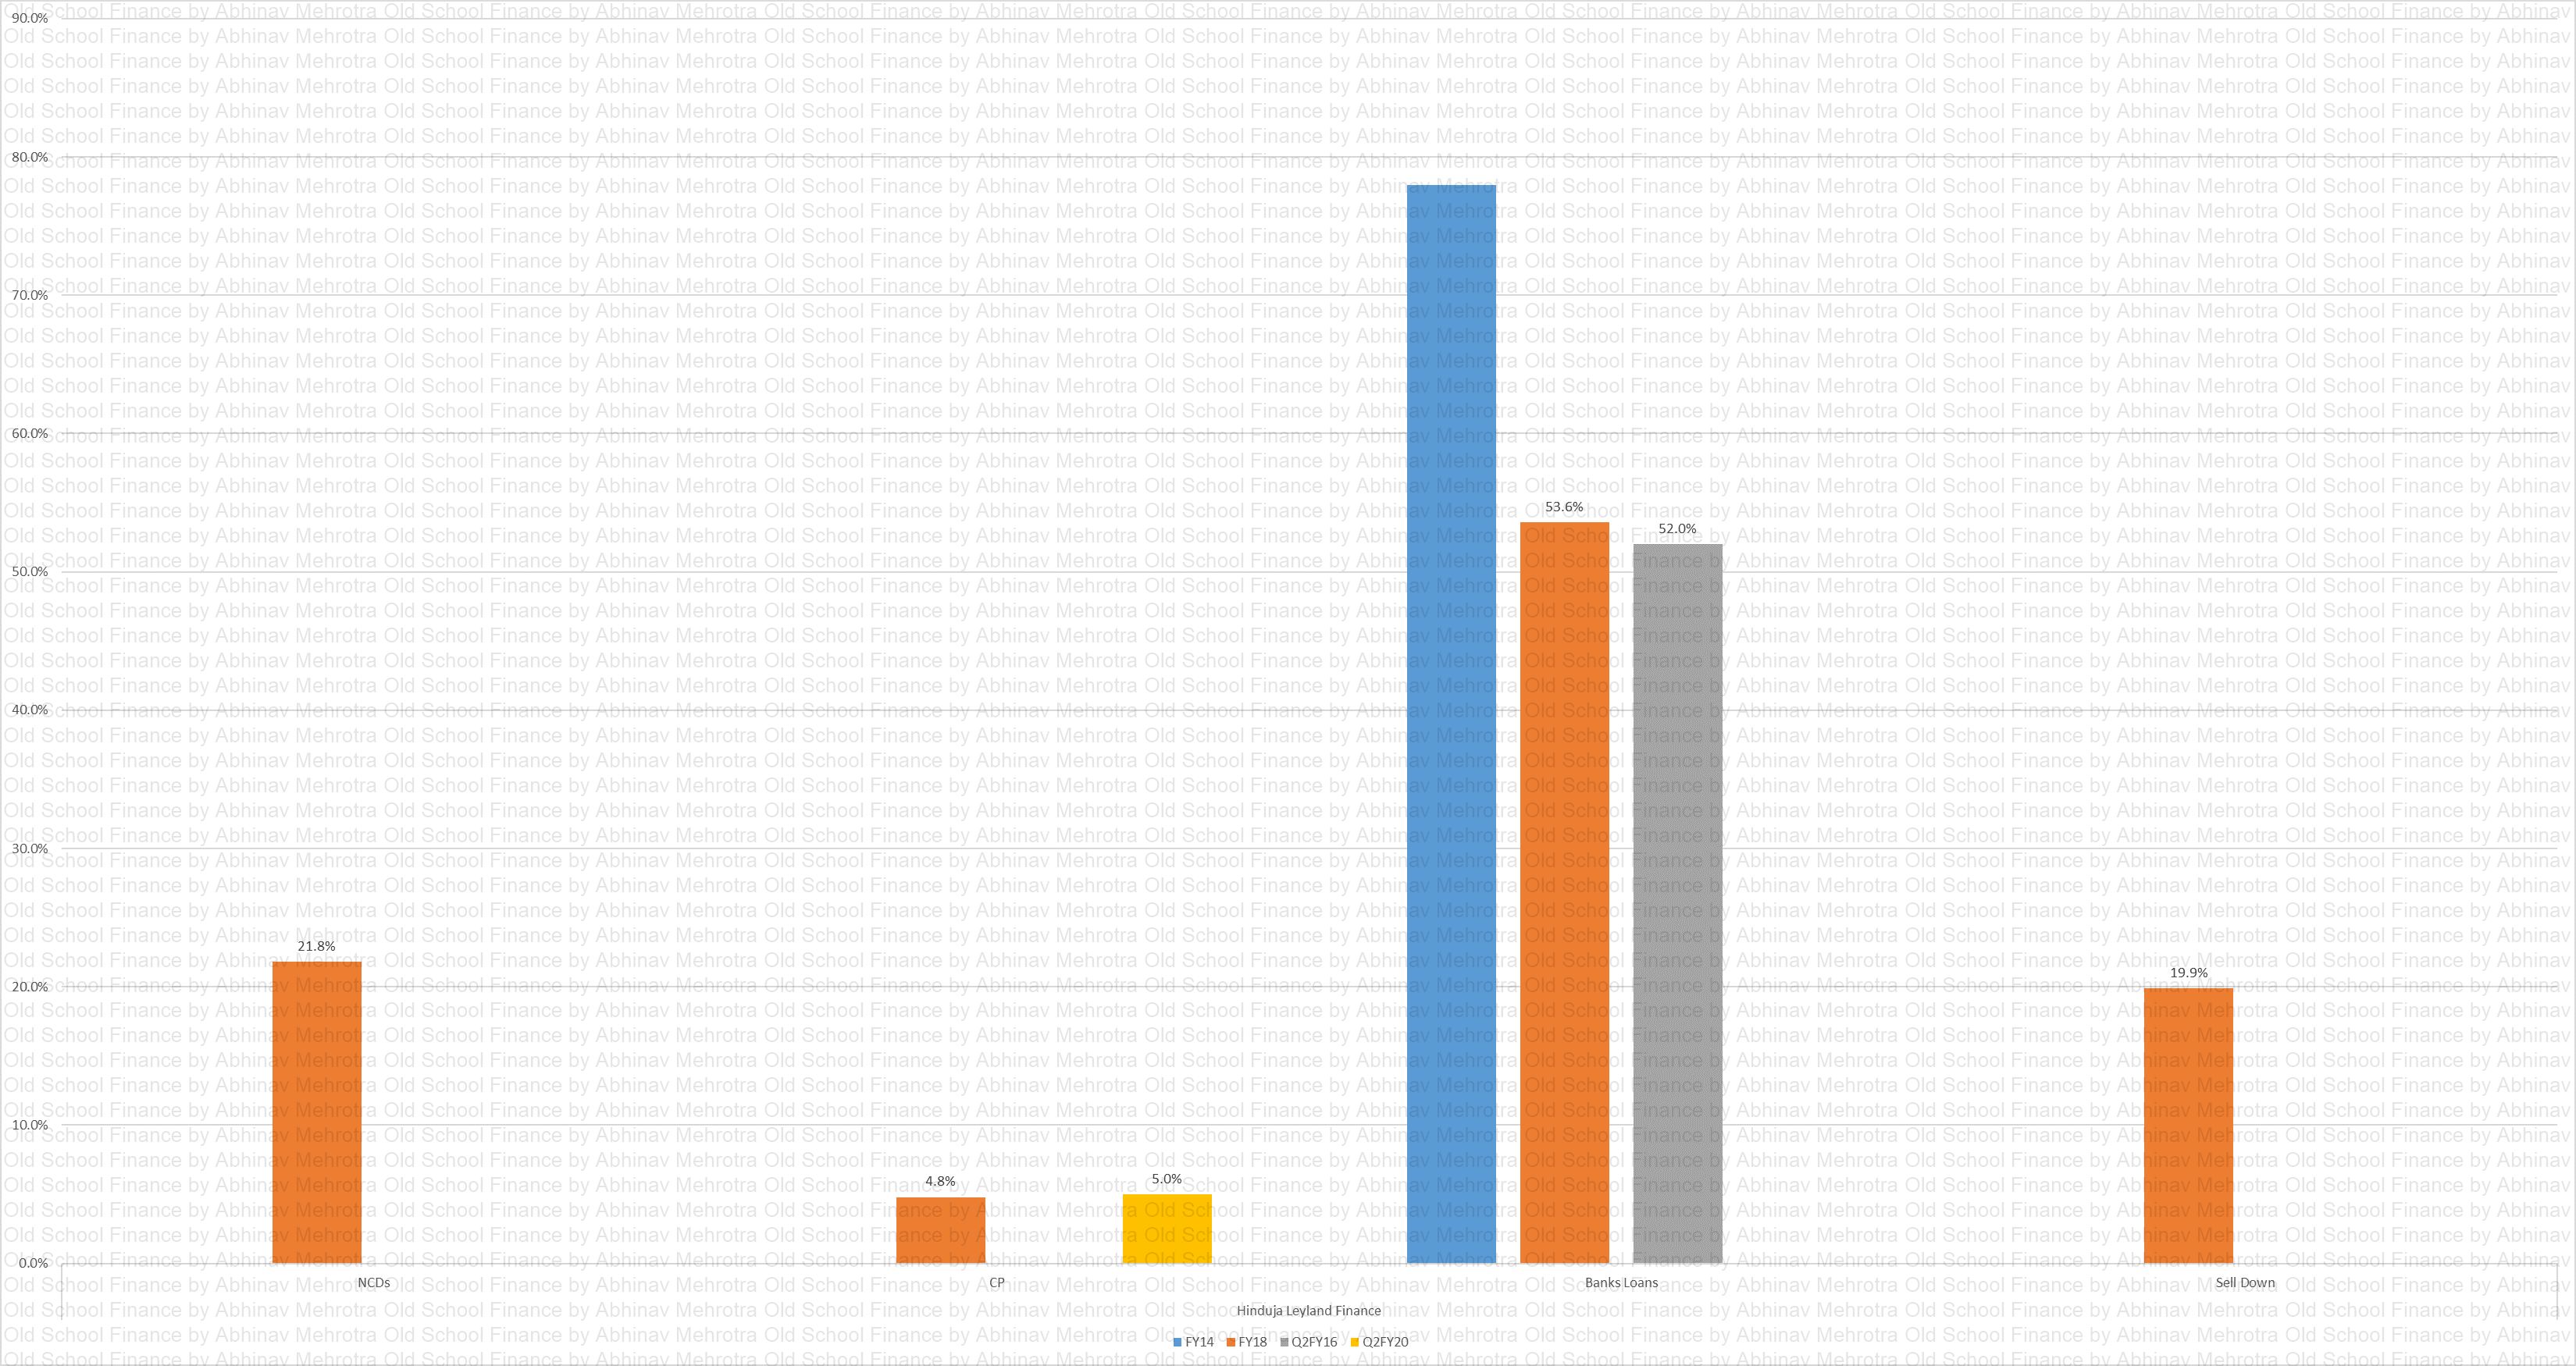
Capital Sources
Chart 9 – A majority of the capital is sourced from banks, quite a substantial amount is sold down as well.
Peer Analysis
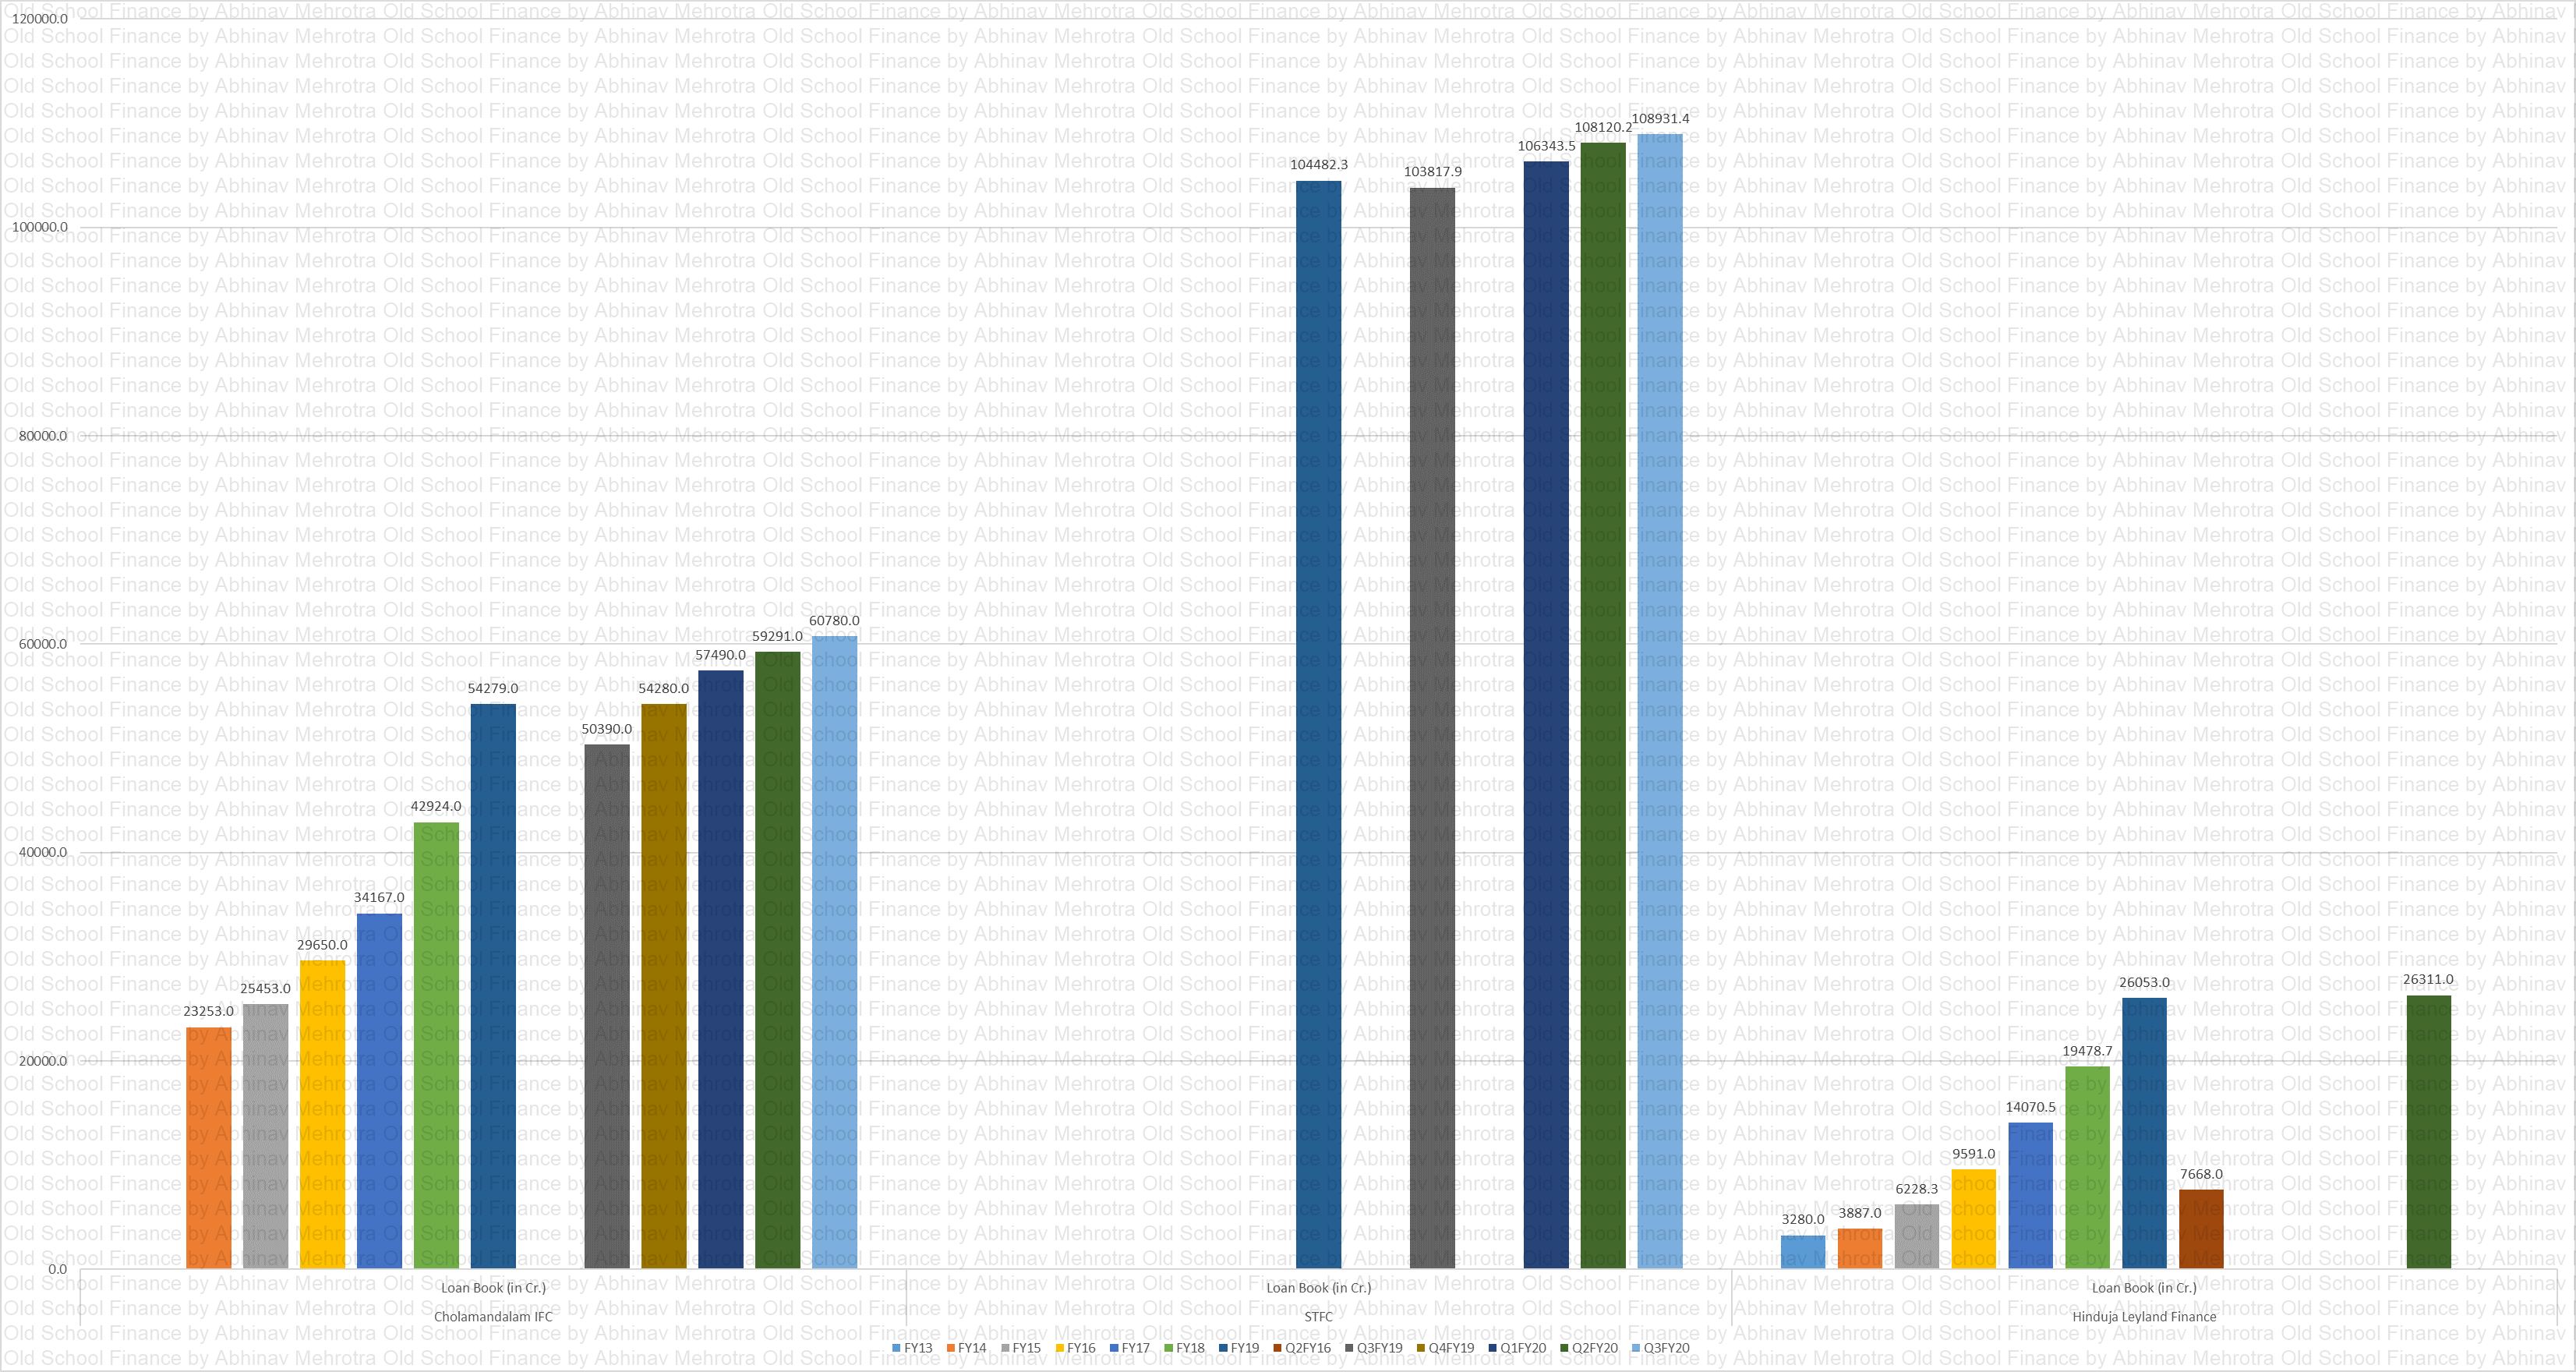
Loan Book Peer
Chart 10 – In terms of scale STFC is biggest here followed by Chola.
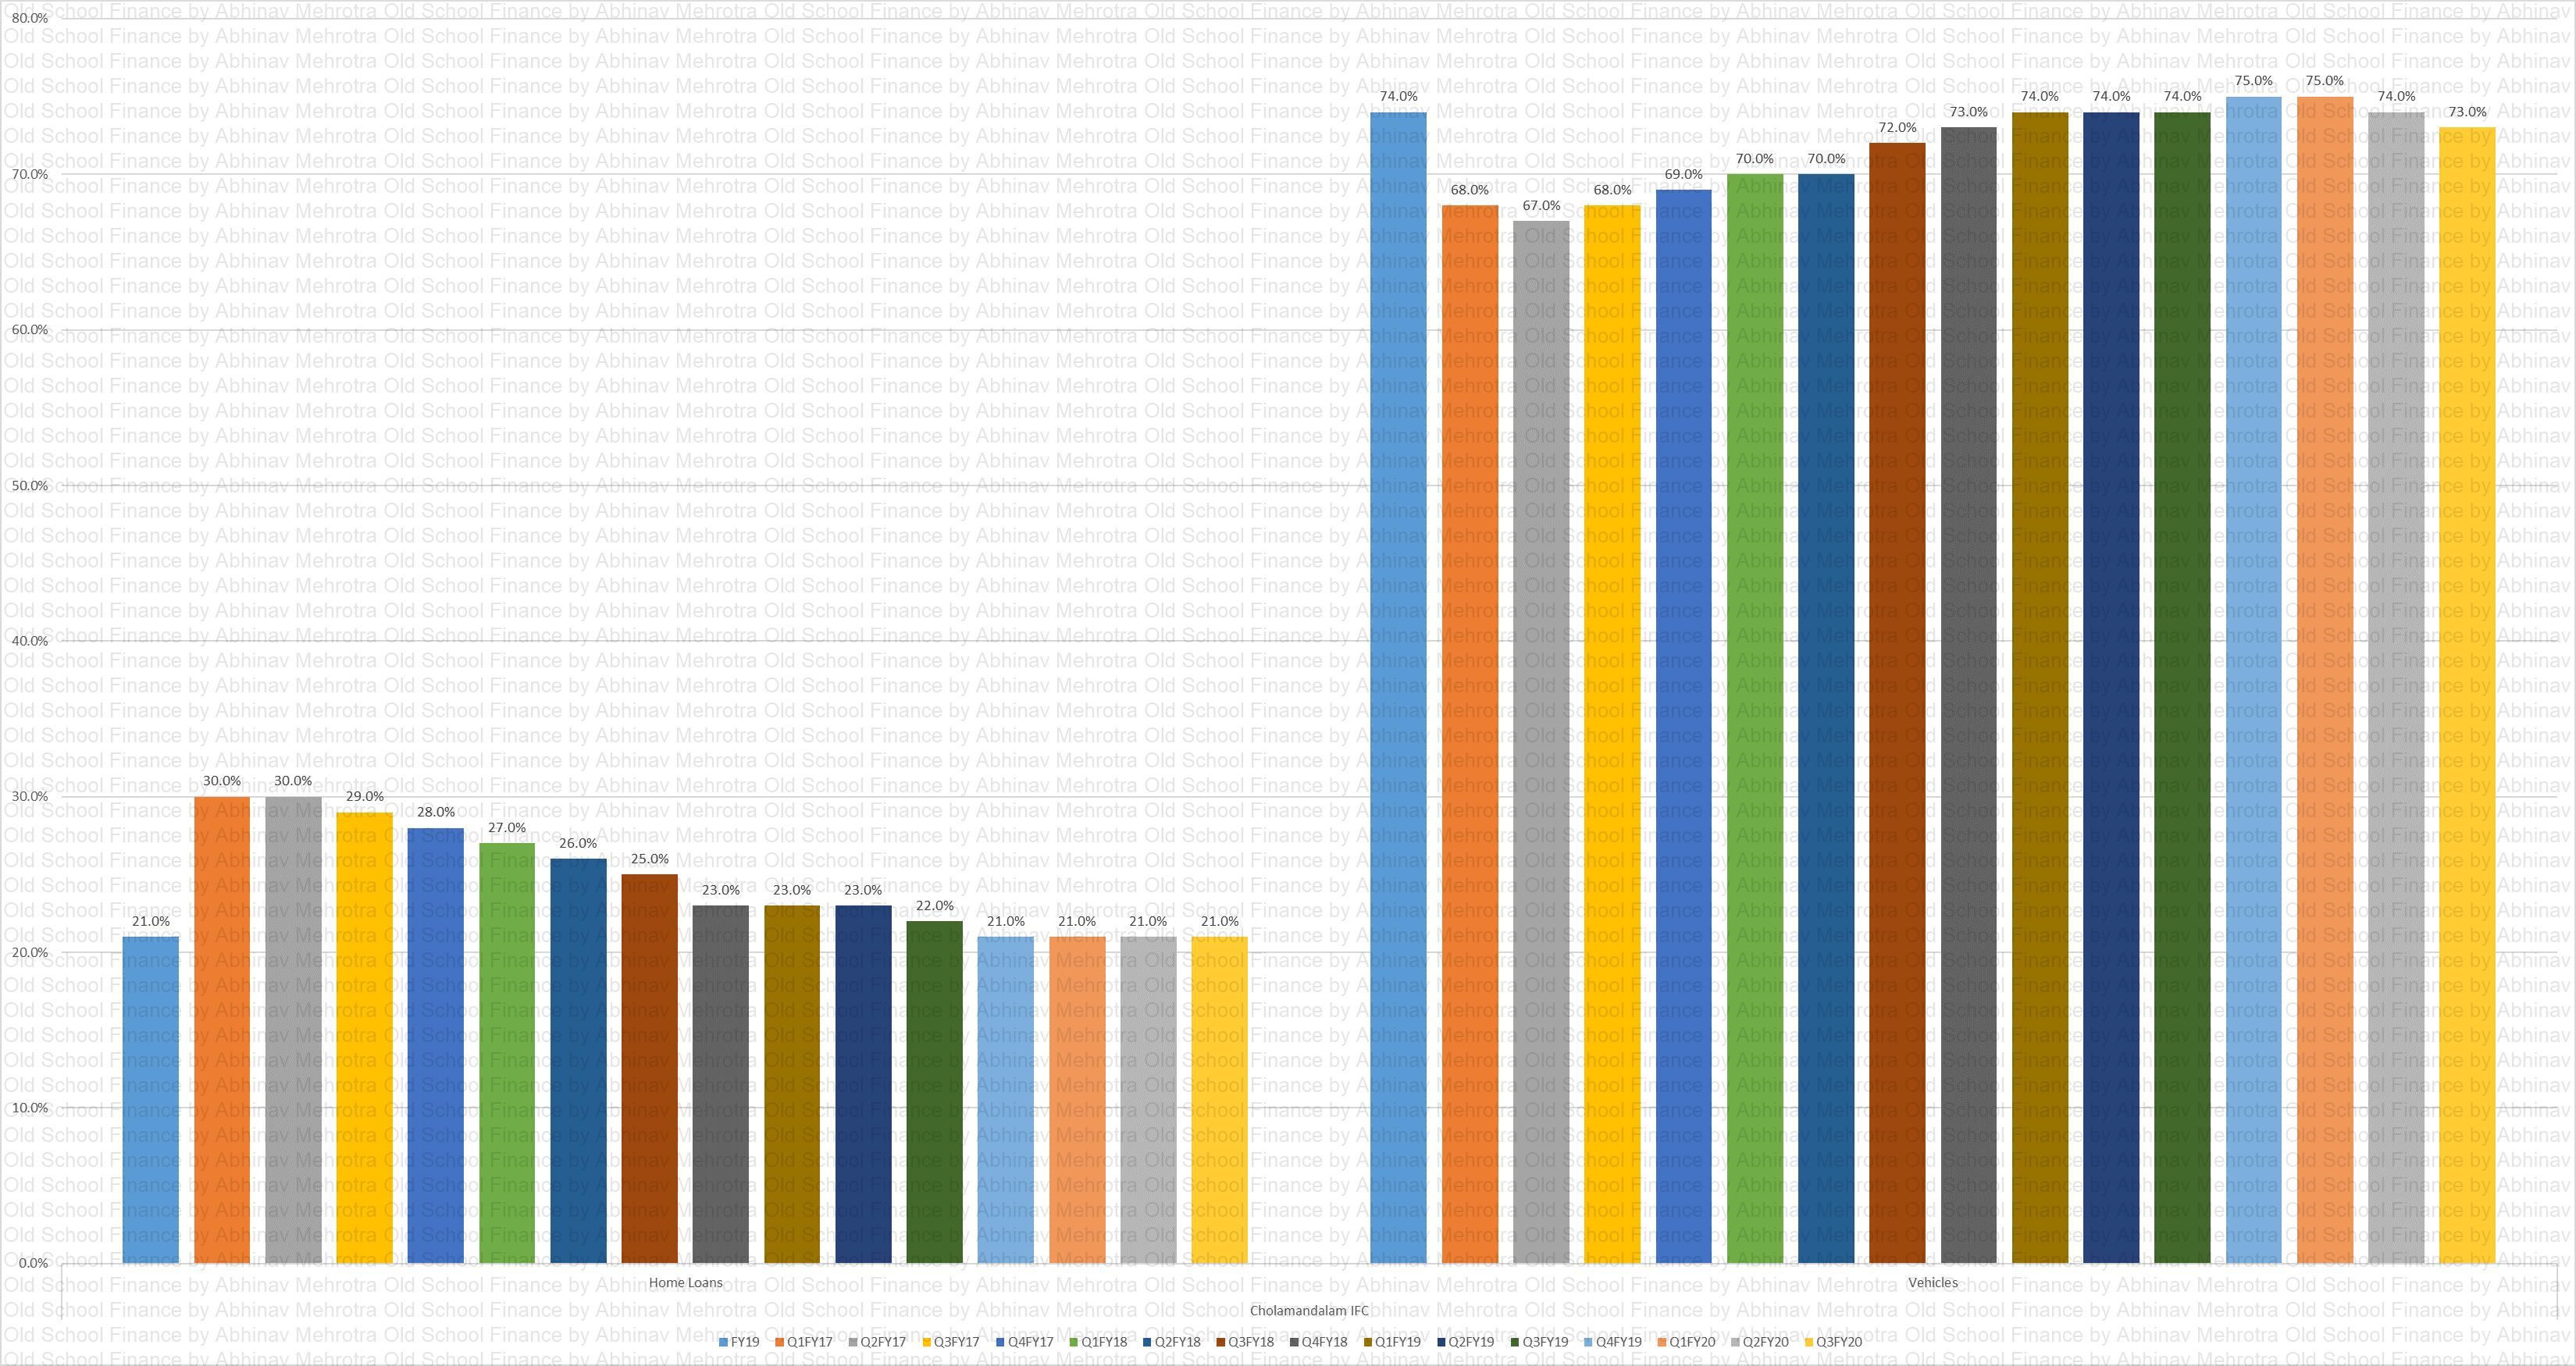
Chola LBS
Chart 11 – Chola’s loan book is dominated by vehicle financing which forms 70+% of the book while the rest is home loans.
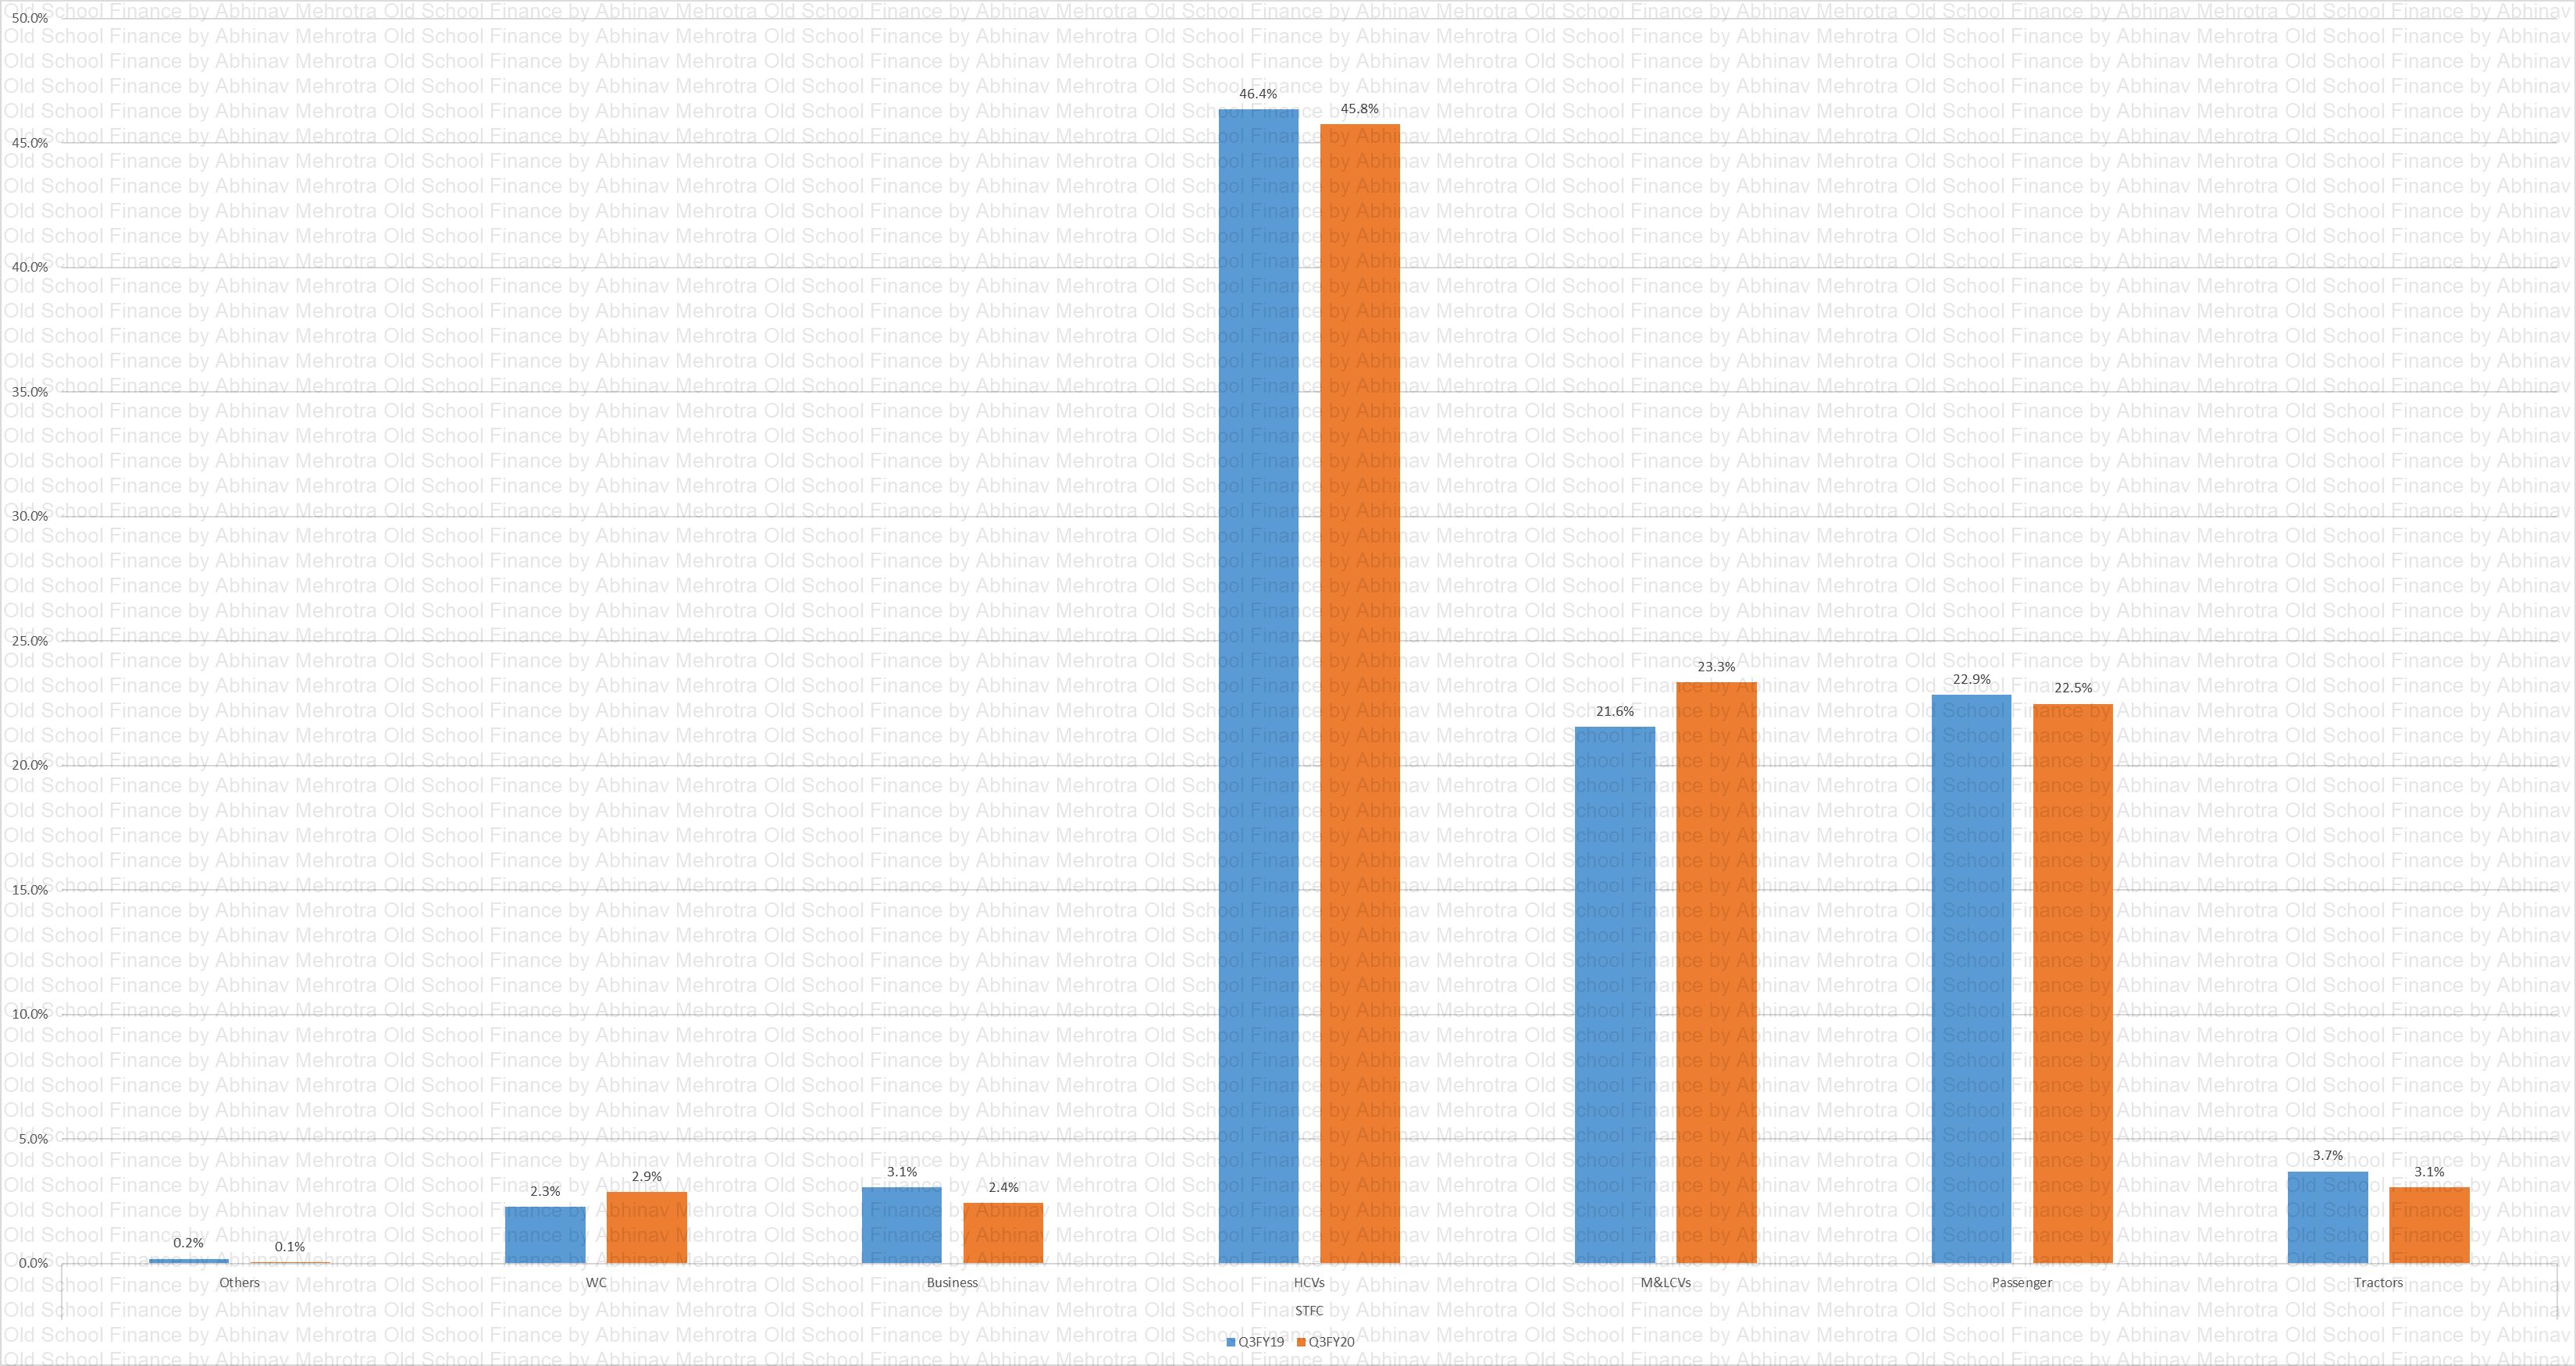
STFC LBS
Chart 12 – STFC’s loan book is also dominated by vehicle finance however we have more segmented data available. Heavy CVs form 45% of the book, Medium and Light CVs form another 23% and passenger vehicles form another 22%. They also do a bit of tractor finance, business and working capital loans.
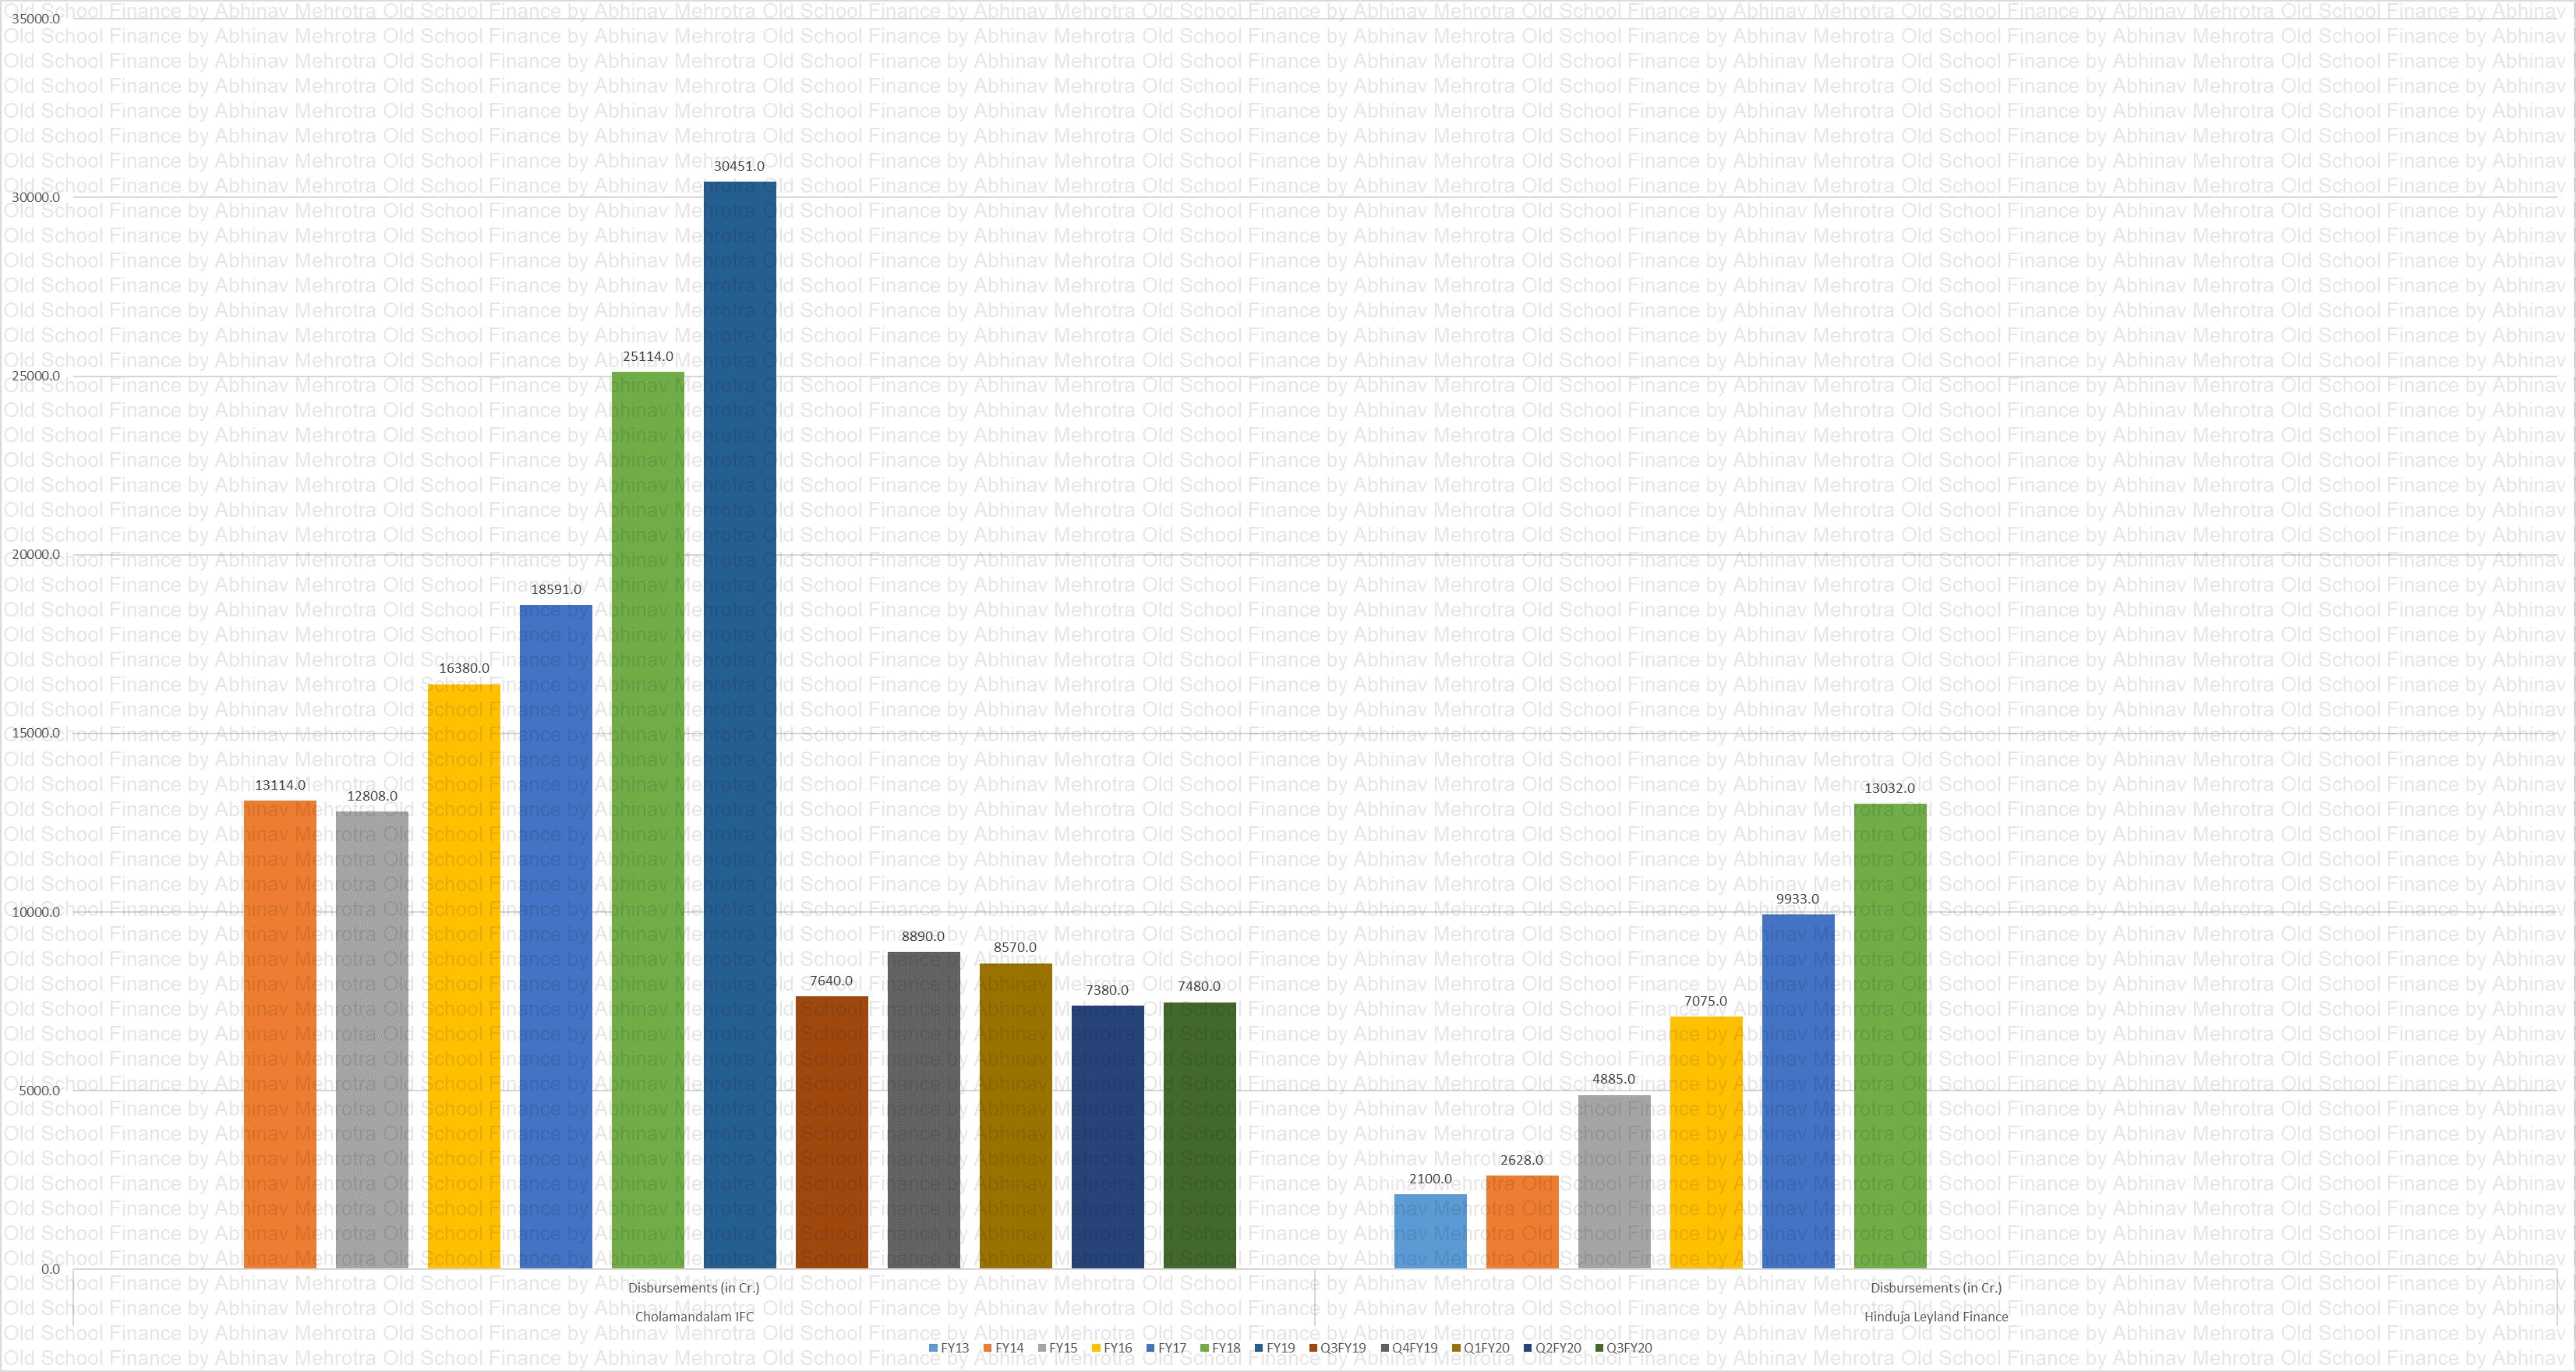
Disbursements Peer
Chart 13 – In terms of disbursement Chola is almost 2x of HLF.
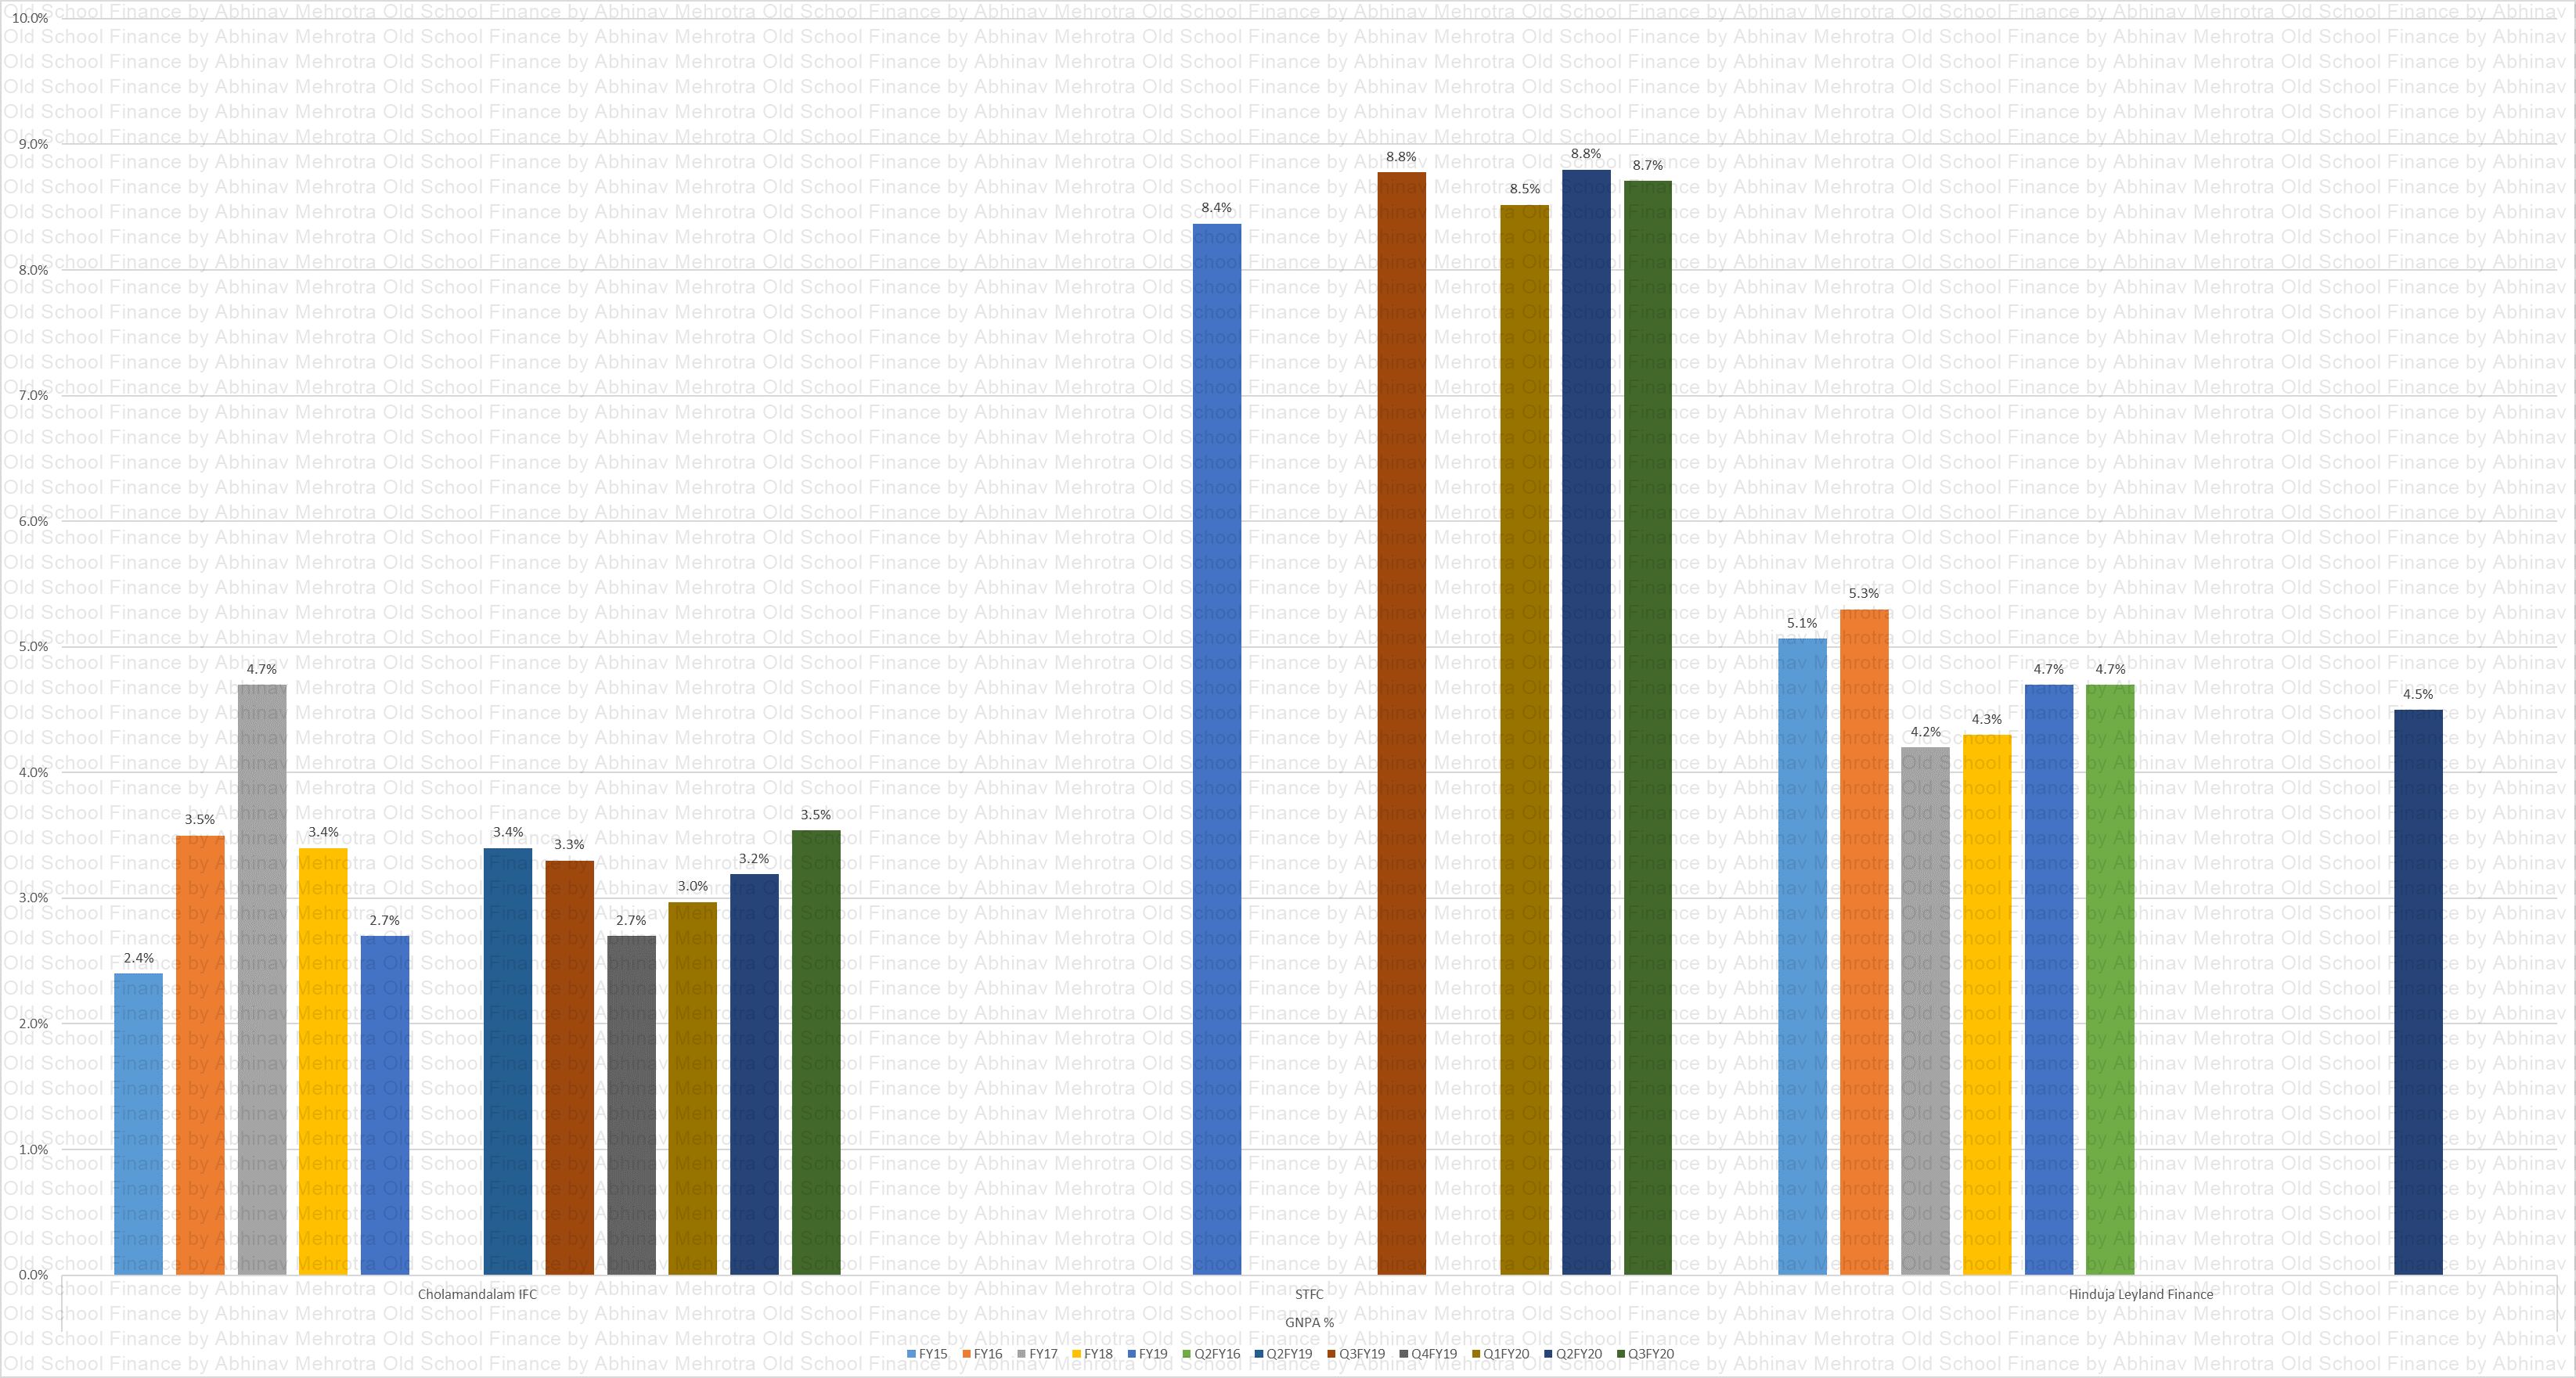
GNPA Peer
chart 14 – This is where the underwriting practices of the different managements are tested, STFC clearly has some issues, especially on such a large seasoned book. HLF, while it is doing better than STFC, also has elevated GNPAs especially on a book that is the smallest of the lot. Chola is the star here with contained GNPAs on large book size.
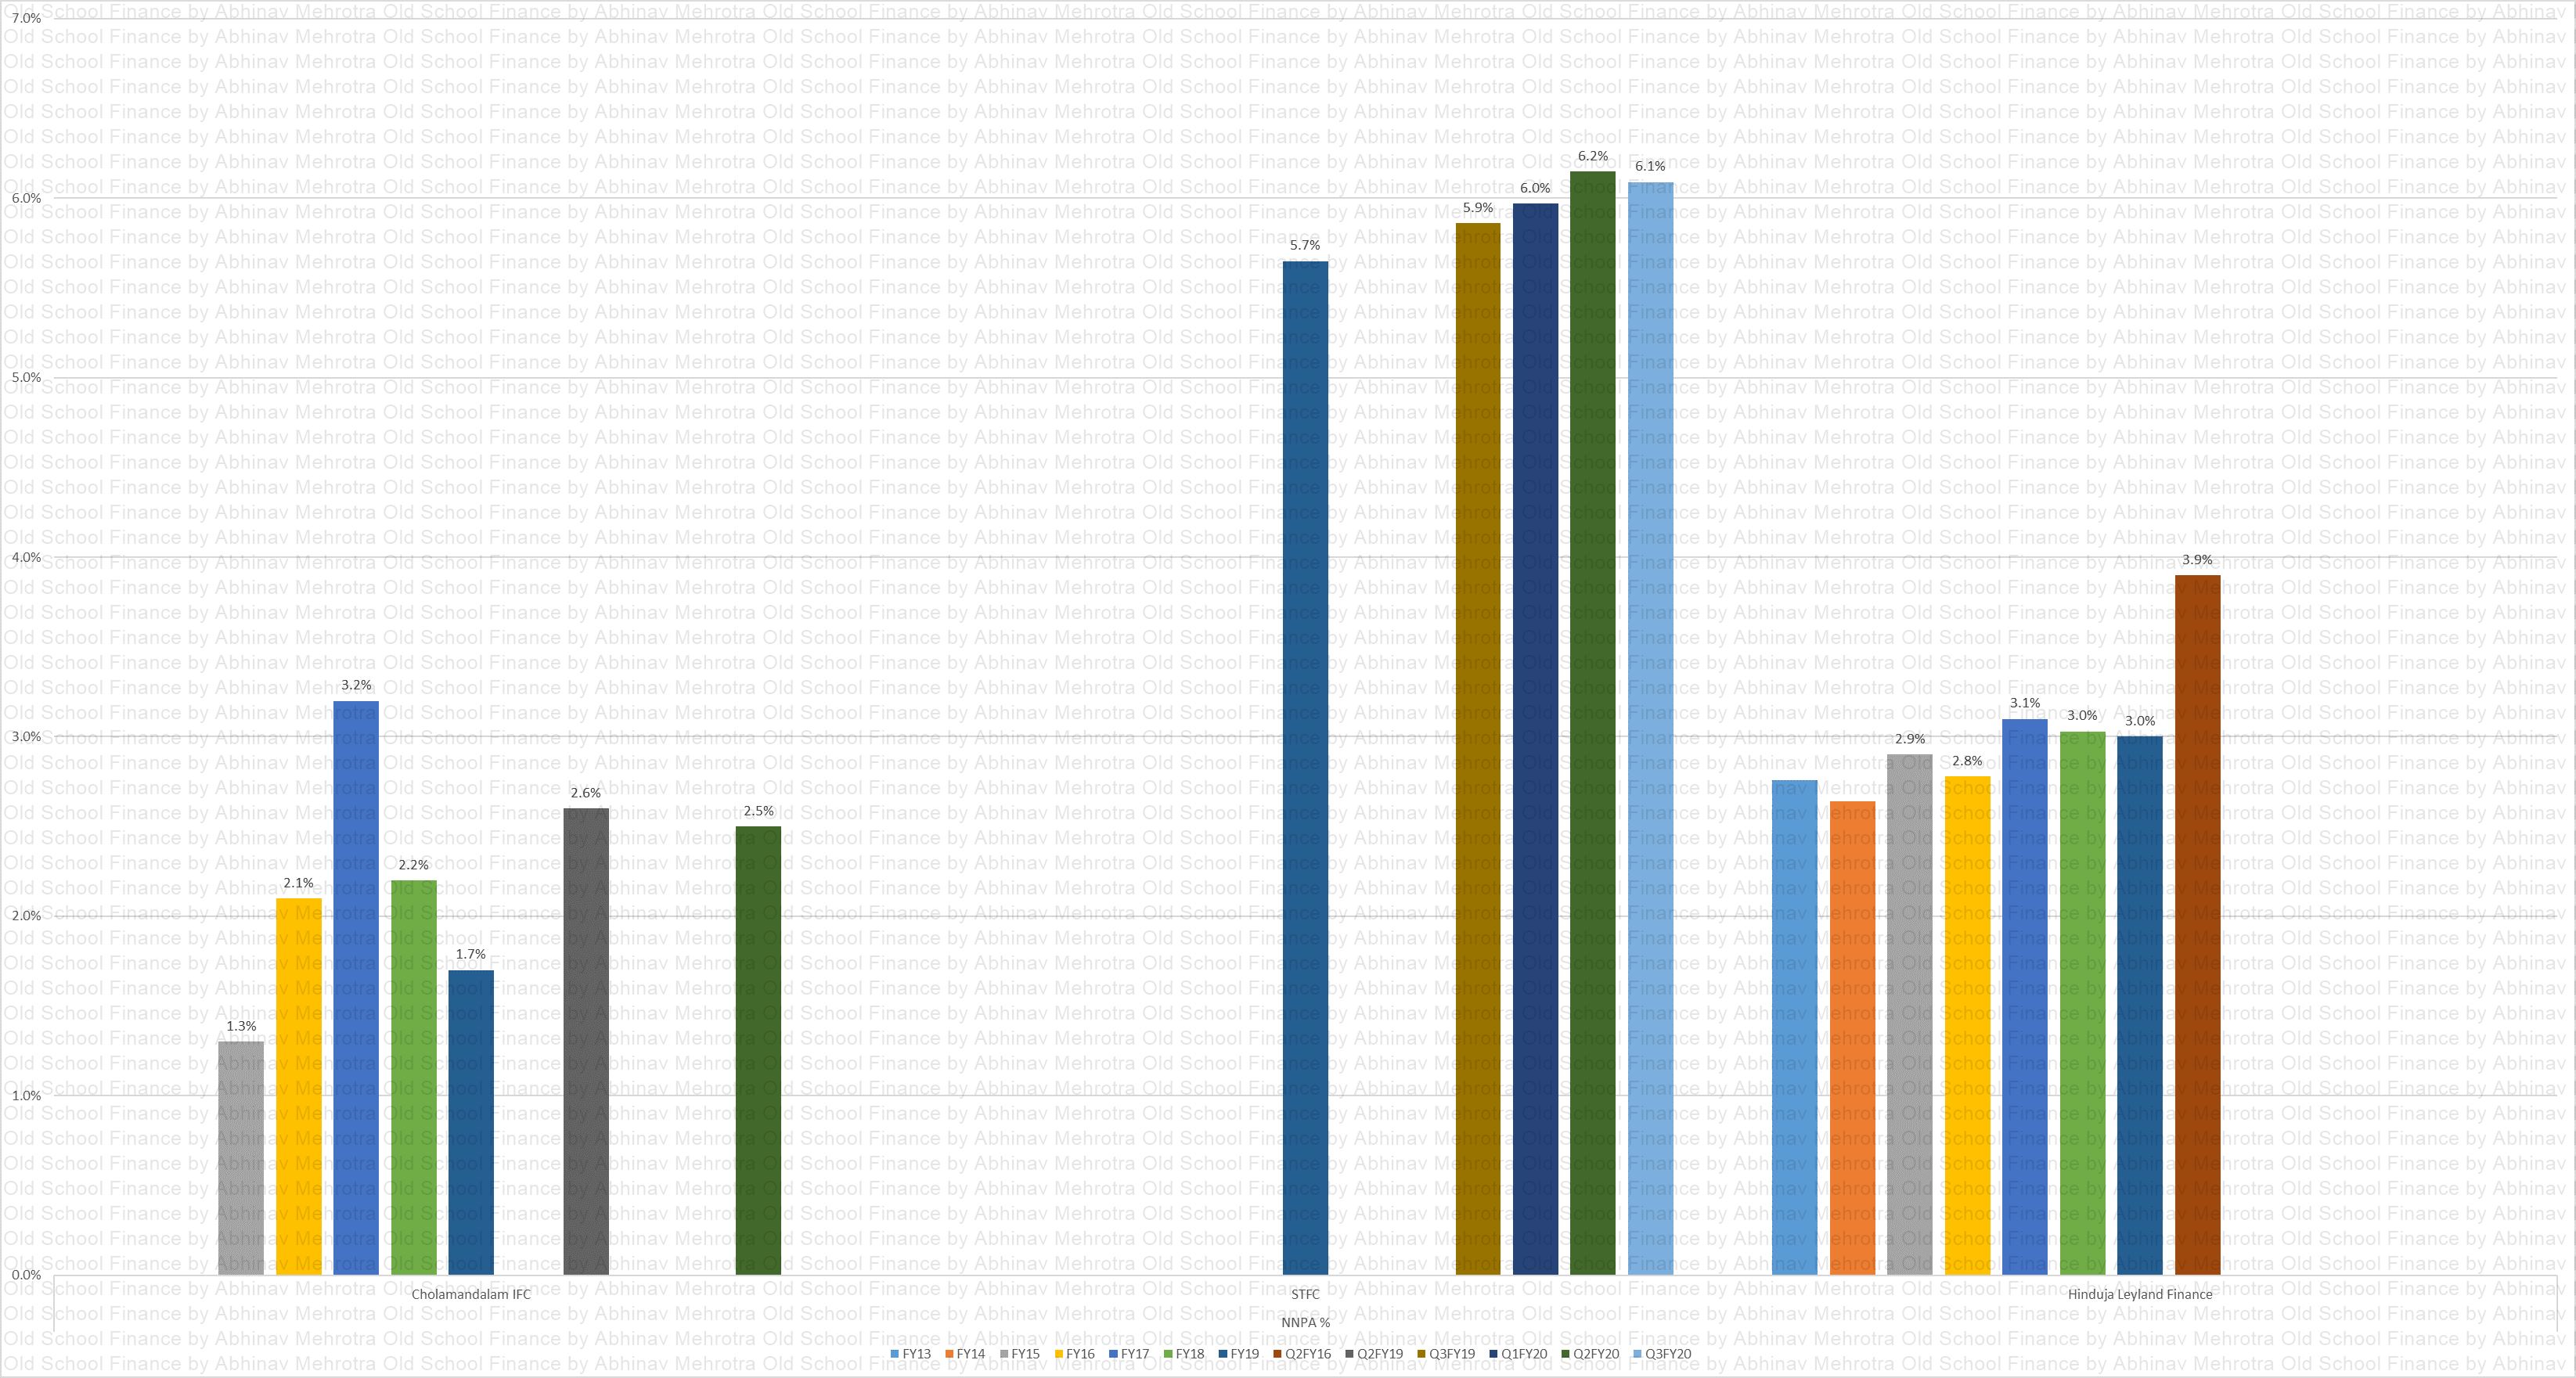
NNPA Peer
Chart 15 – Again similar story continues as above, CV financing is not bulletproof even though it is secured, it is affected by the cyclicality in the logistics business. The management of one of the companies in a recent conference call did say that our NPAs move with the cycle, in tough times the borrower’s cash flow is stressed but the cycles do not last for long and once business picks up the borrowers get current with the payments.
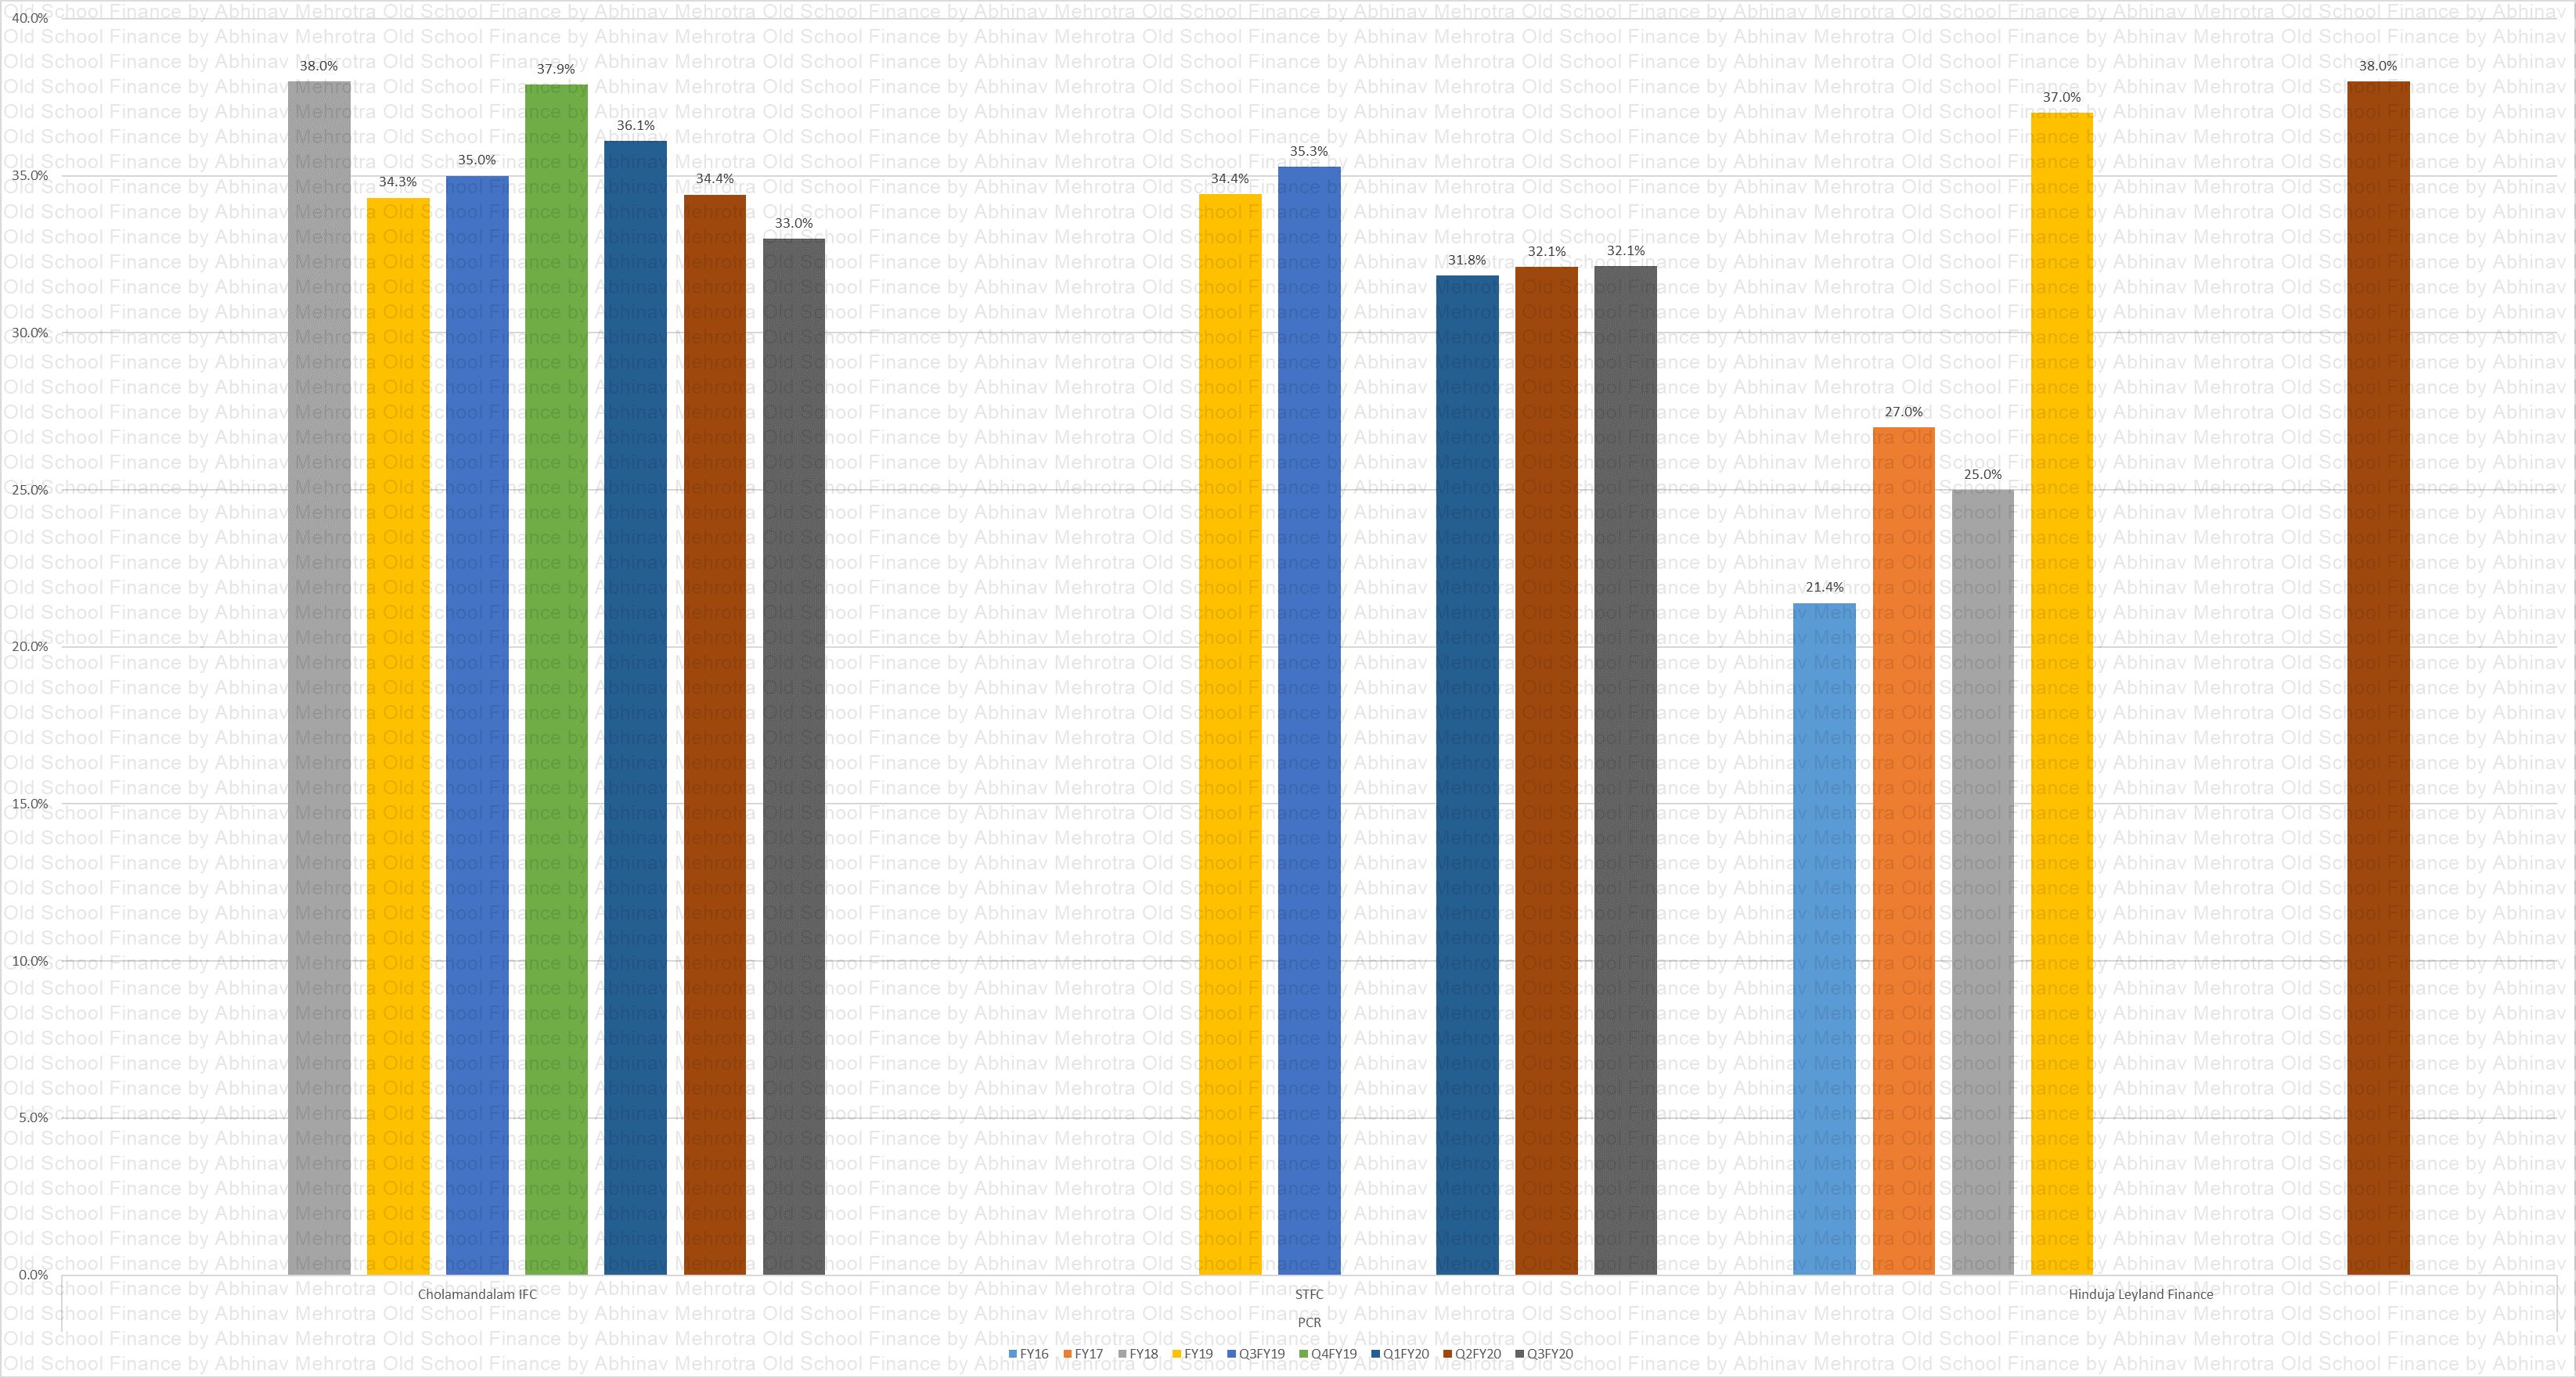
PCR Peer
Chart 16 – The provisions coverage ratio of all the company’s is in sub-40 range. This is probably due to the secured nature of lending and lower LTVs. However, it would not hurt anyone to see some higher PCR and reduce those NNPAs further. It will reflect a truer P&L.
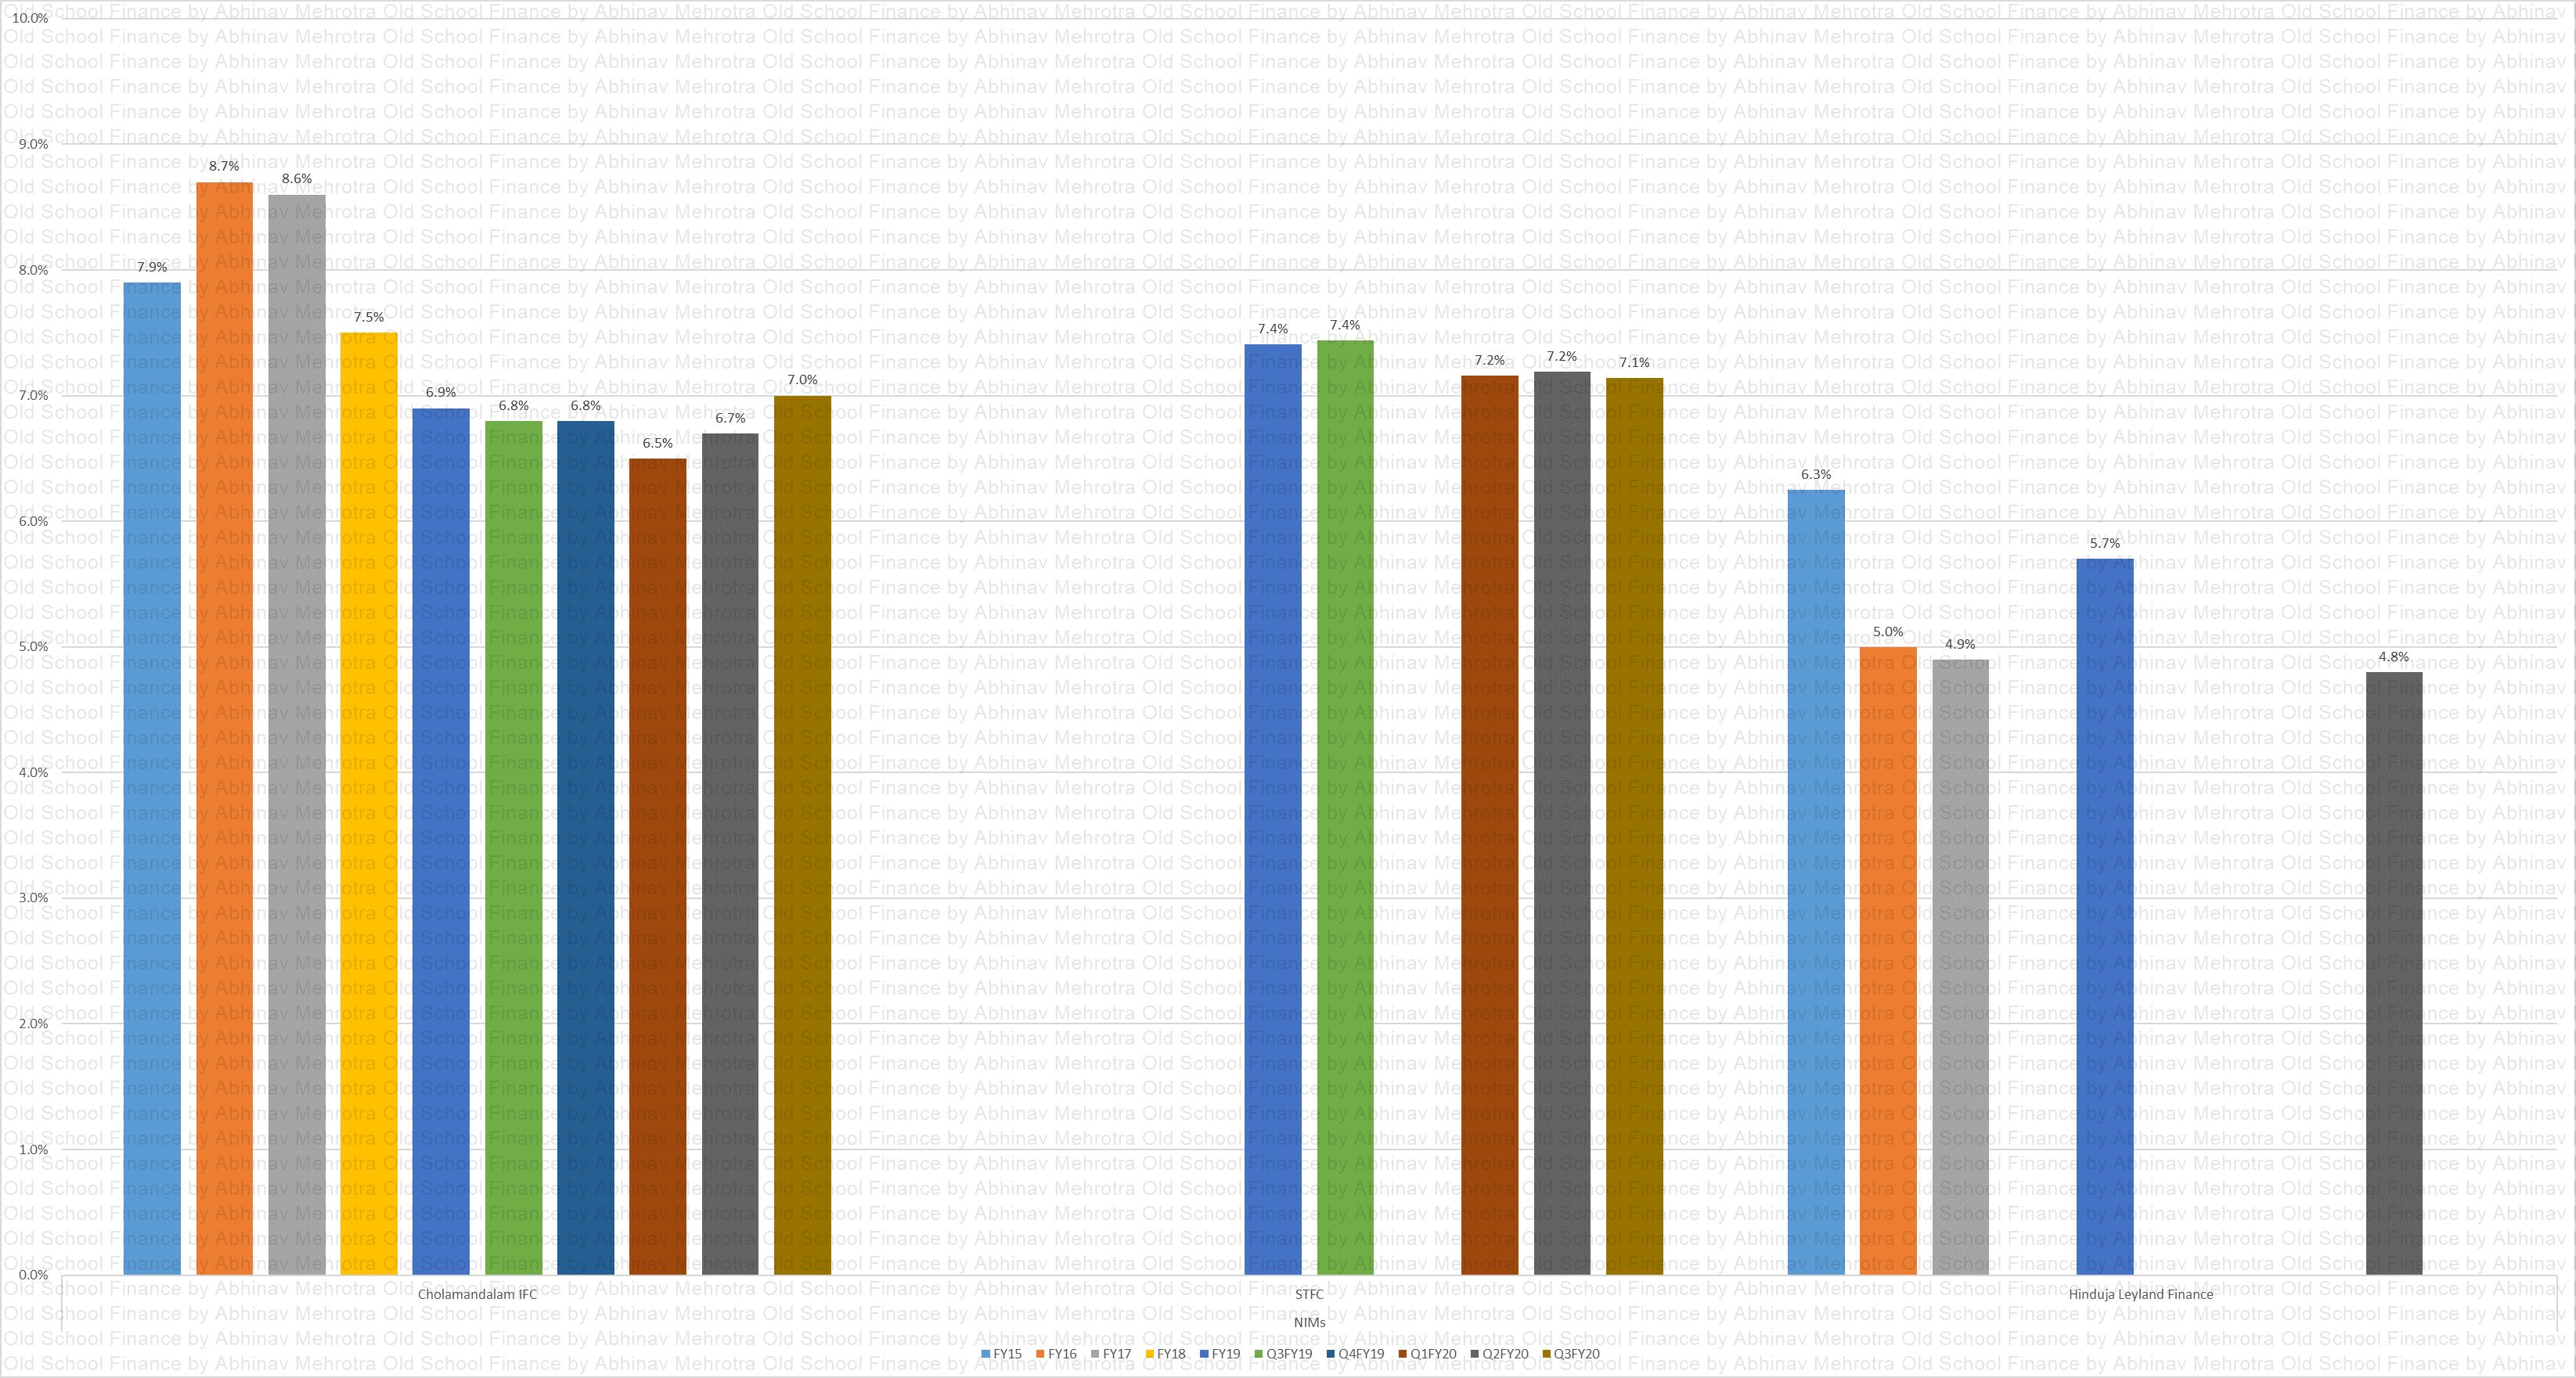
NIMs Peer
Chart 17 – NIMs used to highest for Chola in the past however they are at par now with STFC. HLF’s lower NIMs means either they are having trouble sourcing cheaper funding or they have to price their loans lower to compete with the biggies. I would have loved to compare the cost of funds and book yields of these companies but I do not have that data yet.
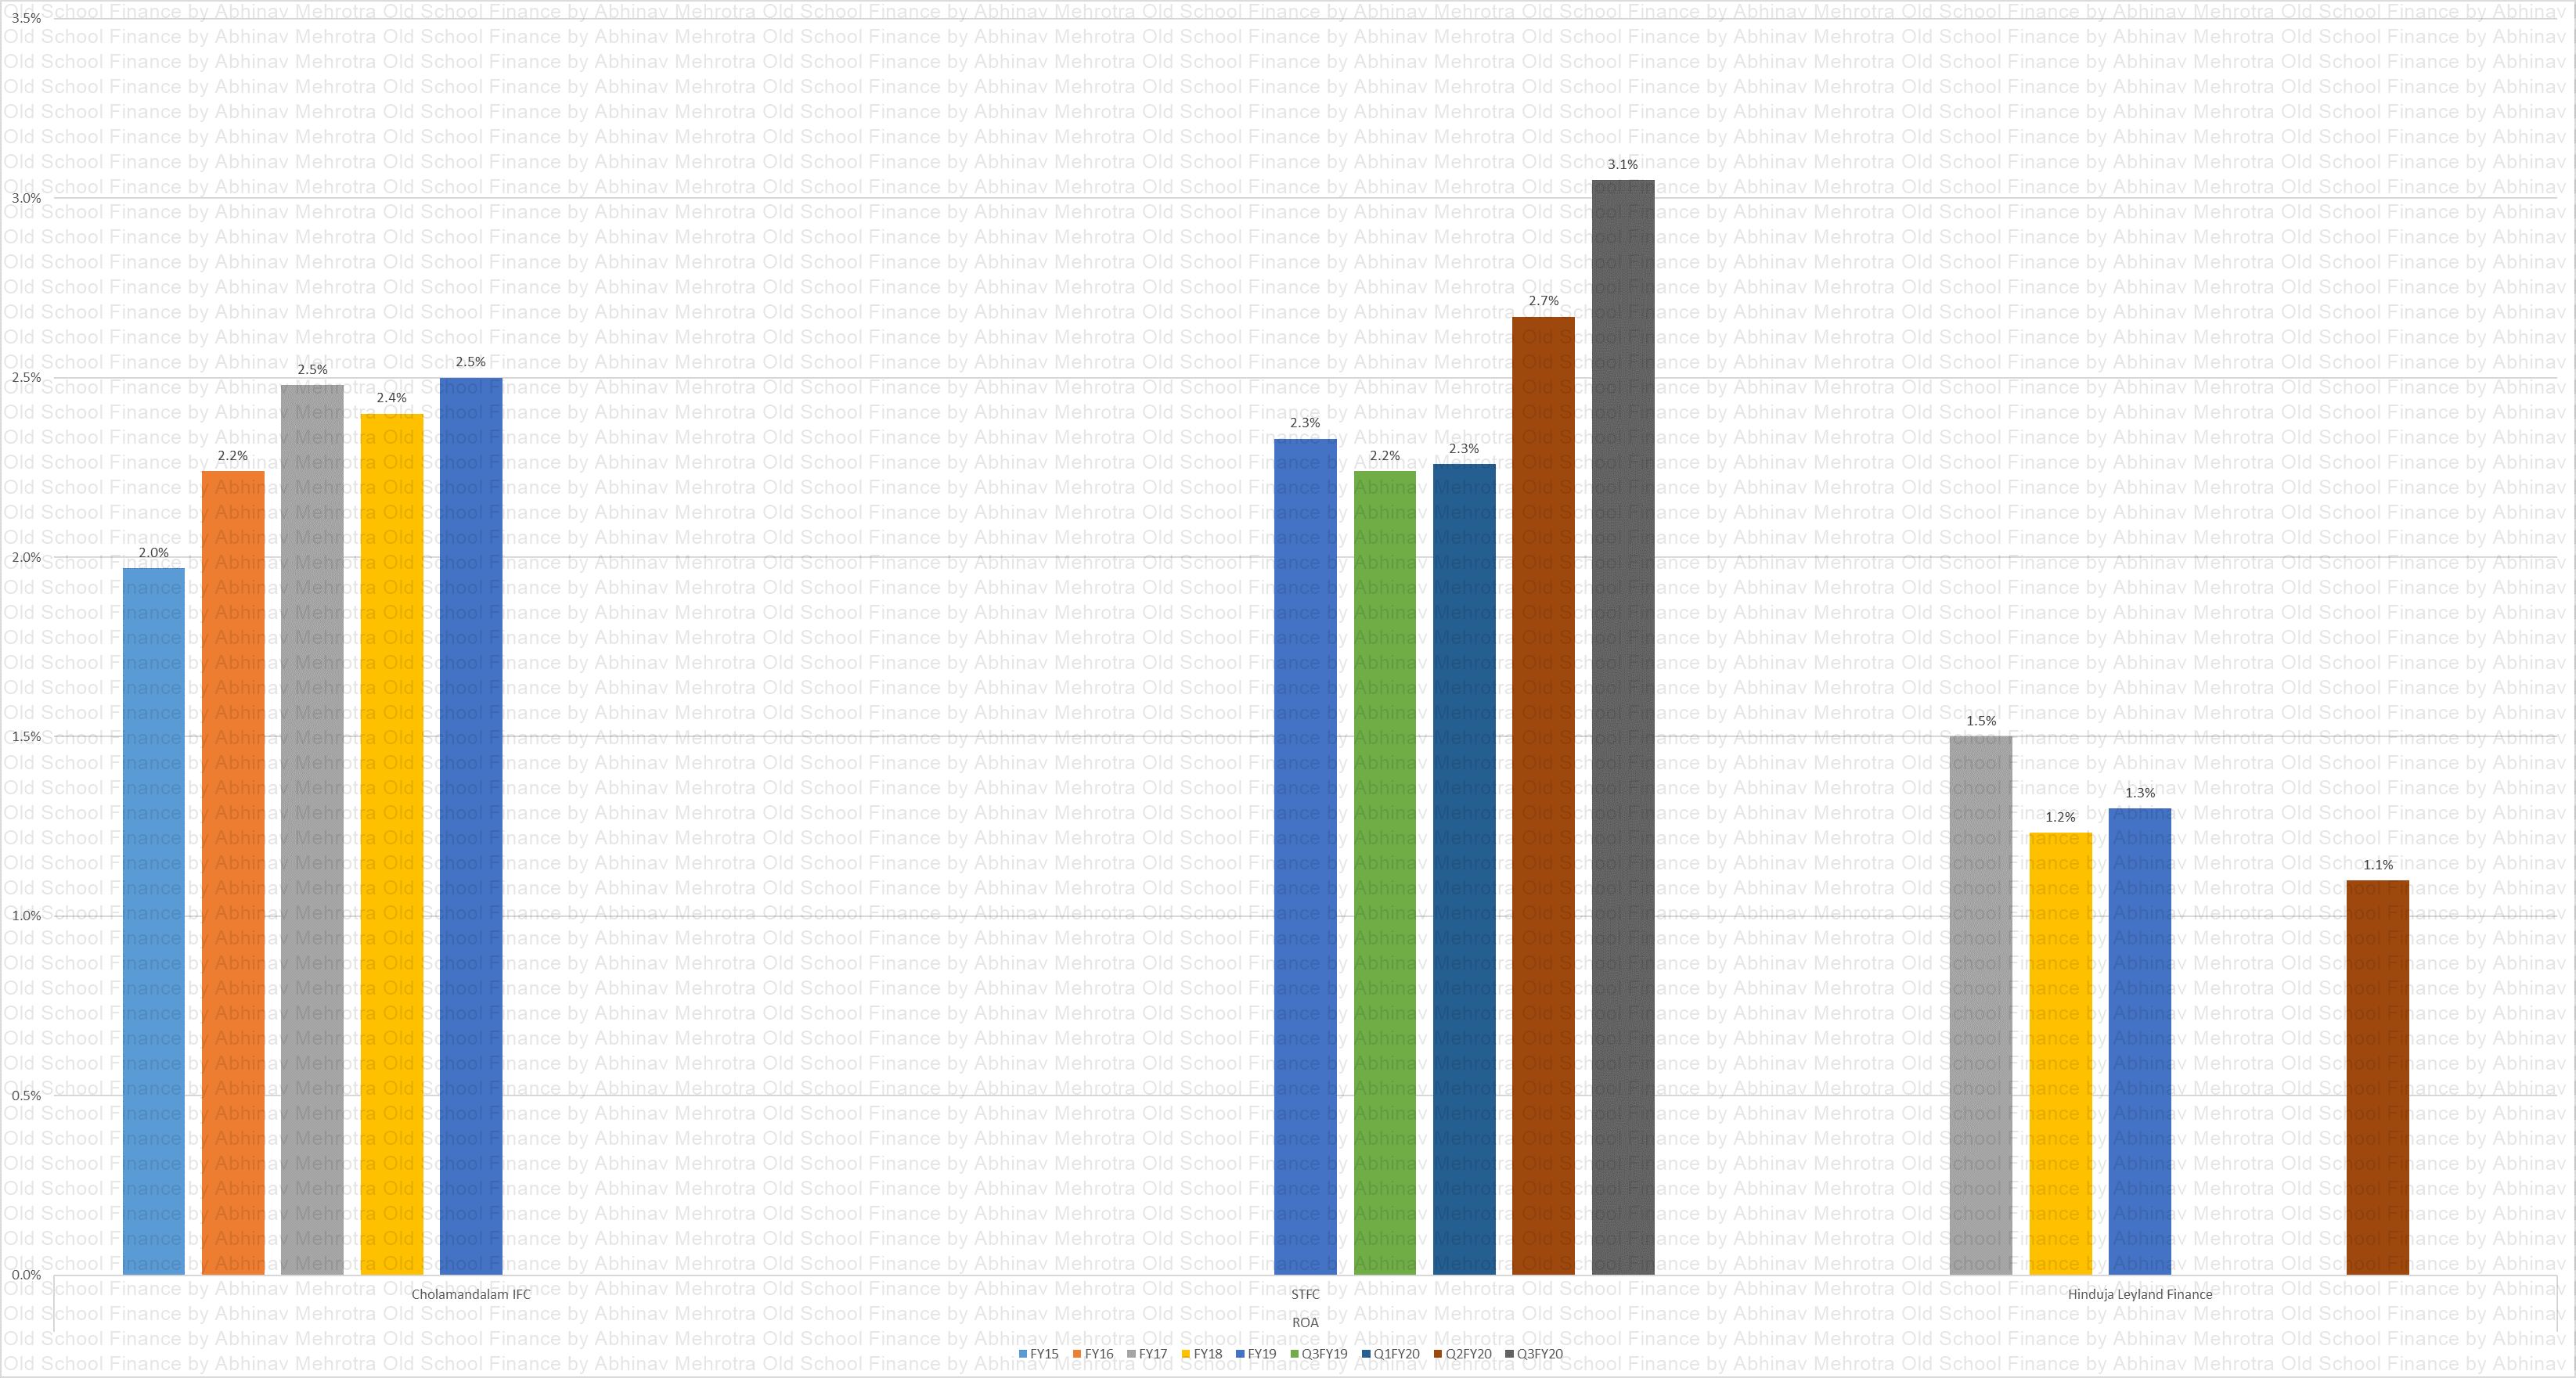
ROA Peer
Chart 18 – In terms of ROA, HLF has a lot of catching up to do, while Chola and STFC were neck-to-neck in FY19.
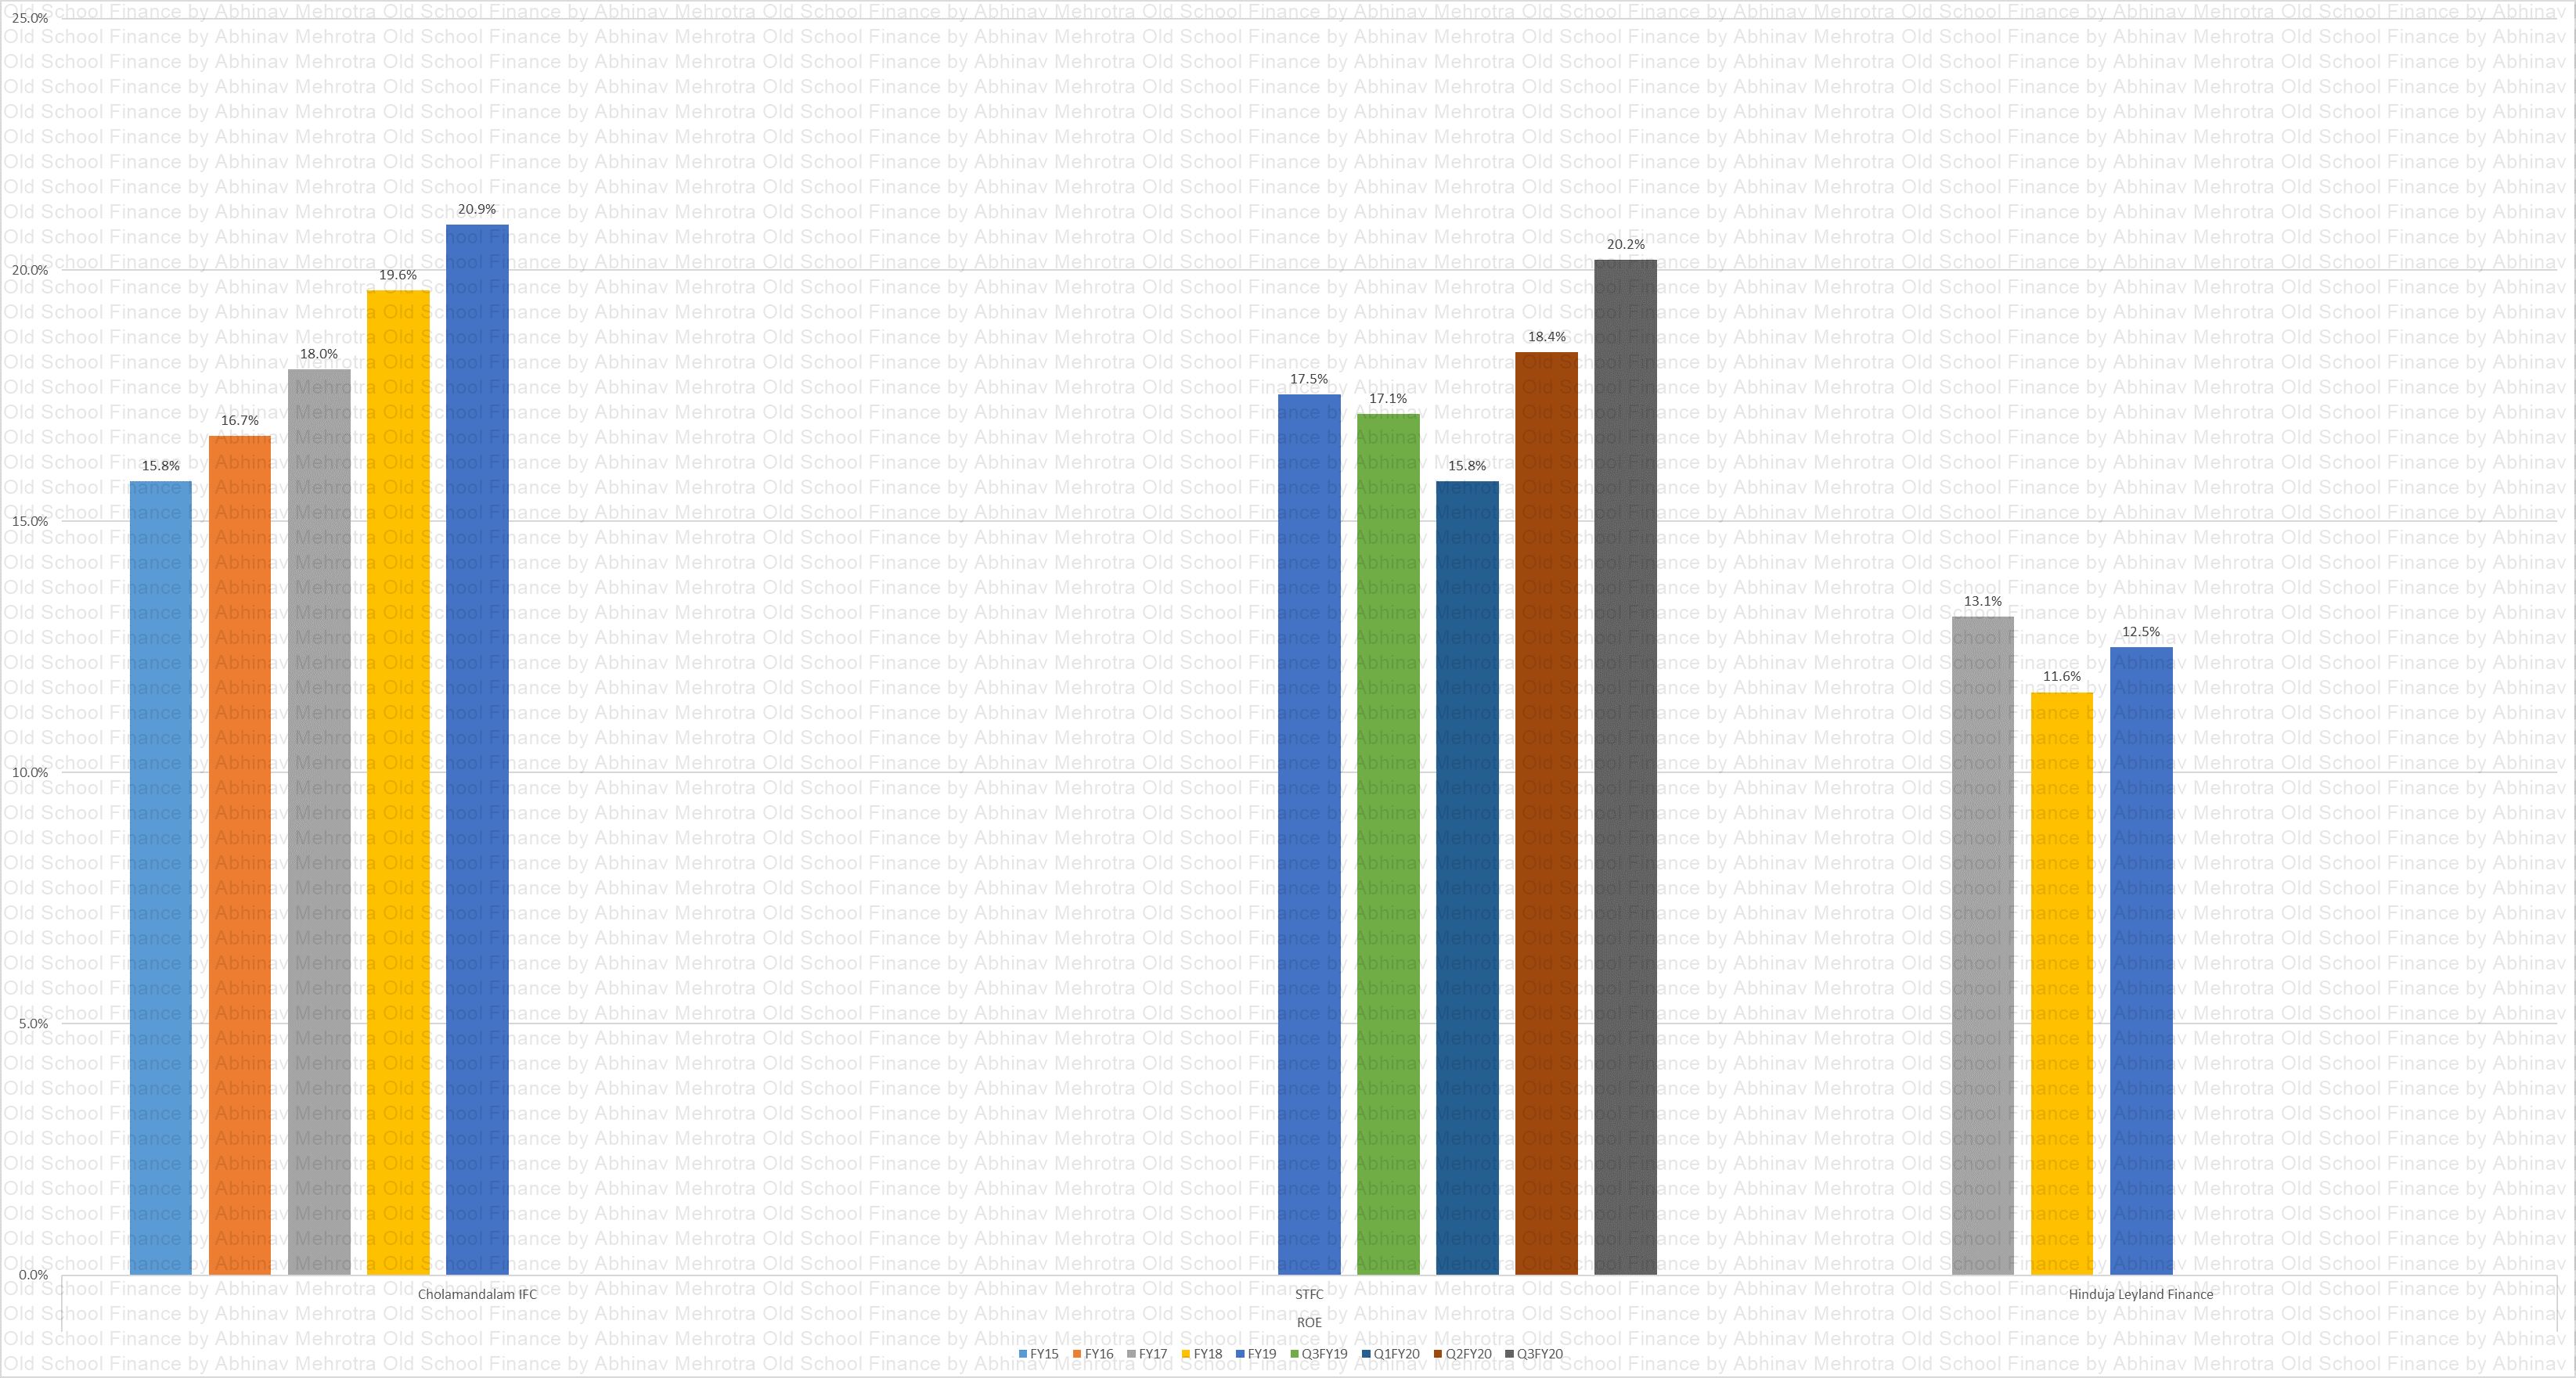
ROE Peer
Chart 19 – Chola is the winner here with superior ROEs.
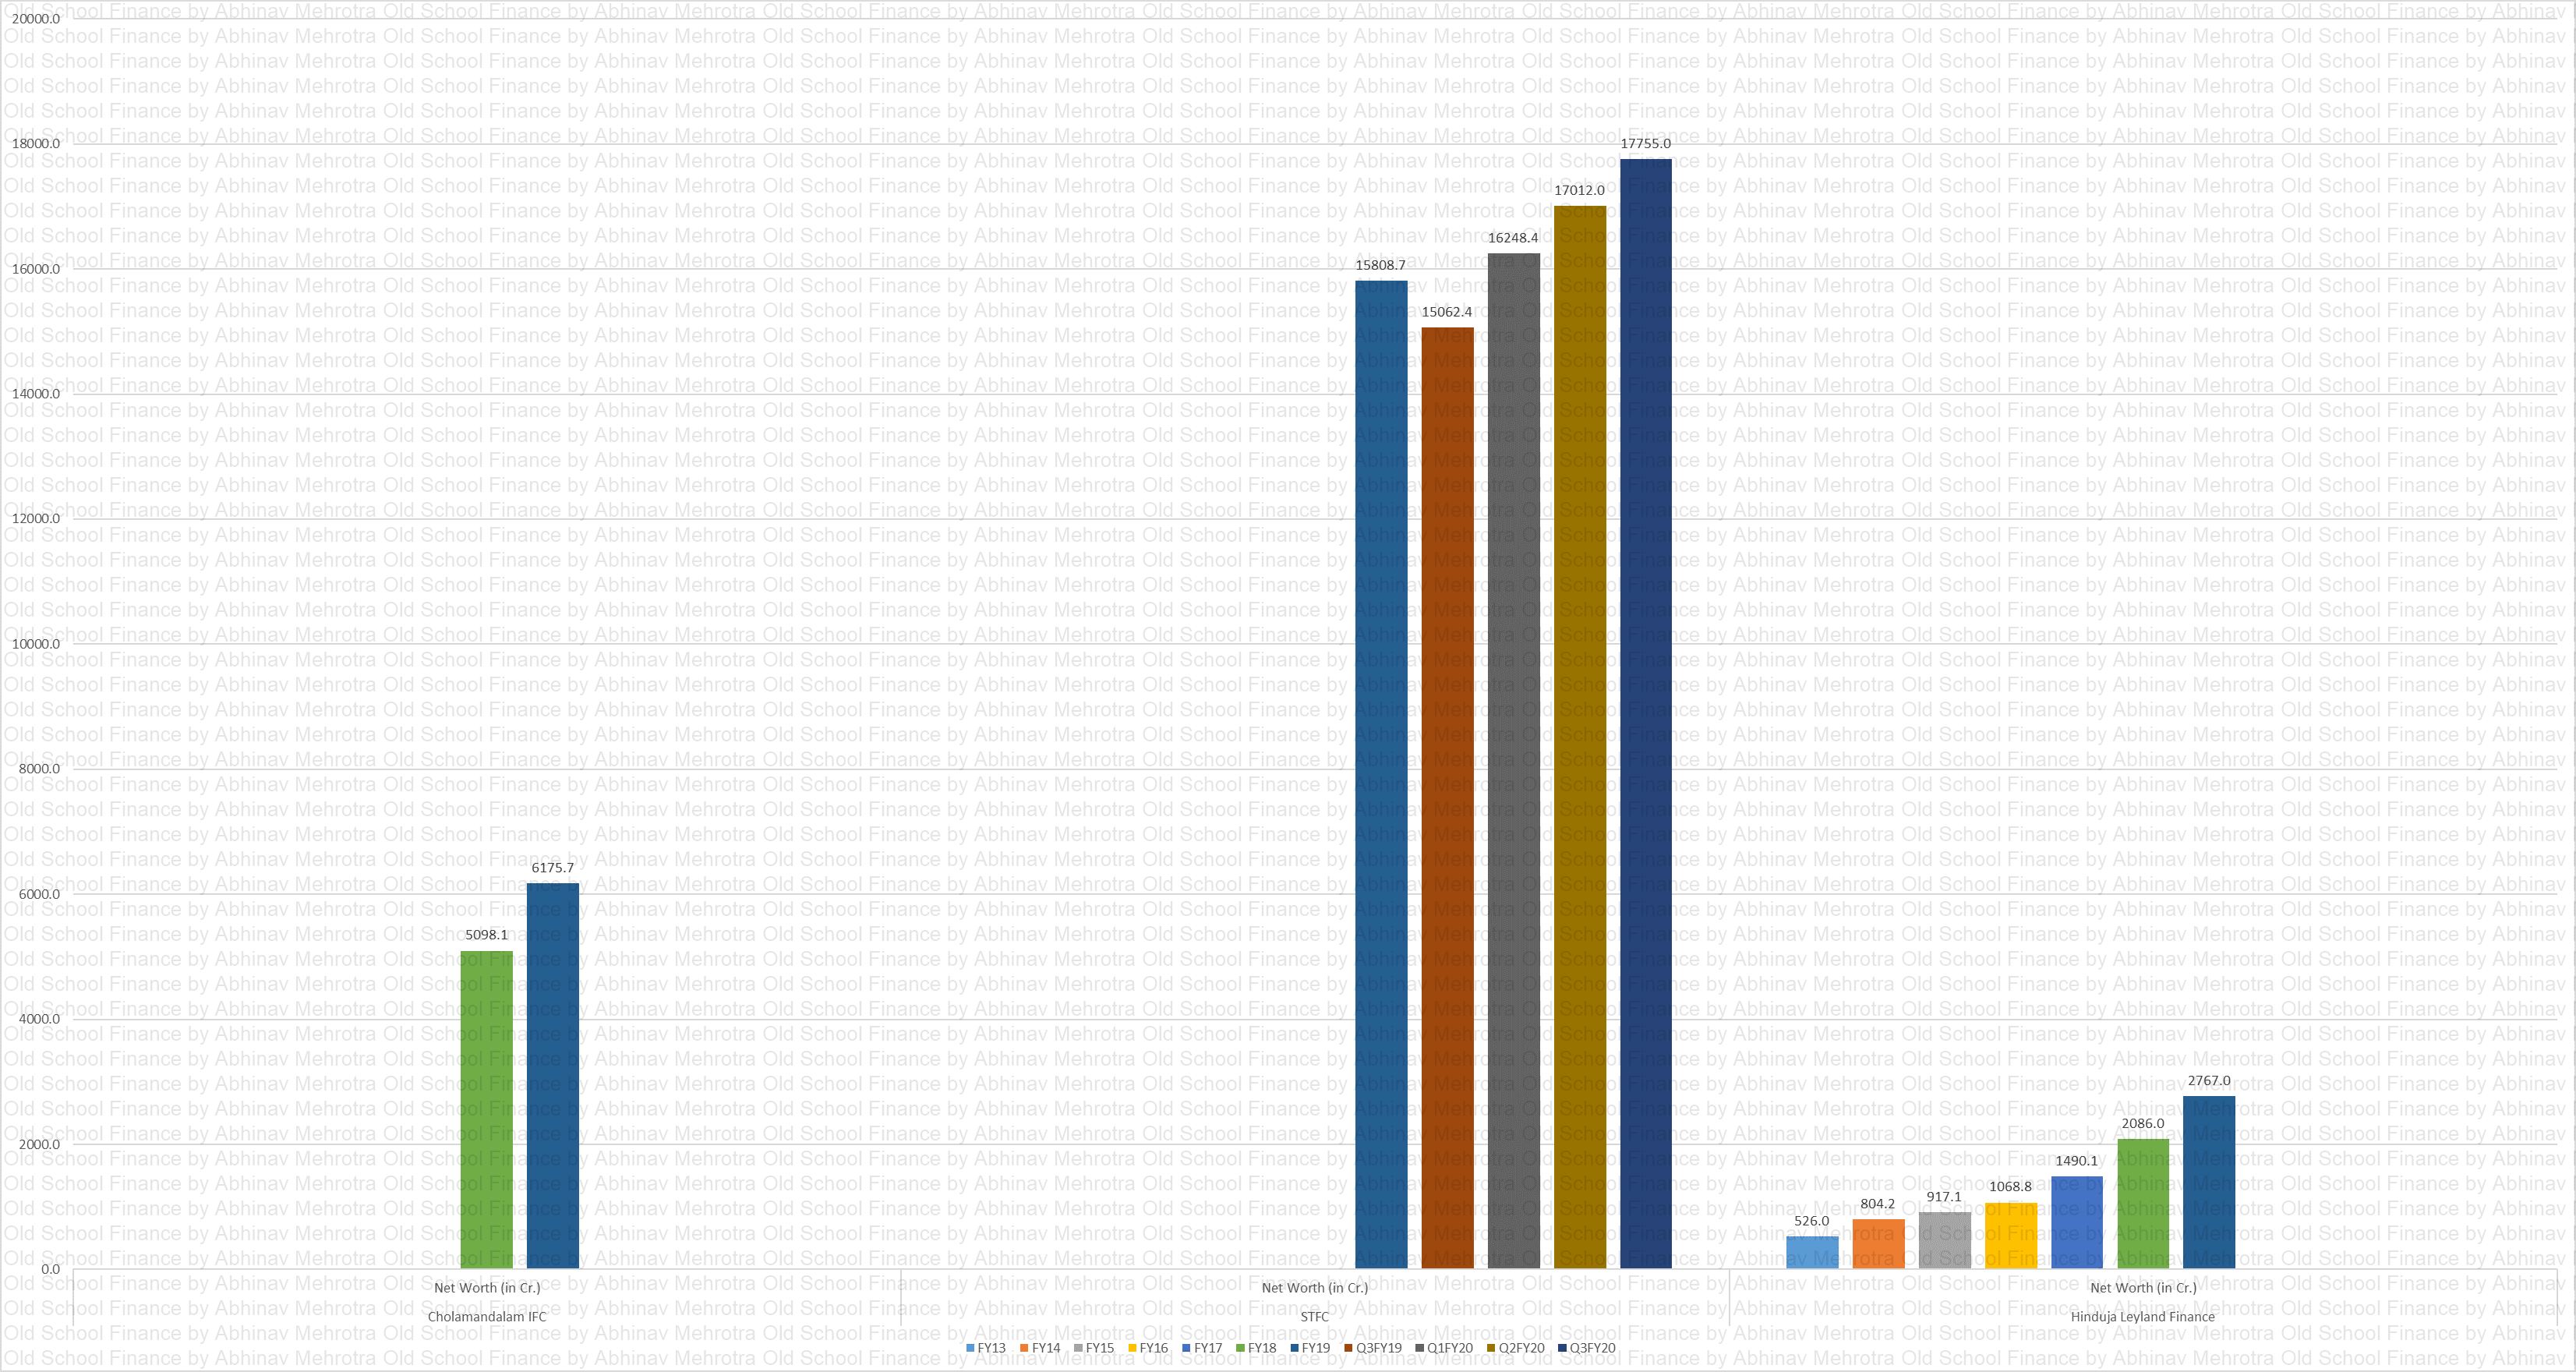
Equity Peer
Chart 20 – STFC is a behemoth in terms of the net worth it has collected over the years.
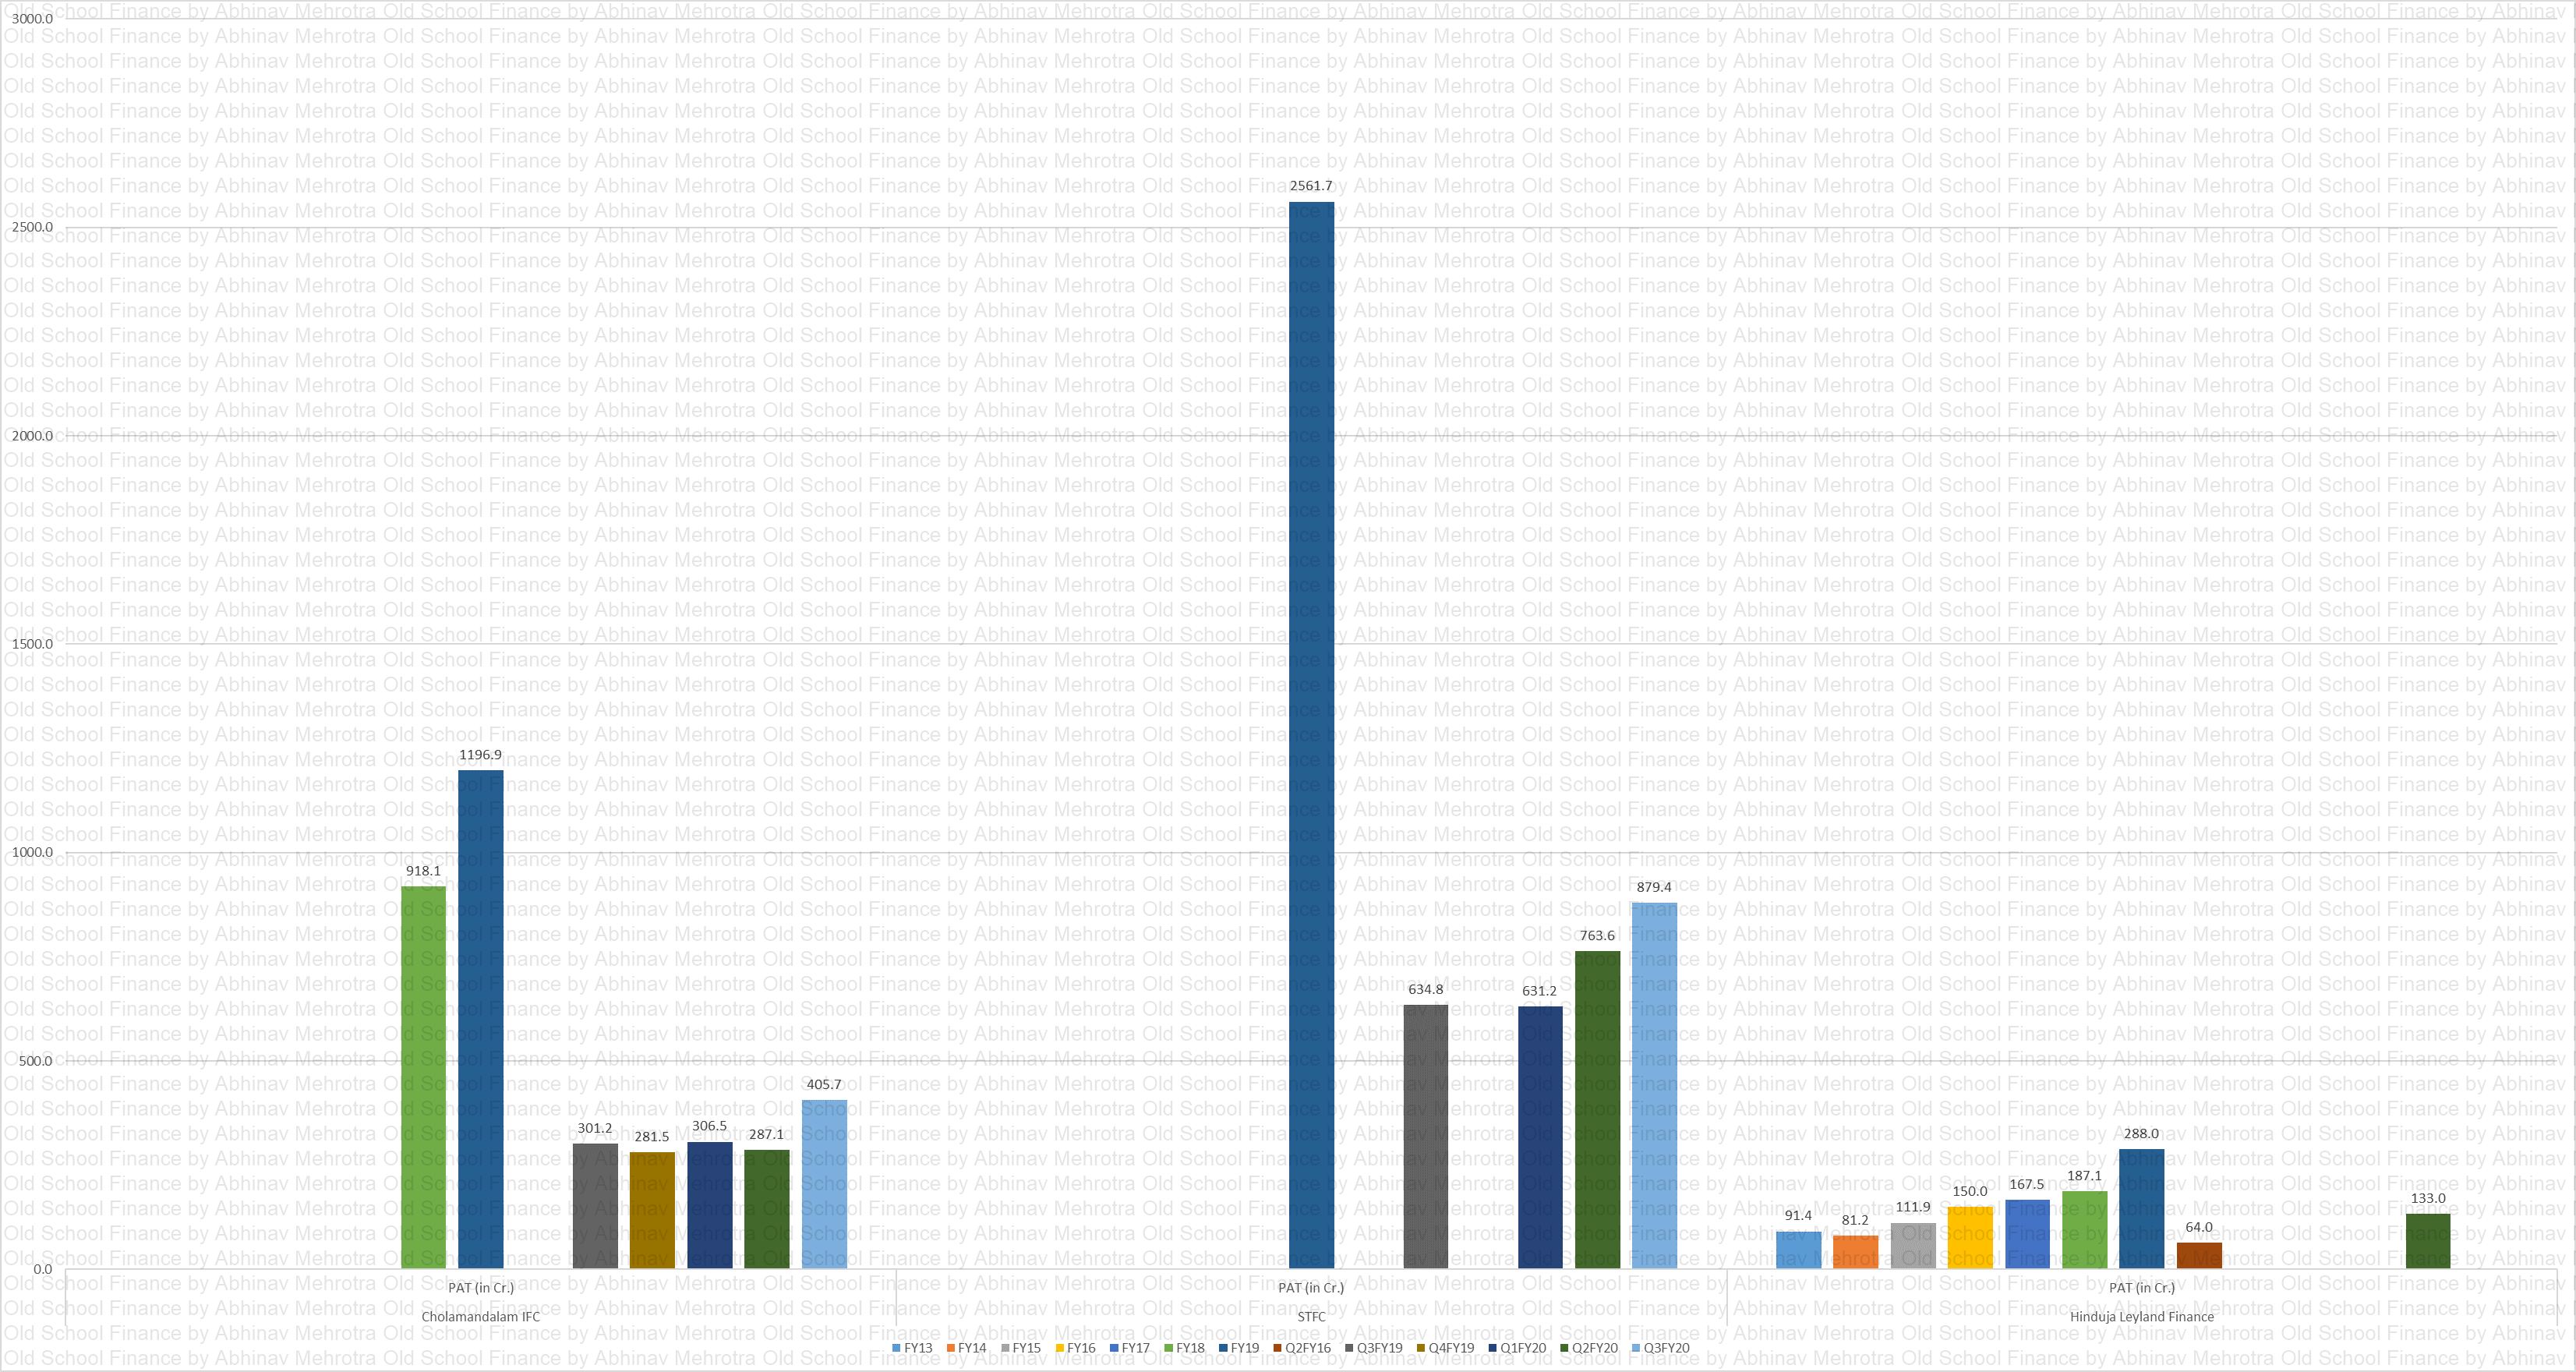
PAT Peer
Chart 21 – The size of the loan book directly affects the profits of the company.
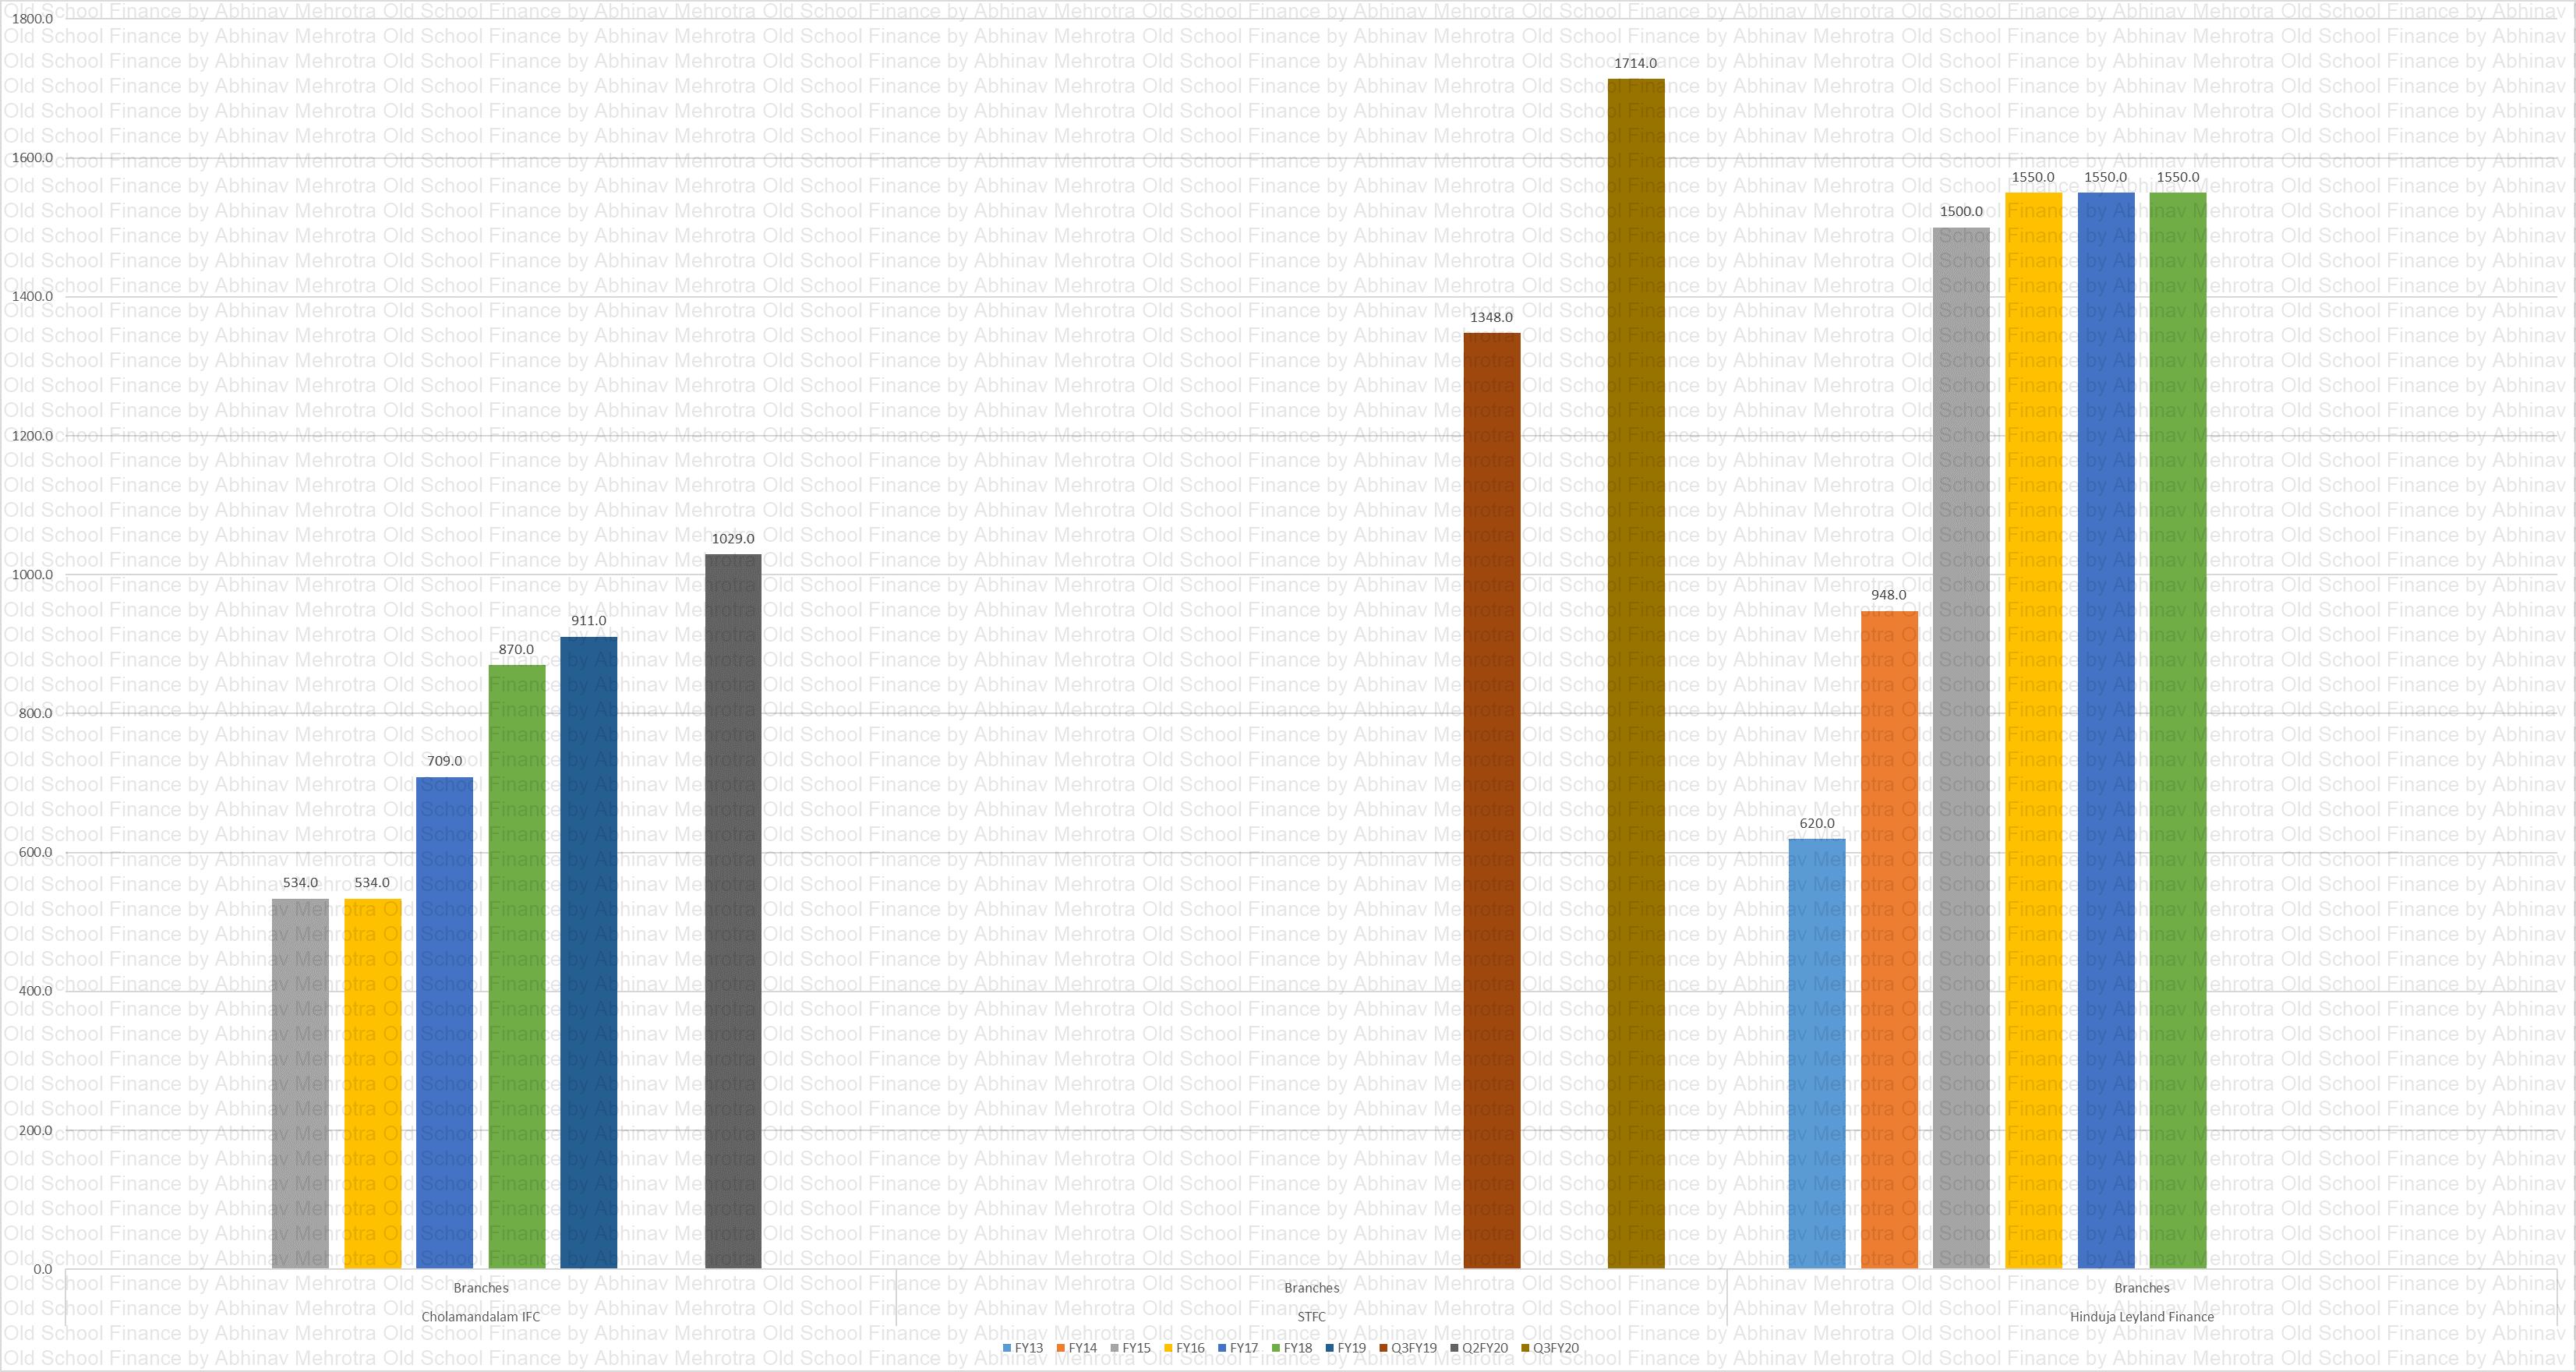
Branches Peer
Chart 22 – This is an amazing chart to cap off the analysis. Chola is giving some stiff competition with the least amount of branches. While HLF has expanded its branch network well before its loan book is grown.
It would have been fun to see more comparisons in terms of business per branch or employees but pairing the superior ROEs of Chola with its smallest branch network shows that it is indeed the most efficient player with superior underwriting skills. However, it too is not immune to the business cycles of the industry it lends to.
Sources:
- Annual Reports
- Credit Rating Reports
- Investor Presentations
Chart Repository: