
Apar industry carporate presentation b804503e-5599-4b6a-9da6-39536490fc14.pdf (1.2 MB)
Can someone please throw a light on how big is their optical fiber business and how different it is from Sterlite tech in terms of product profile ? Do they compete with each other ?
1 Like
Promoter has been acquiring shares from market. Looks like value unlocking happening.
1 Like
My notes from Annual Report 2018-19
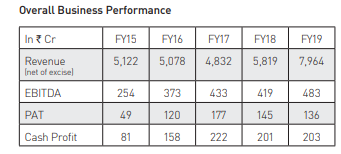
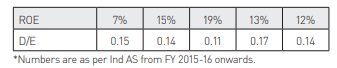
Overall Financial Performance
- Strong revenue growth but poor profit margins leading to EPS PAT fall.
- Challenging cost factors, including volatile base oil prices and steel prices.
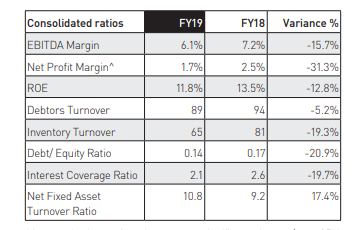
- Among the key ratios, there was a significant change (over 25% versus FY18) in the Net Profit Margin mainly with profitability in the Oils segment due to mid-year volatility in base oil prices. The higher interest and finance costs due to higher LIBOR rates, working capital blockage on account of GST and overall higher scale of operations also impacted.
- There was a transient impact on profitability due to mid-year volatility in base oil prices. Consolidated EBITDA margin was 6.1% versus 7.2% in FY18. However, your Company expects improved profitability in FY20.
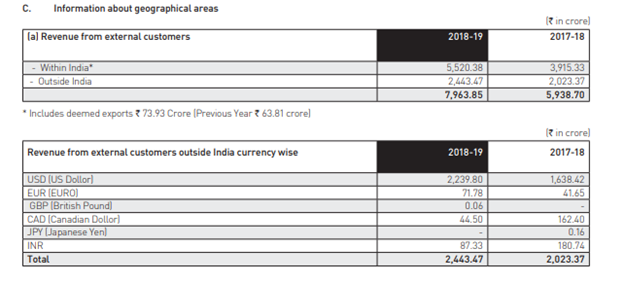
- Domestic and exports revenues grew 48% and 17% respectively
- Among the top global leaders in conductors
- 4th largest global transformer oils manufacturer
- Largest domestic cable manufacturer in the renewables sector, ~60% share in wind sector
- Leading domestic player in auto lubricants
- In its Vision 2020, revenue share targets for higher-value products are: • Conductors - 35% • Cables – 40%+ • Auto Lubes & Industrial Oils – 25%
- Additionally, ~70% capacity utilization is targeted in Hamriyah plant aiming higher exports. It expects to deliver increased profitability in FY20 with improved revenue mix and stable outlook for base oil 1. prices.
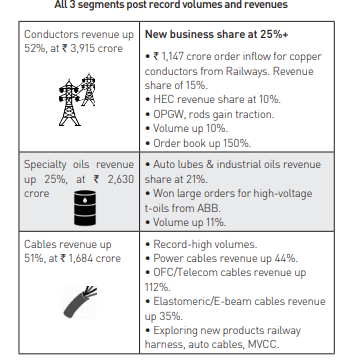
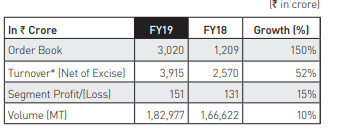
Conductors
- Strong growth led by new products
- In FY19, revenue from the segment grew 52% to reach ` 3,915 crore
- Copper conductors for Railways received orders worth ` 1,147 crore in FY19 contributing 21% to total order inflow
- Other new higher-value products like aluminium alloy rods gained traction
- The domestic market remained highly competitive for conventional conductors
- High-efficiency conductors (HEC) contributed 10% to revenues
- Exports share was at 40%, versus 47% in FY18.
- EBITDA grows strongly: EBITDA per MT post forex adjustment was
8,960, up 14% YoY with improved product/order-mix and increased manufacturing efficiencies even with certain cost challenges. Your Company is targeting an EBITDA of12,000 per MT in the next 2-3 years.
Vision 2020
- 35% of revenue share from higher-value products is targeted in FY20
- Order book up 2.5x: Conductors’ order book was
3,020 crore on March 2019. This includes571 crore of orders for copper conductors for Railways - Export markets contributed 46% to the order book.
Risks
- Increasing competition in the domestic market with fixed price contracts may put pressure on the profitability of the company
- Delays in orders from state discoms may impact performance. Delay in new CTC project launch may impact the performance
- The cyclical nature of the power business has an obvious impact on our performance
- Project delays from the customers’ side may impact even with robust order book
- Regional political instability and changes in the external environment in certain export markets may affect execution
- The volatility in aluminum premiums have been concerns, mainly with respect to exports, and is a challenge to manage in the absence of any hedging mechanism. Efforts by various aluminum manufacturers may result in implementation of safeguard duty which will increase raw material prices and have a negative impact on fixed price contracts in the short to medium term. Similarly, steel prices also do not have any hedging mechanism, and volatility in the same may impact performance. Furthermore, the gap in prices between Shanghai Metal Exchange and London Metal Exchange may cause volatility due to arbitrage activity that may impact performance.
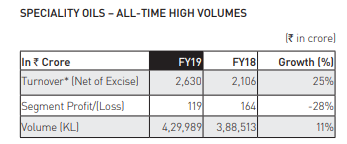
Specialty Oils
- Growth driven by automotive industry: In FY19, speciality oils grew 25% to reach ` 2,630 crore driven by automotive sector demand and record volumes across sub-segments
- ENI/auto volumes up 24%, driven by both OEM sales and B2C demand being sold via network of 450 distributors and 15,000 stockists across India
- Only Indian company to win new business to supply all major HVDC projects with transformer oils in FY18 and FY19. Order of 10,000+ KL won from ABB and GE
- Exports of transformer oils and white oils to over 95 countries. Successful manufacturing and distribution tie-ups in South Africa, Australia and Turkey
- Hamriyah plant operated at 62% utilization. Profitability transiently impacted: EBITDA per KL after forex adjustment in FY19 was at
2,998 versus4,399 in FY18. - The decline is due to external inflationary factors on account of rupee depreciation, volatility in prices of base oil, rise in costs of packing materials and additives.
VISION 2020
- Targets 70% utilization at the Hamriyah plant: The state-of-the-art specialty oils blending unit in Hamriyah (Sharjah) has 100,000KL capacity and targets key export markets.
- 25% revenue share targeted from auto and industrial oils. Steady demand expected from the automotive sector
- The domestic T&D equipment market is expected to continue to benefit from various regulatory initiatives leading to both new and replacement demand for transformer oils.
- Your Company expects revival in EBITDA levels with stable base oil outlook.
Risks and Concerns
- Your Company is exposed to volatility in the prices of raw materials and foreign exchange rates.
- Competition in both the transformer oils and auto lubricants sub-segments may impact performance. However, in order to mitigate risks, the company continues to exercise prudence in inventory control and hedging strategies.
- Also, additional global refining capacities have resulted in a mismatch in demand and supply, which has had an effect on base oil prices
- The prices of long-term buy contracts take time to correct in case of fluctuations in crude prices as formula prices are always backward looking. The Company had to implement strict credit controls to limit exposure to customers facing cashflow issues
- Rapid commoditization taking place at the lower end, especially at technical grade white oils, may have an impact on the margins
- Recent ‘Middle East’ geopolitical uncertainties like sanctions on Iran, Syria and further such events may impact global oil supply, causing volatility in base oil prices and may impact your Company’s performance.
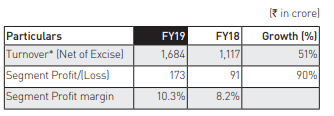
CABLES SEGMENT
- Continues high-growth trajectory: This segment delivered revenue growth of 51%, at ` 1,680 crore with diversification across sectors
- Power cables see increased demand from expansion and improvement in distribution networks. Strategic focus on Solar/ EPC further drives growth
- Higher execution with added capacity at both HT & LT XLPE segments
- Order book and execution increase for Railways and Defence sectors
- Steady demand from solar sector; activity pick-up in wind power
- Increased ordering for fibre optics cable from BBNL, BSNL and Reliance Jio
- Started getting approval for E-beam auto cables
- Execution started for Railway harness business
- EBITDA up 78%: EBITDA post forex adjustments increased to
190 crore in FY19 from107 crore in FY18 - EBITDA margin reached 11.3% versus 9.6% in FY18.
Vision 2020
40%+ higher-value products share
- Stronger order book backed by healthy contribution from elastomeric/e-beam, OFC/telecom, and power cables businesses
- Targeting new opportunities in auto, Railway harness, MVCC, signalling cables, etc
- Manufacturing initiatives: Increased capacity of LT cable (FY19) and OFC cables (on-going) in Khatalwad plant and debottlenecking of HT/LT capacity in Umbergaon (FY19) to benefit in FY20.
Risks and Concerns
- The excess capacity in the power cables segment impacts pricing
- Collection periods can get extended and delivery schedules can get delayed due to lack of financial arrangements by key customers in the renewable energy sector and by EPC contractors
- In optical fibre cables, the clientele is concentrated among a handful of telecom companies like BSNL and BBNL where capex spending has been severely impacted
- The cyclical nature of their tendering, too, has a bearing on the order situation in the industry
- Any volatility in fibre prices may impact performance.
Overall Market
Global
- Rising electricity demand, capacity additions, and replacement of ageing assets are key drivers of the global transmission and distribution equipment market. It is expected to reach ~$312 billion by 2024, growing at 6.41% 2017-2025 CAGR.
- According to Global Data, the global power transmission and power distribution conductors markets are expected to grow at 2018-2022 CAGR of 4.3% and 2.91% to reach ~$6.5 billion and ~$24 billion by 2022.
- The global transformer oils market is estimated to grow at 8.63% CAGR in 2018-2023 to reach $4 billion with Asia-Pacific, emerging as the fastest-growing market accounting for 40% share.
India
- Power demand is expected to grow at 6.5-6.8% CAGR in FY19-23 versus 3.8% CAGR in FY14-18, driven by high latent demand, rapid urbanization and increasing electricity access.
- Renewables to spur demand: Government has declared the trajectory of bidding 60 GW capacity of solar energy and 20 GW capacity of wind energy by March 2020. Transmission line tenders to route renewable power into grid for 12 GW have been awarded since December, 2018, bids for 16 GW are expected by the end of June and 38 GW before March, 2020.
- Railway Electrification a key driver: India has set a target of 100% railway electrification by 2022 at an outlay of ~
35,000 crore. Central Organization for Railway Electrification electrified 3,639 rkms in FY19, up 15%. Indian railways published 21 high-value tenders (Rs 100 cr+) for electrical works, totaling Rs 4,648 crore in FY19, compared to 12 such tenders totaling1,689 crore in FY18. There are plans to electrify 7,000 rkms in FY20 and 10,500 rkms each in FY21 and FY22. ICRA estimates spend of ` 12 lakh crore for dedicated freight corridors and railway electrification in next five years. India’s expanding metro rail network is also generating demand. On October 2018, 515 km of metro line was operational and over 664 km of metro rail projects in 15 cities was under various stages of implementation.
Your Company expects strong demand to continue for OFC cables with execution of BharatNet projects that target rural broadband connectivity. In summary, FY19 has seen strong demand for your Company’s products, and we expect the momentum to continue in FY20.
Railway electrification program and Metro rail implementation in major cities were additional demand drivers. Domestic automobile sales have grown at 7.4% FY14-FY19 CAGR fueling demand for auto lubes.
As per the 13th Five Year Plan, addition of 52,849 ckms of AC transmission lines is expected in FY20-22. All meters in India are targeted to be ‘smart pre-paid’ by FY22. The government is considering UDAY 2.0 to plug discom losses. Interim Budget FY20 has 8.5% higher allocation to the distribution sector. In renewables, the government is considering $5 billion of transmission line tenders to route power from renewable sources into the grid by 2022. In Railway electrification 28,000 rkms is expected to be electrified in FY20-22. India’s power sector is forecast to attract investments worth `9-9.5 trillion between FY19-23.
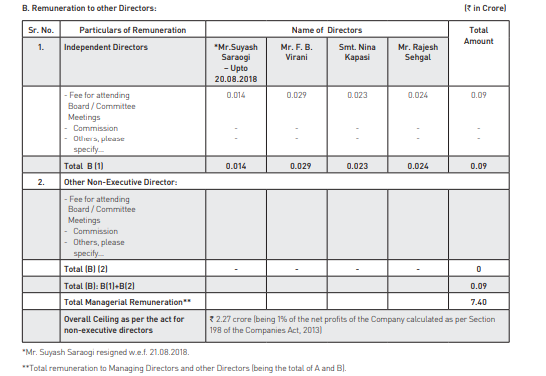
Management Remuneration
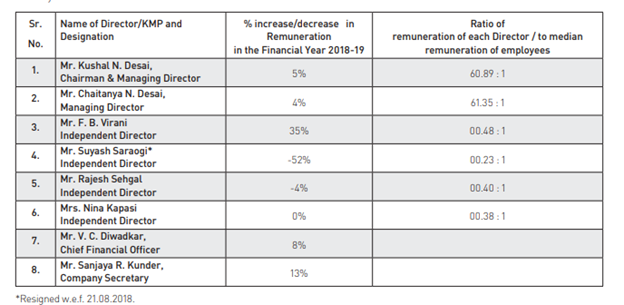
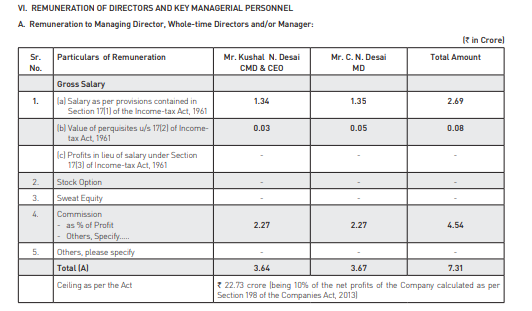
The percentage increase in the median remuneration of employees for the financial year was around 9.00%. 3. There were 1,506 permanent employees on the rolls of Company as on March 31, 2019. 4. Average percentage increase made in the salaries of employees other than the managerial personnel in the last financial year i.e. 2018- 19 was 17.51% whereas the percentage increase in the managerial remuneration for the same financial year was 13.30%
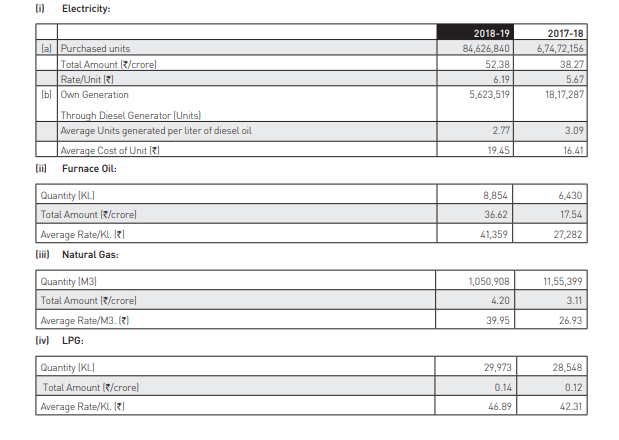
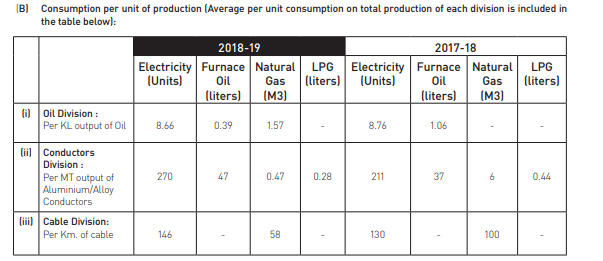
Energy Consumption
R&D Details
Expenditure on R&D: a) Capital = 3.18 crore b) Revenue = 6.99 crore c) Total = ` 10.17 crore d) Total R&D Expenditure as a percentage of total turnover (Net of Excise) = 0.14%
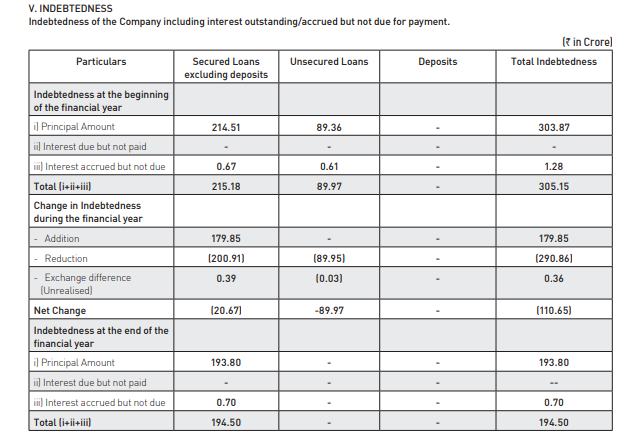
Debt Position
Distribution of Shareholding
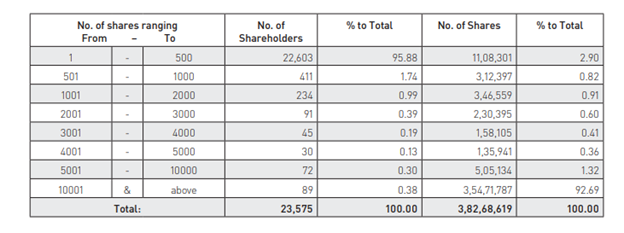
Only 550 shareholders hold shares worth > 5 Lakh Rupee
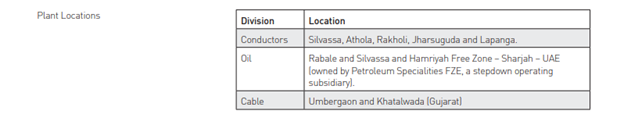
Plant Locations
Financial Analysis
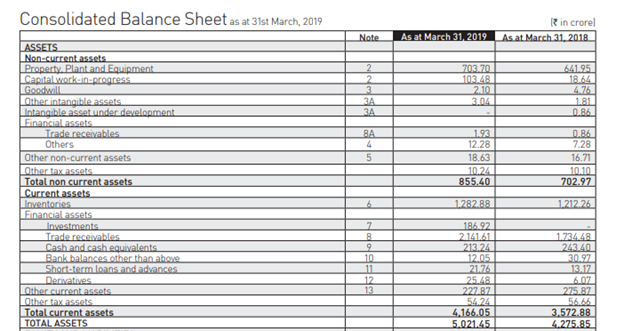
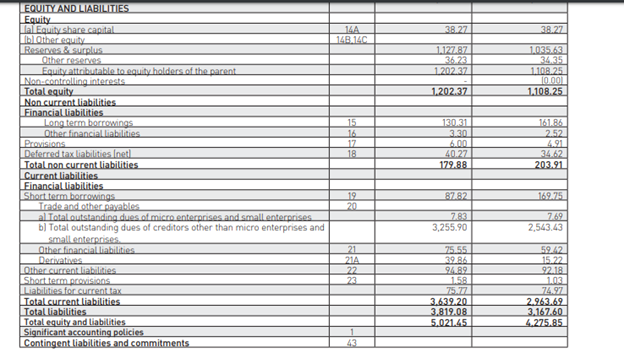
Balance Sheet
- Asset expansion 160 Cr including CWIP on 641 Cr asset
- Inventories are constant even ion higher revenue base
- Holds approximately 230 Cr of cash
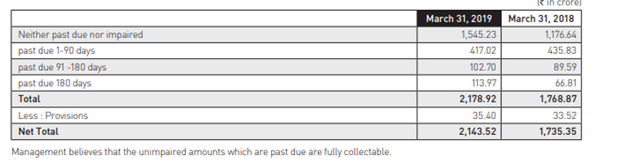
- Almost 1/3rd receivables with growth at par with revenue growth. However, growth in receivables more than 180 days has significantly jumped and not adequately provisioned. Are these going to be write-offs?
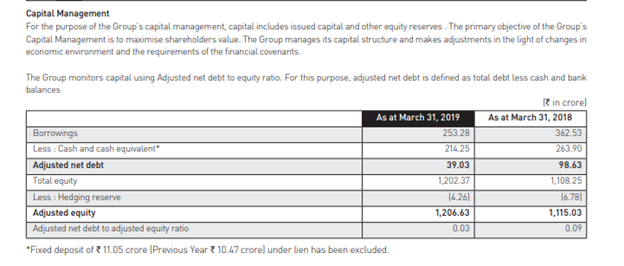
- Significant reduction in both long term and short-term borrowings. Loans down from 330 Cr to 220 Cr. Then, why the interest cost did not go down proportionally, rather, it is up, why?
Borrowing Details
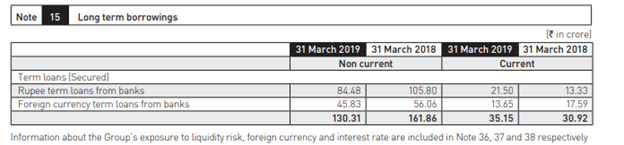
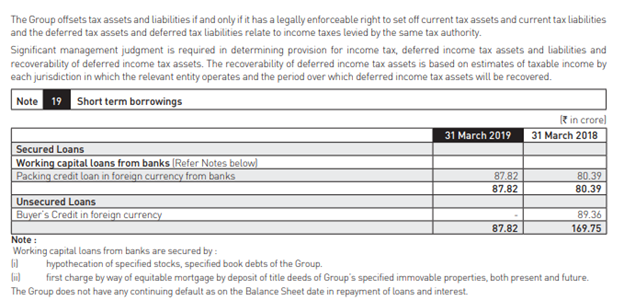
Loan Details: Details of security: a Rupee term loans and foreign currency loan from banks are secured as under: i The Foreign Currency term loan from Union Bank of India, Hong Kong , is secured by first charge by way of equitable mortgage by deposit of title deeds of Group’s Athola properties and exclusive hypothecation charge on the assets acquired by the Group with the proceeds of the facility situated at other locations. ii The rupees term loan from ING Vysya Bank Ltd (now Kotak Mahindra Bank) is secured by first charge by way of mortgage of Group’s Khatalwad properties and hypothecation of movable plant and machinery at Khatalwad. iii The foreign currency term loan from Arab Banking Corporation (ABC) Bank, kingdom of Bahrain is secured by : a) Mortgage over specified assets situated at Plot No. 1C-02D1, Hamriyah Free Zone,Sharjah - UAE. b) Joint and several guarantees of Petroleum specialities PTE Ltd - Singapore and Apar Industries Limited - India. iv The rupees term loan from Kotak Mahindra Bank is secured by first charge by way of equitable mortgage by deposit of title deed of Group’s Jharsuguda properties, (including hypothecation of Plant & Machinery and Mortgage of Land & Building), extension of charge on Khatalwad property (Movable & Immovable Fixed Assets) and hypothecation of identifiable movable fixed assets at other locations. [Hypothecation of identifiable movable fixed assets at other locations to be made available if the asset cover by mortgages at Khatalwad & Jharsuguda properties is less than 1.25X of outstanding terms loans (including the term loan from ING Vysya Bank Ltd.)] b Terms of repayment of term loan : i In respect of Rupee Term Loan from ING Vysya Bank Ltd (now Kotak Mahindra Bank) repayment in 7 quarterly installments till September, 2019, 6 installments of 3.33 crore each and last installment of 3.34 crore ii In respect of Foreign Currency Term Loans from Union Bank of India, Hongkong; last installment was paid in May, 2018 14.88 crore. iii In respect of foreign currency term loan from ABC Bank, Kingdom of Bahrain; it has a moratorium period of 12 months and the loan will be repaid in 14 quarterly installments; the repayment of which has started from 29 March 2019 onwards, first 2 installments of 2.76 crore each, next 4 installments of 3.63 crore each, next 4 installments of 4.49 crore each, next 3 installments of 6.05 crore each and last installment of 6.08 crore. iv In respect of Rupee Term Loan from Kotak Bank, it has a moratorium period of 18 months and loan will be repaid in 10 half yearly installments. The repayment will start from 08 September 2019 onwards, first 2 installments of 7.50 crore each, next 2 installment of 8.50 crore each, subsequent next 2 installment of 10.00 crore each and last 4 installments of 12.00 crore each The Group does not have any continuing default as on the Balance Sheet date in repayment of loans and interest. c. Net Debt Reconciliation (Disclosure in pursuant to para 44A of IND AS 7)
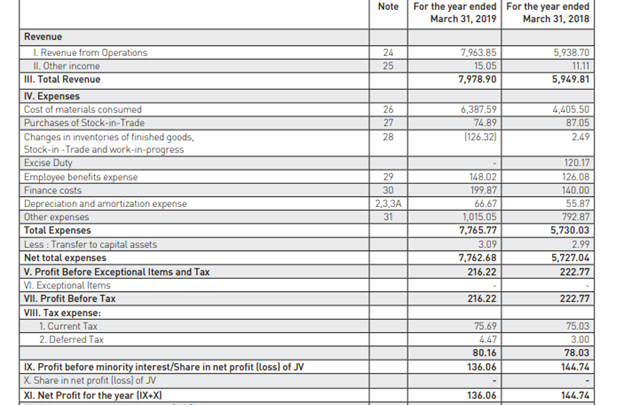
P&L
Significant jump in raw material cost impacting margins due to which profitability could not improve despite of high revenue growth
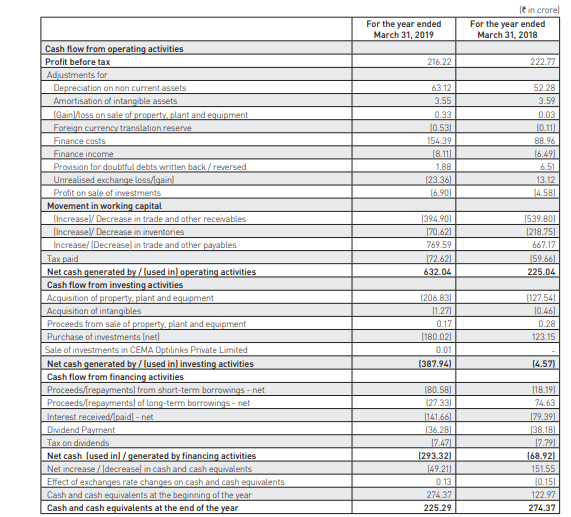
Cashflows
Looks significant improvement in working capital management
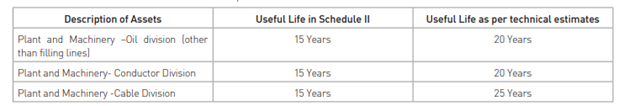
Depreciation Details
Check if such long period depreciation is allowed
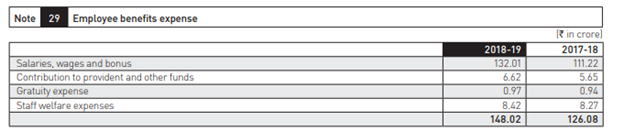
• Why only 5% of salary goes in provident fund?
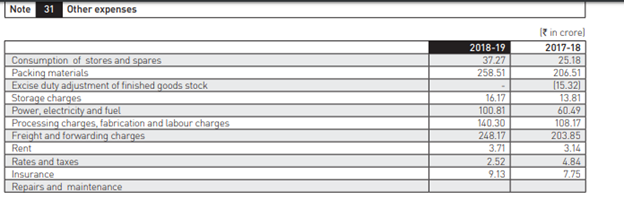
• Significant jump in power, packaging and freight forward charges. What is the outlook?
• There is a significant rise in receivables past due 180 days and adequate provisions are not made. Are these going to be write-offs?
• If adjusted net debt is so low, why company paying so much of interest cost? Why cant is use cash to pay loan?
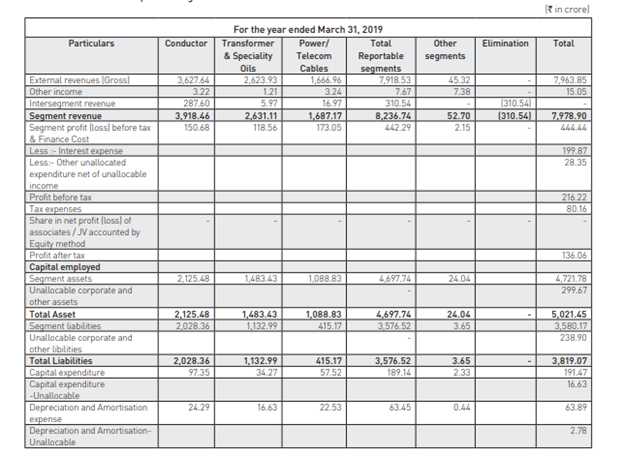
Segment wise details:
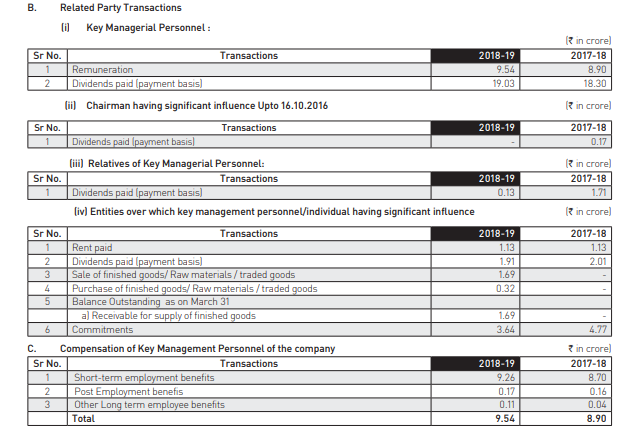
Related Party Transactions
Looks ok
Disc: Took a position recently and still accumulating
12 Likes
Prabhudas Lilladher Report on Q1FY20 Performance
Apar Industries reported strong set of numbers for 1QFY20 with revenue/PAT up 33% / 42% YoY to Rs20bn / Rs412 mn,
The top-line growth was led by growth across segments that is Conductors / Transformers Specialty Oils / Power Telecom Cables which grew by 61% / 8% / 24% YoY respectively.
What are your views on Apar Industries right now and in future.
1 Like
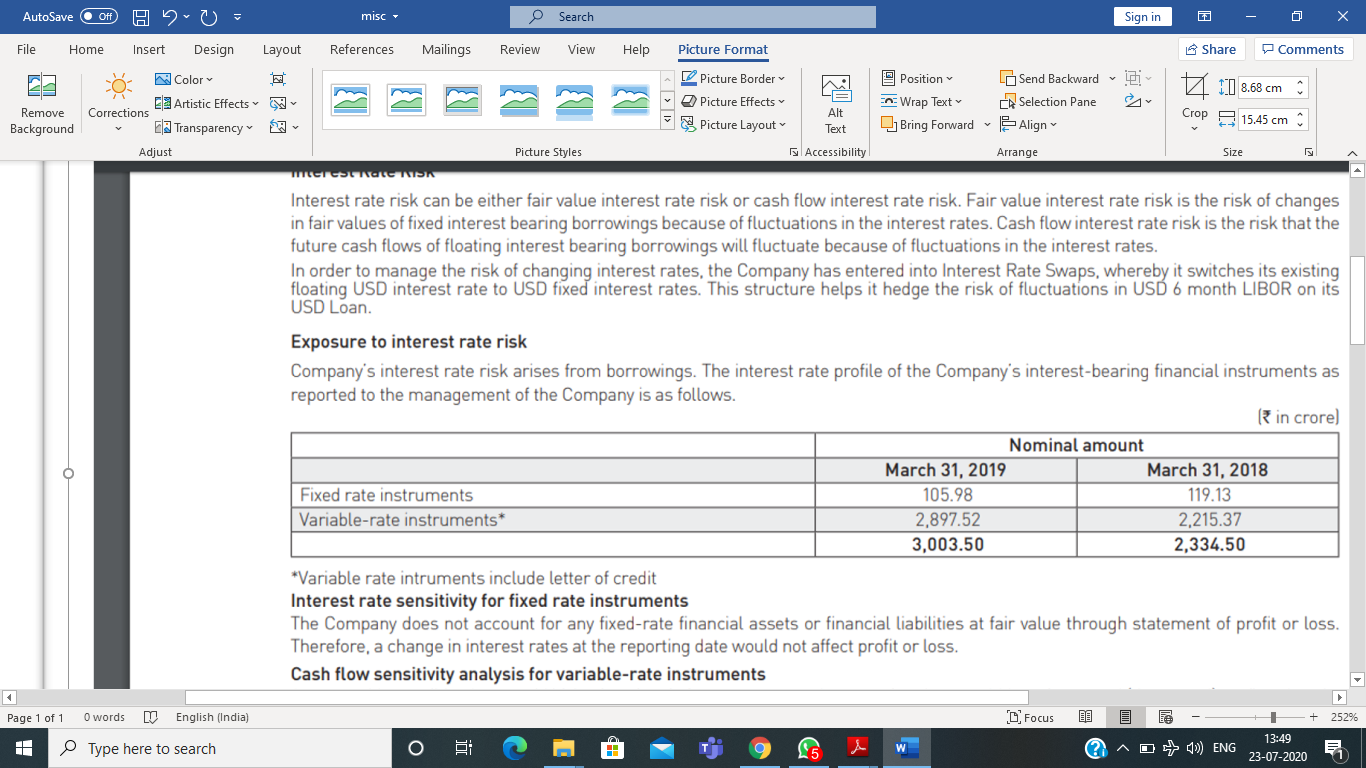
As per screener.in company paid interest of Rs. 227 Cr. whereas total borrowing was 241 Cr. only… Why so high Interest I am unable to understand
Although the Company is having balance sheet debt of only Rs 241 Cr but off balance sheet item like Letter of Credit may be the reason for high financial cost as evident from Page 123 of Annual report 2018-19.
(Variable rate instrument Rs 2897 Cr)
3 Likes
Hello Saurabh,
In case you are still tracking apar Ind, would love to know your thoughts on latest quarterly result.
Thanks
From Q3 21 result concall transcript, Letter of credit outstanding in books as per management is as follows -
Pratiksha Daftari: And if you could just give me the total outstanding LC amount?
V.C. Diwadkar: It is 1179 crore, out of that 827 is LIBOR based and 352 is domestic
Conference Call Highlights
Management indicated government thrust on infrastructure and initiative’s such as privatization of discoms, bringing down ATC losses to 12-15% by 2025 and 100% railway electrification will give boost in ordering activity.
Revenues for domestic markets grew by 12% YoY, led by 42.5% growth in Oil segment, while exports declined by 2.8% YoY.
During 4Q, margin got impacted primarily in the conductor segment owing to steep increase in raw material and freight cost and is expected to continue till H1FY21 as OB comprise of legacy orders which are of mostly fixed cost in nature.
In conductor business management will be focusing in premium product like HTLS, OPWG and HTLS service. While in conventional conductor segment it will focus on margin driven growth rather than volume and targets EBITDA/ton of Rs12,000 going forward.
Management indicated they will be focusing on supply of electron beam cables to Automotive OEM and has started supplying it to HVM auto for is E-Bus.
Industrial oil segment is expected to report a strong growth with recovery being witnessed in industrial machinery side due to increased private capex. As on Mar’21, total acceptance stands at Rs16bn (of which Rs10.3bn Libor linked and Rs 5.7bn Domestic acceptance).
Management targets ROE to reach 20% by FY23.
Capex of ~Rs950mn is planned over next 12-18 months in cables business mainly towards wind and solar cable capacity. With completion of this capex and increase in utilisation level of current capacity Cables business is expected to reach revenue of Rs25-30bn in next 2-3 years.
Conductors: Revenue grew 1.7% YoY led by lower HEC revenue contribution (12.4% of sales during quarter compared to 17.0% last year) and decline in copper conductor revenue for railway (down 31.5% YoY). During the quarter executed 220 Circuit kms with GAP type conductor for PGCIL. EBITDA post adjustment to open period forex was down 97.5% YoY to Rs 10mn, due to sharp rise in raw material cost impacting fixed cost legacy orders, 3-4x increase in global freight cost due to shortage of containers and delay by customer for clearance and dispatch of goods due to travel restriction. OI declined 50.6% YoY due to second wave of Covid impacting export ordering activing, government spending and delay in ordering activity from EPC player due to steep rise in raw material price. OI in April 2021 was Rs5bn. OB declined 17.7% at Rs16.5bn (55% exports share).
Speciality Oil: Revenue grew 33.1%, (42.5%/18.4% growth in domestic/exports revenue), primarily driven by market share gain and increase in share of business from key major customer. Base lube oil witness supply chain constrain till Feb21. Adj. EBITDA/KL was highest at Rs10,019/Kl led by strong revenue growth in high margin Lubricant segment (up 67.5% YoY).
Cables: Revenue was flat for quarter, led by 7.1% YoY growth in domestic market, while exports reported decline of 17.9% YoY. Competition was intense with lower demand in B2B and B2G segment. Going ahead focus will be on exports markets.
Outlook: Management expects Cables business to perform well in FY22 compared to FY21 and Conductor business is expected to see traction from H2FY22 mainly from HTLS and OPWG conductors. In oil segment transformer oil volume is expected to grow 5-6% while Industrial and Automotive is expected to grow in double digit.
4 Likes
APAR
- Promotores and DII increasing stake
- Neg Cash conversion cycle : Invesotry being sold before u even pay for RM
- Major increase in trade payables as them being the debotors in this Qtr
- ROCE has started inreasing again. Lower commodiates will improve it further
- Int payable is reducing, though may increase with increase in RBI repo increase
- Highest Pat in 3 years so may be able to increase over next 4-6 Qtrs and that’s the play here
- Lowest PE in peers and 2nd highest ROCE
- Co’s been consistent dividend payer over the years which is good considering cyclical
- All Pullbacks till 800/850 to be good entry zone with high volumes build up
- Overbought on daily basis RSI so some pullback will come. Share was at this
price in 2017 and went to 250 so natural target is 1550.
5 Likes
Recent qtrs results have shown benefits of company’s strategy of:
- Focusing on margin accretive contracts for cables and wires business and refusing low margin contracts
- Focus on launching differentiated products in wires, cables and specialty oils
- Consumerization of the specialty oils and cables business
- Export push to the US
Apar can be a direct beneficiary of the electrification and ESG trend since their cables are used in windmills as well as car charging infrastructure.
4 Likes
Results out.
There has been consistent improvement in the margin profile of all 3 business segments. Bodes well for the rest of the year.
| Margin | 30.6.2022 | 31.3.2022 | 30.12.2021 |
|---|---|---|---|
| Conductors | 5.0% | 3.8% | 3.9% |
| Transformers & Specialty Oils | 10.5% | 7.0% | 7.0% |
| Power/Telecom Cable | 7.0% | 6.2% | 1.6% |
D: invested
4 Likes
Q1FY’23 Concall Highlights:
General Comments:
150 cr of capex in current fiscal
Higher profitability in FY’23 than previous year
Major exports to US, EU and Australia.
Export contribution can hit 50% of total sales.
New markets opening up for company since many countries adopting China + 1 policy
Aim to achieve 20% RoE. Presently at 17%
Oils:
5500/KL realization in the current fiscal
Resurgence in transformer oil demand
White Oil volume to get hit in Q2 due to higher price. Difficult to pass on
Lubricant demand might fall in long term due to electrification. Battery business acts as hedge
Battery business aims to get higher share of mechanic wallet
Conductors:
Conductors volume target of 130k to 140k tons
Conductors - EBITDA/tonne to be 17k to 17.5k
Interest cost to remain high but built into EBITDA
Cables & Wires:
Aiming for 30% growth in cable business
New e-beam machine go-live in Q3
Cable: target 2600+ cr @ 8.5% margin
Started exporting solar cables to EU
Anushakti launched in 7 states. 200 cr target for wires business
Product differentiation as follows:
Wires have 50% more current carrying capacity than those sold by Polycab and Havells
Insulation of the wire has higher short circuit resistance
8 Likes
2 Likes
Q3 Concall Notes
-
Exports at 49% vs 35% year ago
-
11% electricity consumption growth domestic in Q3
-
30% RDSS scheme allocation is cables and conductors (over 5 years)
-
Discom to power gen companies dues halved to Rs. 675 billion from 1210 billion
-
EBITDA/ton high due to premium products, exports, steel price + logistics
-
High EBITDA/ton next two quarters as well but changes are structural as well
-
Domestic realisations are low due to low standards set by EPC players. Exports quality and realisations are higher
-
Renewables cables will contribute to exports a lot from FY24
-
Exports growth and momentum will continue in FY24 as well
-
Once US Infra bill is passed, momentum will pick up
-
Export trend very positive over next 3-5 years
-
Underwriters lab approval - Apar has highest approvals in US
-
Solar and Wind in Europe, Underground metros in Australia are driving growth
-
Distribution spends will use cables and oils than conductors
-
Commodity prices (copper) are hedged on receiving order
-
US Infra - Cables for solar and wind farms, evacuation to grid (conductors), replacement of old T&D grid - Apar present in all 3
-
300 Cr capex over 15 mo - mostly in cables and conductors. Greenfield project. preempting healthy demand
-
China+1 is here to stay
-
Cables - See visibility 25-30% CAGR for next several years
-
1945 - 1970 infra in US will get replaced. So conductor demand will be huge
-
100 to 200 Cr sales in B2C. Next year expecting 350 Cr
-
RoE for 9 months at 21%. capex will maintain this RoE
-
FTA with EU can be a big plus - 3.8-4% advantage
-
Conductors - 15-20%, Cables - 25-30%, Oil - 5-7% growth for FY24
-
Cables - 4-6x, 8-10x in house wires. Conductors - 5-6x asset turns
-
Capacity utilisation - Almost 100% almost in cables and conductors
-
US / Europe aren’t cost competitive and don’t see big capex happening there
-
Premium products roughly 2x standard products and exports 1.5x standard
-
HEC (High efficiency conductors) market share is 45% (Sterling Power is competitor)
30 Likes
1.Growth of cable and wire at high rate.Its cables are not competing with Havells or Polycab ,it is high current capacity carrying ,Although its into B2B, polycab and Havells are into B2C hence command higher margin
2.If revenue from Cables outpaces Transformer oil business,stock might rerate further
Disc -Invested from 1200 levels.
2 Likes
Apar Industries is operational in the industrial sector, with a focus on the production of conductors, transformer oils, and other industrial products. The company is serving a range of industries including power, automotive, and telecom, among others.
One tailwind for Apar Industries is the growing demand for electricity and power infrastructure in India, which is driving demand for conductors and transformer oils. Additionally, the Indian government’s focus on improving the country’s infrastructure and manufacturing capabilities could also provide tailwinds for Apar Industries.
Furthermore, the company’s focus on sustainability and environmental responsibility could position it well for future growth, as demand for environmentally friendly products and solutions continues to increase.
However, it’s important to note that the company’s performance is also impacted by external factors such as global economic conditions, regulatory changes, and competition, which can have an impact on its growth prospects.
Disc - Only tracking at the moment
3 Likes