Yeah, good point. Thanks for sharing.
When I filter by “Norms”, JCB seems to have more than 50% of sold vehicles in CEV 5 Norms. ACE has very less percentage as of now.
I guess something to check further especially when targeting Europe
Yeah, good point. Thanks for sharing.
When I filter by “Norms”, JCB seems to have more than 50% of sold vehicles in CEV 5 Norms. ACE has very less percentage as of now.
I guess something to check further especially when targeting Europe
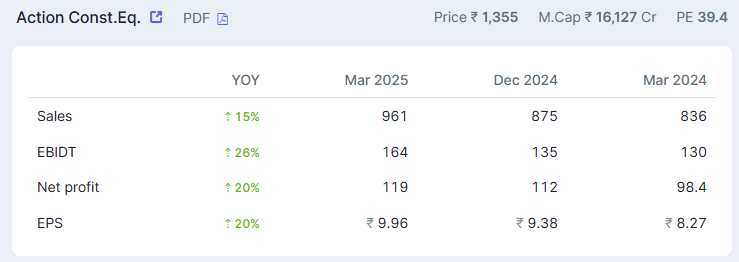
Good results - 26% EBITDA growth, PAT growth was slightly lower at 20% due to lower other income - this might be due to lower or no MTM gain this quarter on investment, which might be there last year. Need to see what mgmt has to say on this on conference call.
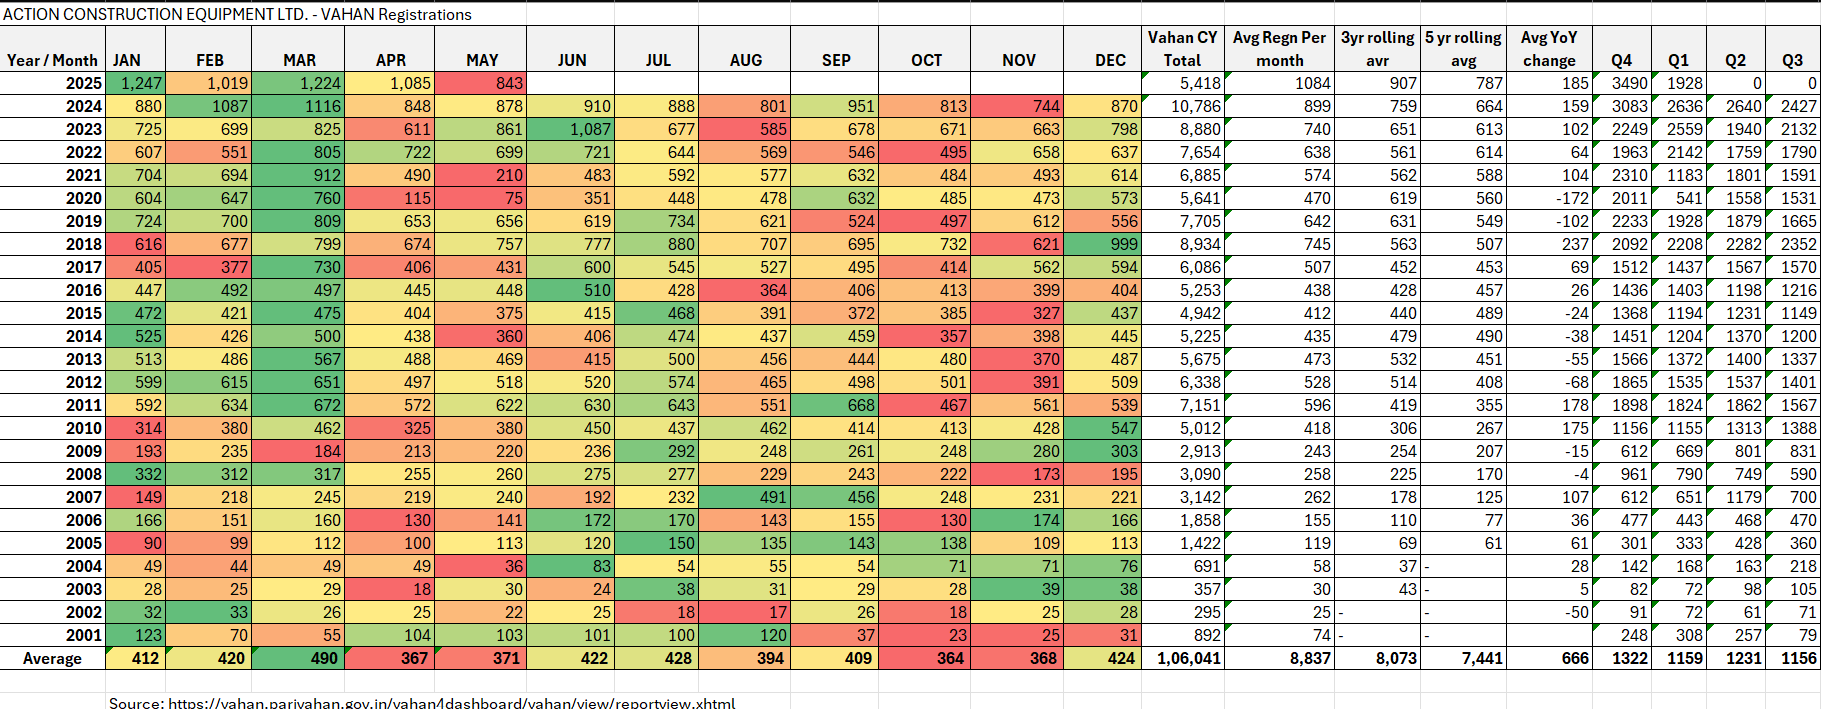
May month update:
Just read the concall from ACE. They are reducing their topline guidance to 14-15%. Is it a temporary phenomena or is it the new normal growth rates for ACE?
They said they will revisit guidance by the end of Q2. It’s a 15-20% growth machine at 36 PE.
Nice share @ramansharma ..
I am wondering do we have any other listed backhoe/loader company which can compete with JCB?
Any idea on that? Sanghvi Movers, BEML??
I see something on Tata Hitachi but it’s not listed I beleive
@ashwind - if you also have some idea , kindly enlighten
JCB is a leading industry player, holding approximately 80% of the market share, with the remaining 20% distributed among 6~7 other manufacturers, including CASE, Caterpillar, Escorts, ACE, Bull Machines, Tata Hitachi and Bobcat.
The overall construction equipment market in India is estimated to be between 85,000 and 90,000 units annually. Of this, backhoes and excavators constitute approximately 57% of the market. JCB’s backhoe segment accounts for over 50% of the total construction equipment market share.
JCB has traditionally been the incumbent in this sector and is expected to maintain its dominant position. Additionally, Tata Hitachi manufactures backhoes, although their volumes are relatively negligible. Tata Hitachi holds a market share of around 25% in the excavator segment, making them the market leader in that category.
So if I were to look at one more market leader from construction vehicle space it would be Tata Hitachi in excavators…which is a JV of Tata Motors and Hitachi…
With a possibility of
In any case buying Tata Motors can be one option if we are looking for a market leader in this space… Is it?
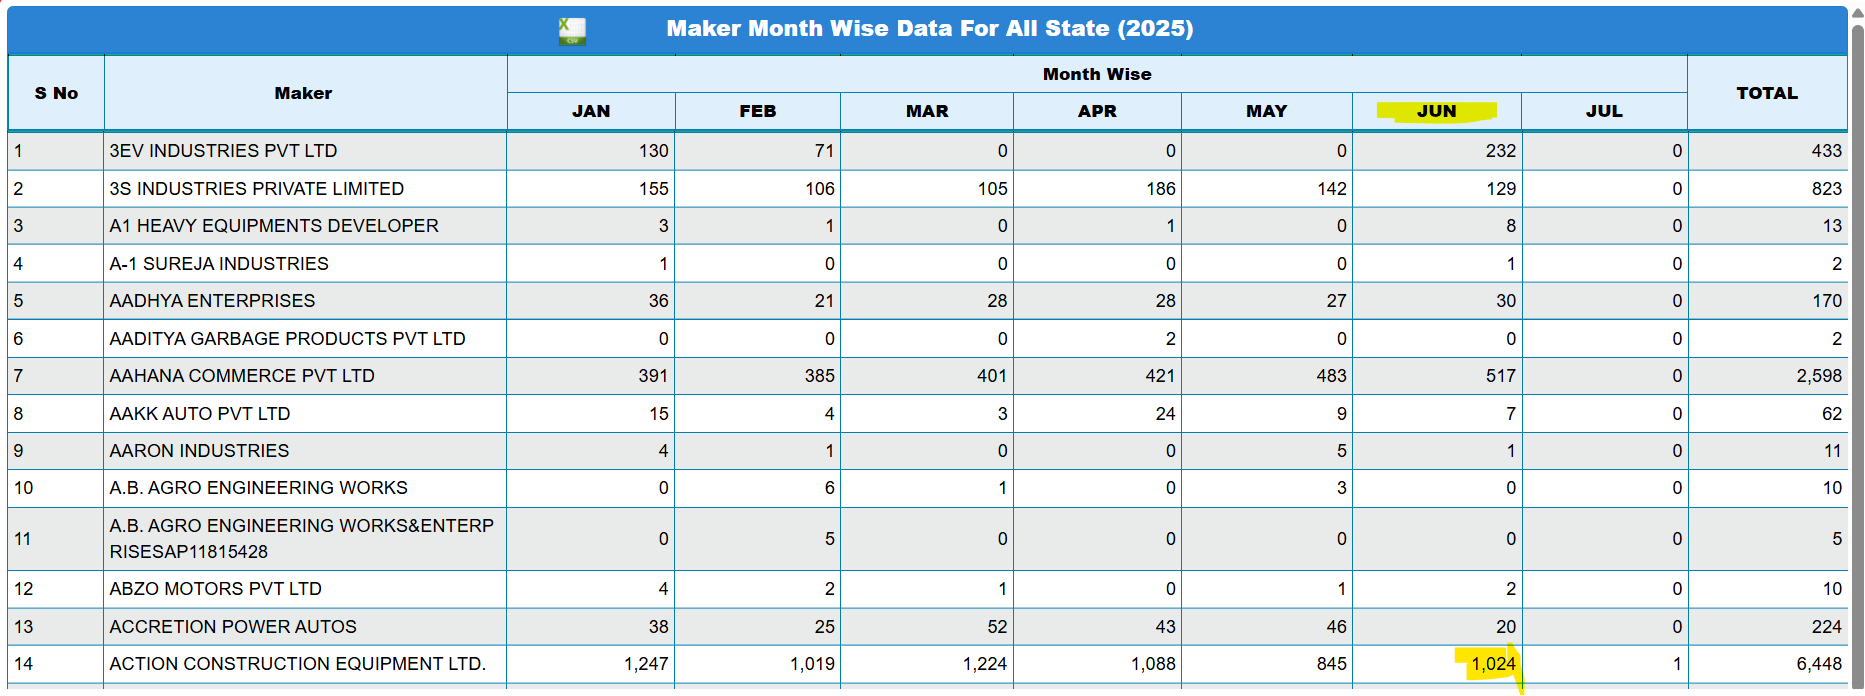
Per Vahan data - June-25 - 1024 Units
MoM - 12.5% increase in unit sales
LY June-CY June - 21% increase in unit sales.
Seem to be doing better than expected considering monsoon season when constructions activities go low and slow.
@Tushar95 Not sure why your count is different. This is where I get it from.
I have prepared a report on action construction equipment limited, the beginning of the report consist of some quantitative data from last years and remaining is the qualitative data.
The report is divided into following parts:
A. Tables
B. Key Observations
C. Reason for growth in last 4 years
D. What is the TAM of the Industry
E. What can be expect in the future?
F. Conclusion
G. Disclaimer:
A. Tables
Table 1 - Revenue from Operation
| Segment | 2021-22 | 2022-23 | 2023-24 | 2024-25 |
|---|---|---|---|---|
| Cranes | 1,102 | 1,563 | 2,153 | N/A |
| Construction Equipment | 181 | 242 | 389 | N/A |
| Material Handling | 165 | 176 | 209 | N/A |
| Agriculture | 197 | 220 | 239 | 230 |
| Revenue from operations / Total units sold | 1,630 | 2,160 | 2,914 | 3,327 |
Table -2 Number of Units Sold
| Segment | 2021-22 | 2022-23 | 2023-24 | 2024-25 |
| Cranes | 5,328 | 6,584 | 8,970 | N/A |
| Construction Equipment | 533 | 738 | 1,156 | N/A |
| Material Handling | 1,418 | 1,321 | 1,517 | N/A |
| Agriculture | 4,085 | 3,667 | 2,946 | 2,794 |
| Revenue from operations / Total units sold | 11,364 | 12,310 | 14,589 | 16,154 |
Table 3 - Segmental bifurcation of Revenue (in %)
| Segment | 2021-22 | 2022-23 | 2023-24 | 2024-25 |
|---|---|---|---|---|
| Cranes | 68% | 72% | 74% | N/A |
| Construction Equipment | 11% | 11% | 13% | N/A |
| Material Handling | 10% | 8% | 7% | N/A |
| Agriculture | 12% | 10% | 8% | 7% |
| Total | 100% | 100% | 100% | 100% |
Table 4 - Segmental Bifurcation of Volume (in %)
| Segment | 2021-22 | 2022-23 | 2023-24 | 2024-25 |
|---|---|---|---|---|
| Cranes | 47% | 53% | 61% | N/A |
| Construction Equipment | 5% | 6% | 8% | N/A |
| Material Handling | 12% | 11% | 10% | N/A |
| Agriculture | 36% | 30% | 20% | 17% |
| Total | 100% | 100% | 100% | 100% |
Table 5 - ASP
| Segment | 2021-22 | 2022-23 | 2023-24 | 2024-25 |
|---|---|---|---|---|
| Cranes | 2,068,131 | 2,373,329 | 2,400,669 | N/A |
| Construction Equipment | 3,393,996 | 3,280,488 | 3,363,322 | N/A |
| Material Handling | 1,160,085 | 1,333,081 | 1,380,356 | N/A |
| Agriculture | 483,231 | 600,218 | 812,288 | 823,193 |
Table 6 - % Increase in Revenue
| Segment | 2022-23 | 2023-24 | 2024-25 |
|---|---|---|---|
| Cranes | 42% | 38% | NA |
| Construction Equipment | 34% | 61% | NA |
| Material Handling | 7% | 19% | NA |
| Agriculture | 11% | 9% | -4% |
| Revenue from operations | 33% | 35% | 14% |
Table 7 - % Increase in Volume
| Segment | 2022-23 | 2023-24 | 2024-25 |
|---|---|---|---|
| Cranes | 24% | 36% | NA |
| Construction Equipment | 38% | 57% | NA |
| Material Handling | -7% | 15% | NA |
| Agriculture | -10% | -20% | -5% |
| Total units sold | 8% | 19% | 11% |
Table 8 – Company’s Product range (Includes Crane and Construction Equipment’s only)
| Business Vertical | Product Line |
|---|---|
| Cranes | Pick-and-carry cranes |
| Cranes | 360° multi-activity crane |
| Cranes | Tower cranes |
| Cranes | Truck-mounted telescopic cranes |
| Cranes | Crawler cranes |
| Cranes | Lorry loaders & knuckle-boom cranes |
| Cranes | Tele-handlers / tele-boom cranes |
| Construction equipment | backhoe loader |
| Construction equipment | Eco-Master |
| Construction equipment | motor grader |
| Construction equipment | Soil compactor |
| Construction equipment | Tandem roller |
| Construction equipment | Wheel loader |
| Construction equipment | Skid-steer / mini loader |
Notes:
Figures mentioned in table 1 and table 2 are taken from the Annual Report and PPT uploaded by the company on the exchange. Further Table 3 to table 7 are derived from table 1 and table 2.
B. Key observations:
Three-quarter of the revenue growth came from the crane segment in the last 4 financial years.
According to company PPT, company has held company more than 63% market share in Mobile and Tower cranes in India for the past three financial years. Hence, the segment in which it was already the leader provided the main impetus for growth.
Further margin expansion seems limited, as operating leverage has been fully exploited. The reason for the same is that the company is setting up new capacities and the combined capacity utilization is 70% for (Crane+CE+MHE) as stated in the latest Concall of quarter ending March’2025.
Although exports number though not mentioned above stay between 5-10% for the last 4 years and management expects them to remain that way in the near future.
Material Handling and Agri equipment have either declined or remained range bound over the last four financial years and therefore have not contributed to the company’s growth.
The construction equipment segment has grown impressively, yet its revenue is still just 13% of revenue for the financial year 2023-24. The growth of this segment has outpaced the overall company growth. (Segment number of 2024-25 separately not disclosed by the company).
C. Reason for growth in last 4 years
| Financial Year | Capex allocation (₹ lakh crore) | YoY change |
|---|---|---|
| 2020-21 (Actual/Revised) | 4.39 | — |
| 2021-22 (BE/RE) | 5.54 | 26% |
| 2022-23 (BE) | 7.5 | 35% |
| 2023-24 (BE) | 10 | 33% |
| 2024-25 (BE, full budget) | 11.11 | 11% |
• Above mentioned numbers are taken from PIB.gov.in.
Not just Infrastructure but realty sector saw a great jump, boosting demand.
Not just Action construction equipment revenue but also JCB India saw significant increase in revenue (it is the no.1 player in the construction equipment segment in India). Following are the revenue figures of JCB India:
| FY | Revenue | YoY growth |
|---|---|---|
| 2020-21 | 11,751 | – |
| 2021-22 | 11,904 | 1.30% |
| 2022-23 | 15,299 | 28.50% |
| 2023-24 | 18,825 | 23.00% |
D. What is the TAM of the Industry
I will explore crane and construction equipment segment only because that is where the company has shown signs of growth and Interest.
Crane Segment
Company’s 2023-24 Annual report states:
“In 2024, the Indian crane market is estimated to be valued at USD 1.39 billion (Rs.11,537 Cr), with expectations to soar to USD 1.92 billion (Rs.15,936 Cr) by 2029, exhibiting a robust CAGR of 6.79% during the forecast period (2024-2029).”
Construction Equipment Segment
As per the news article posted by construction times dated 24th June’2024 the following was noted. Please note the article was authored by Assistant Vice President and Sector Head, Corporate Ratings, ICRA Limited.
“The Indian construction equipment (CE) industry reached yet another milestone in FY2024 with annual sales of 1.36 lakh units, touching an annual revenue of ~$8.5 billion (estimated)”
“The CE industry could touch ~2.5-2.6 lakh units in annual sales by 2030, which would mean an estimated CAGR of 13-14% (FY2024 to FY2030).”
https://constructiontimes.co.in/ce-industry-riding-high-on-indias-infrastructure-story?utm_
E. What can be expect in the future?
I will be sharing my point of view basis my understanding of the business, the industry and its cycle, its past performance, its future potential and its JV’s. I will be considering crane and construction - equipment segments only and not the other two segments.
The massive growth in revenue and profit seen in the company in the last five years was nothing but a multibagger in action- i.e., revenue growth + margin expansion + a modest starting P/E. Five-year sales growth at a 24% CAGR and profit growth at 51% CAGR.
Currently the stock trade at optimum margins, so further margin expansion seems hard. Also, the P/E the share command today is 34.6, it is not cheap by any means. If the P/E remains the same (i.e. perception/earning as I see it), the only vector that remains for the stock price to increase is an increase in revenue and in turn the profits.
What are the vectors of revenue growth:
Increase in industry size – It seems unlikely that the government will be able to increase the infrastructure budget at the pace it has in the past, growth will moderate if not flatten. Also, the real estate industry is catching some breathing after a significant jump in the last few years. Private capex is something which has been muted for quite sometime and can show recovery.
Taking market share from others – First, talking about cranes, in mobile and pick and carry cranes they already have more than 63% market share. (Mobile and pick and carry cranes form the largest part of the total crane industry). There is a room to gain market share from other players but they are already are very dominant and market share gain happen little by little over time. Further, we will discuss about the market share gain in the JV segment.
In the Construction Equipment segment, the company currently holds less than 1% market share in a space largely dominated by JCB. While this indicates significant headroom for expansion, the segment contributed only 13% to the company’s total revenue as of March 31, 2024
Increase in exports – the Company’s exports have been in the range of 5% - 10% of total sales. The company maintains that it will remain so in the future as well. If the company accelerate its exports, that could provide additional thrust to revenue growth.
Defense – The defense segment of the company has been in the range of 5 % of total sales. The company maintains that it will remain so in the future as well. If the company accelerate its exports, that could provide additional thrust to revenue growth.
Joint Venture – The company has entered into a JV with Kato, Japan for crane manufacturing. Following are some excerpts from the latest concall. Here there can be an opportunity to gain market share by entering into higher ton products.
“The opportunity size total is close to about INR1,000 crores – INR800 crores, INR1,000 crores. And the immediate opportunity will be INR300 crores to INR400 crores on an annual basis”
“I think for this year, the revenue should be to the tune of INR100 crores plus/minus.”
“With respect to wind, the waves and the heights at which the generators and the members have to be, sections have to be installed are much higher and heavier also. So, there you require bigger cranes. Cranes even going up to 200 tons to 300 tons, 400 tons which is not in our range with respect to truck crane especially or alternate cranes. Action Construction Equipment Limited May 27, 2025 So that is the reason we are not operating there, because they are using bigger alternate cranes. Generally, and our crawler cranes, which are above 250 tons of 300 tons for such projects, which we don’t have in India. Eventually, we will start to do through the joint venture.”
F. Conclusion:
In my view, the company is positioned to grow broadly in line with the industry, with additional support from potential market share gains in the large-crane and construction equipment segments. However, as the large-crane segment may take time to scale and construction equipment currently accounts for only 13% of the total revenue mix, even outsized growth in the CE segment may not significantly move the needle in the near term. That said, a 13–15% annual revenue CAGR appears to be a reasonable expectation over the short to medium term, assuming no major systemic risks.
G. Disclaimer:
This is my personal opinion and may be incorrect. Please conduct your own research before making any investment decisions. I do not hold any position in this stock. This analysis is intended solely for study purposes.
Over a period of time Company may take market share from JCB if it maintains quality at par with JCB and price below JCB.
Disclosure: Invested from 2021