There is no right answer to this question. I personally do two things.
- I buy between 3-5 tranches in the first go.
- I keep averaging up (when price goes up). I do not usually average down.
There is no right answer to this question. I personally do two things.
Hi @basumallick
Thanks for sharing your valuable experience with all of us.
- I keep averaging up (when price goes up). I do not usually average down.
I like this idea. rather than average down, we should average up when the price is going up.
In hindsight we feel March/April 2020 was an excellent opportunity to buy quality stocks, however I was not able to take a buy call(Fear of loss) when I see my portfolio was already lost -45% of its value and was not ready to loose further how much ever is the opportunity (sleep > returns). Now almost all those losses are recovered and we feel regret that we missed a great opportunity
How we overcome this and how to act in those situations where your portfolio is in deep-red but you see a great value in stock and don’t know how much further it will go down(For example. March 2020).
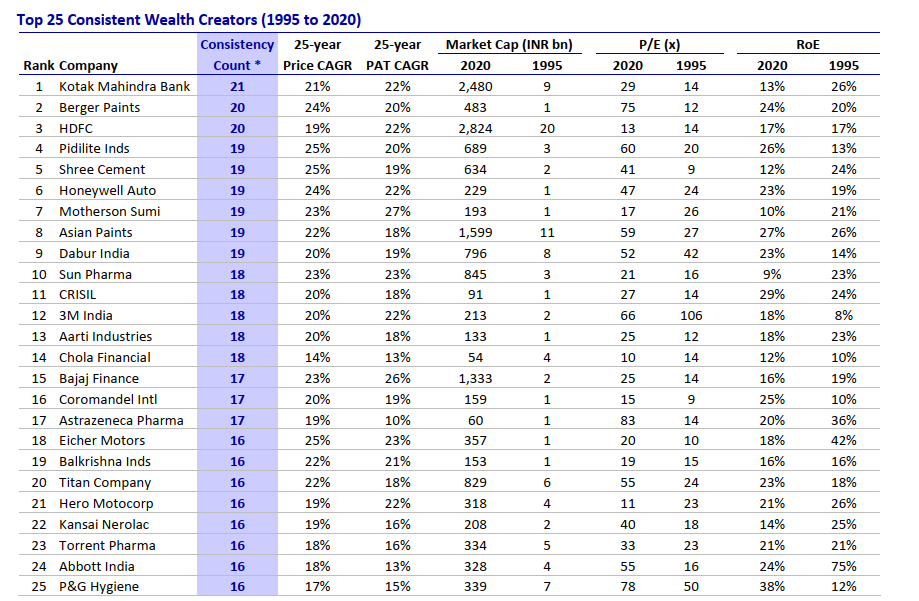
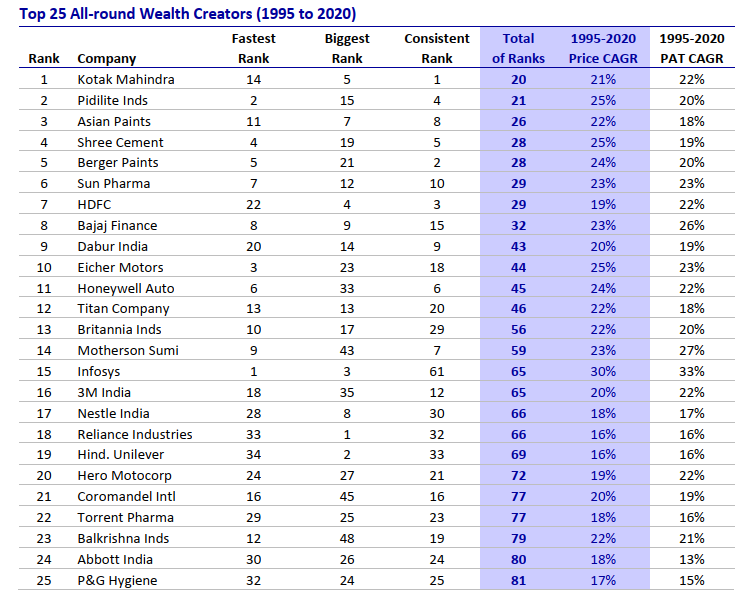
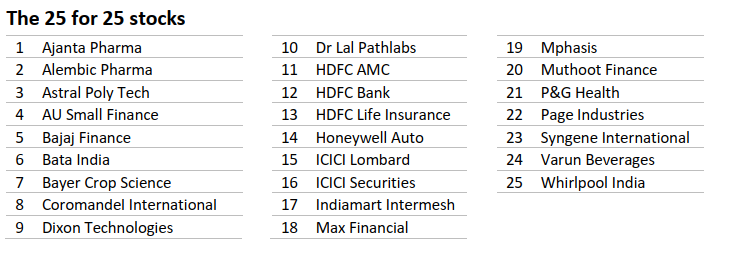
There are two annual publications hat I eagerly await - Buffett’s annual letter and Raamdeo Agarwal’s (Motilal Oswal) Wealth Creation Study (MOSWCS). And to be fair, their quality has been going in divergent directions in the last few years. Buffett’s letters have become increasingly boring and repetitive and the MOSWCS have come more and more elaborate and engaging.
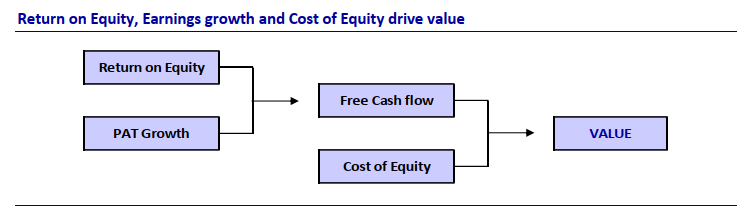
This year’s study is a treat. Not only has the time horizon been increased from 5 years to 25 years for the base study but the focus on creating a detailed QGLP checklist is a great help to the investment community. As I have said many times, QGLP is an primary investment framework that I use very often and think is one of the best and since I am also a checklist driven investor, it would help me personally immensely. I also have 3 separate checklists and I would try to integrate all of them into 1 sometime.
Q#1 What is the history of the company and management?
Q#2 Is the company’s business model understandable? How does it make money?
Q#3 Is the company profitable? If not, is it expected to emerge?
Q#4 Are the company’s terms of trade favorable? Is Cash flow healthy?
Q#5 What is the company’s cost and margin structure? How has it changed in the past?
Q#6 How’s the Du Pont Analysis for the company?
Q#7 What is the competitive landscape? What is the role of regulation in the business?
Q#8 Does the company enjoy an Economic Moat? What are its sources?
Q#9 What is the addressable market opportunity and its key drivers?
Q#10 What is the company’s growth plan? How sustainable is the growth?
Q#11 Is the management high on Integrity & transparency?
Q#12 Is the management competent?
Q#13 Does the management have passion / growth mindset?
Q#14 Does the company have a rational capital allocation policy?
Q#15 Does the company have a suitable organization structure and depth of management?
Q#16 What is the organization culture?
Q#17 Does the company have a sound succession plan?
Q#18 Do the owners have enough skin in the game?
Q#19 Have the promoters pledged a large portion of their holding?
Q#20 Has the financial modeling been done with earnings estimates for at least 3 years?
Q#21 Is it a QGL stock?
Q#22 Is valuation reasonable?
Q#23 Is there enough Margin of Safety?
Q#24 Is the stock reasonably liquid?
Q#25 What can go wrong with the company narrative & numbers?
I would strongly recommend all serious investors to read the checklist section of the MOSWCS - page 39 to 87 if they are short of time and can’t go through the entire document.
Is this a subscriber only report? I can’t seem to find it online.
I keep hearing about deals in the edtech space very other day. Fintech and Edtech are in a battle to outdo each other in the deal space. But, there is one big difference between the two sectors. Fintech is trying to address the white spaces in the segment - where there is a lack of service, like microloans, geographic reach or other innovations related to cash or credit management. Edtech, on the other hand, is not really doing anything worthwhile.
The entire edtech focus is on entrance exam prep or tuition business - both supplementary to actual mainstream education. The challenge in India is that our schools do not teach the students well enough. If they really did their jobs, we would not need tuition factories. Similarly, higher education “lottery” system is needed because there is a severe shortage of educational and subsequent job opportunities. hence, higher education becomes a sort of glorified job placement agency. And thus the mad rush to get into the hallowed educational institutes.
If we can fix the root problem, the entire edtech sector as we see it today would become redundant.
The money and effort are required in the mainstream at all levels - primary, secondary and higher education. Why can’t we have 100x the number of schools and colleges? That is a question we need to ask ourselves and others. Why should there be a scarcity of shools and colleges in India? What is the challenge in having 100x number of schools or colleges?
Probably, not for profit tag is an impediment to investments in the real education sector. Also, as a lot of small and mid level politicians control educational institutes, there is a theory of incentives at play here. And that is why it will probably never get fixed.
Agree, 100%. For an experimental sample class attempt with whitehat jr i still keep getting pursued by them wanting to make my 8 year old go to Nasa, google, certified game developer and what not. There are now mushrooms of such supplementary edtech providers wanting to create the next billion dollar valuation business. The marketing approach of the edtech is an attempt to play the Indian middle class insecurity. They have made inroads to school as well, the schools now promote supplementary content as a solution to bridge the gap each child has in different areas. Again the idea here is one school is trying to beat the other in personalized education. The schools that started as different are falling in line because of the push to online education. With online education, the teaching methods are also being exposed to parents and hence there is pressure from parents too to incorporate the online content. Just 2 cents from my experience.
But this business is mainly driven by the emotions of the parents
I think first we parents needs to understand nothing much will happen if % is less than 90-100
As long as we can’t accept anything less in comparison to others - this business will survive and flourish
Parents insist on good marks for their children because they know that it is required for getting into the next level, whether it is a good college or a job. If seats in colleges were easily available and jobs easily available, then I am sure parents would not drive their children so hard.
May be
But i still feel that this problem can’t be solved by only increasing no of colleges / schools
The competition to get into the best ones will still be there
Yes. But why assume new ones will be inferior to the existing ones. In fact, that should be the endeavour. To make new ones as good or better than the existing ones.
PE ratio, perhaps the single most used, and abused, metric in the stock market, is a simple one. And perhaps that is why it has such widespread use. People use it as a shortcut for valuing companies. So, a company with a PE of 10 becomes cheap and one with a PE of 50 becomes expensive.
PE ratio is the ratio of profit after tax to the total number of shares outstanding. Another way of calculating it is the share price divided by the EPS. The share price is simple. The complexity starts with the earnings. It could be TTM (trailing twelve month earnings), current / previous year or the upcoming year (future).
The PE ratio tells us the number of years at constant profits it will take to return the investment. So, a stock with a PE of 30 means, if the profit remains the same, it will take 30 years for the investment amount to come back to the buyer.
One of the biggest challenges of earnings is that it does not look at the capital structure of a company. In simple terms, it means it completely disregards the debt taken by a company.
PE ratio tends to capture the “agony and ecstasy” of the market. When the market is in a bear phase and investors are despondent about the future, the PE ratios of companies and indices will contract. Exactly the opposite happens during a bull phase.
Ben Graham used PE ratio to determine a “moderate upper limit to stay within the bounds of conservative valuation”. On the other hand, William O’Neill, the father of CANSLIM, said “contrary to most investors’ beliefs. PE ratios were not a relevant factor in price movement”. In his detailed study of stocks between 1953 to 1988, O’Neill found that the average PE before a stock made a major bull move, had a PE of 20 as opposed to the average Dow PE of 15. Even in the Indian markets, I have seen enough anecdotal evidence to support the fact that there are some perpetual high PE stocks – Asian Paints, Berger, Nestle, Page Industries, Symphony, Pidilite, Dmart, Titan and many many more come to mind.
The way I use PE is to divide a company’s PE with that of the index (Nifty). For example, Asian Paints has a PE ratio of about 125 as I write this. The Nifty PE is about 37. That is, a ratio of 125 / 37 = 3.3 times. In January 2006, the same ratio was 28 / 17 = 1.6. In Jan 2015, it was 60 / 21 = 3. If I do this exercise, I find that Asian Paints usually trades between 1.5 – 3.5 times of my PI (PE to Index) ratio. You can do a similar exercise for the stocks you are interested in and find the range.
The PI ratio tells me how much a stock is being “valued” by the market with respect to the general market.
Another practical experience that I have had is to never sell a stock on high valuations. It is always best to have a trailing stop (a stop loss that keeps trailing the price as the stock price moves upwards), because, stocks can remain at a high PE or can go to a higher PE during a major bull phase and selling out early often means I am not participating in the most explosive of price rise phase. Again, if you followed this suggestion, you would be comfortably riding stocks like Dmart even at 100+ PE and earning the wrath of closet value investors!!! The only exception to this is if you are invested in a very illiquid stock, where you may need to start liquidating on the way up.
** This first appeared in https://economictimes.indiatimes.com/markets/stocks/news/what-to-do-when-high-pes-give-you-jitters-heres-the-answer/articleshow/80400796.cms
Sir
It Makes sense…only one has to peg the right index to the corresponding stock. Bcoz not all indices have run up as much as Sensex or Nifty has
Or we should always use nifty index
Please help
What matters more is consistency. If you use Nifty500 then use that over time. If you use Nifty50, then use that over time.
Thanks
Yes this is good
Atleast this will give a more realistic picture
I have been fascinated by the “Great Depression” and the lost decades of Japan for a long time now. I have a personal fascination for Japan because it was the first foreign country I ever visited. It is intriguing because here is one example of one of the foremost economies in the world, with world-leading companies and yet they ended up in nearly 20+ years of economic depression. Bank of Japan had tried “pump-priming” which is a convoluted way of saying they tried to money-print their way out of the problem. Despite having near zero or very low interest rates for decades there has been no effective pick up of the economy.
I always thought it was a result of the socio-politico-economic structure of Japan that led it such a prolonged slump. A few days back I tweeted about this and asked twitterati about any good suggestions to read on this topic. @Relax_Cap suggested I read The Holy Grail of Macroeconomics: Lessons from Japan’s Great Recession by Richard Koo. The book and a few interviews of Richard Koo has been a wonderful revelation to me and I very thankful to @relax_cap for the great suggestion.
Richard Koo’s main premise is as follows. Asset prices got inflated during the bubble years and corporates took on large debts to either acquire assets or fuel growth. Once the bubble burst, corporates were straddled with the debt and much less valued corresponding asset value as the market prices of the assets they owned had crashed. The initial tendency of the corporates was to save from their cashflow to repair their balance sheet. Central bank step in to bolster growth and starts by reducing rates. But there is no demand for debt as the corporates (and households) are trying to reduce their existing debt burden and are in no mood to add on to debt even at ridiculously low rates. This results in economic growth to falter and slacken and it continues in this manner till the corporate balance sheets are repaired. Richard Koo termed this as a “balance sheet recession”.
He has gone on to explain this in a lot of detail and has lots of examples related to US and Eurozone.
I think we are seeing a part of this being played out in India as well post the 2008 Great Financial Crisis (GFC). We have seen a large reduction in corporate debt. Most of bank debt growth has come from the retail segment led by consumer spending. That explains the dream run of consumer-facing NBFC like Bajaj Finance. In India, IBC is another policy is likely to increase this balance sheet recession further. With erstwhile big businesses and “connected” promoters now losing their companies due to the new bankruptcy code. Add this to a post-Covid situation where both corporates and households suddenly realize the value of cash, it is possible that people increase their savings to shore up their cash balances. The only saving grace for India, unlike US or Europe, is that India is much less debt-ridden and so we are unlikely to get into a prolonged recession.
The implications could be:
The next few days will see a lot of volatility. The annual budget is around the corner and although in most years it is a damp squib, yet all financial “experts” will spend or have already spent a great deal of time to tell the finance minister what to do or ask for favours from her. Most of it is a waste of time. So, productivity tip number one. Just skip over any pre-budget discussion in the newspaper or TV channel.
The budget is not supposed to be a spectacle. And perhaps it wasn’t before the tyranny of the 24x7 media cycle. Now, the TV channels need something to talk about and they keep moving from one event to another. The only worthwhile thing to do for the budget is to either listen to it or better still read the synopsis in the next day’s newspaper. Everything else is a waste of time and effort.
The budget should not even be an event. Previously, people were interested in the tax measures announced in the budget. Now, the major part of it has moved under the GST council and the budget will not have anything to really say about indirect taxes. Direct taxes should not be tweaked every year so maybe once every five years there should be some minor changes to it.
The rest is all accounting. And boring. Because we all know that a lot is being left out and is financed through off-balance-sheet routes. That’s how it has always been.
Yet, markets become volatile before budgets. People try to pre-empt different policy decisions and sectors or companies that are likely to benefit or lose out and then take positions accordingly. Some people sell and lighten up their portfolios due to event risk. The thing to remember is maybe once in many years we get a budget where some path-breaking decisions are taken. Rest of the time it’s just volatility. And for investors focused on holding businesses for the long term, it is just noise. The best thing to do is to ignore it.
How do you use the trailing loss. What percentage do you use
Using a fixed percent stop loss is not a good idea. Better to use an ATR based system, or even a slow moving average like a 100 or 200 day moving average.
Every investor has a set of tools that he uses on a regular basis. I also have my toolset. In this post, I will cover these and try to describe how I use each of them.
Hope you find these useful. Also, if you use any tool which is not in this list and find it compelling, do let me know. I gravitate towards free resources whenever possible, but if there is a great paid resource, then it is fine as well.
This is my primary note-taking app. I have it on my laptop, tab and mobile. I have notebook for investing with the following sections, with each section comprised of many pages. For example, every company that I look at and study have a separate page, where I keep adding my notes over time.
I use Feedly as my repository of most of all my online blog subscriptions. Here again, I have separate tags like economics, fundamental, technoquant etc.
If I find a good article on the web, I use Pocket to save it for future reference. I use it extensively on all my devices.
I used twitter very sparingly before. Recently, I have repurposed my usage. I have made lists like News, Investing, People I know, Technoquant etc. This helps me in segregating my feed. I have also started using twitter as a short term micro note taking app for what I may be reading or thinking at any time. At the end of the week, I review what I have noted and then copy any notes in OneNote.
I have a gmail id where I save or forward all reading materials, especially broker reports, that I get from multiple sources like whatsapp or email or on the web. The benefit of using gmail is it is easy to search later.
I have migrated nearly all my reading to electronic form. JioNews app is a great resource where I can quickly skim through newspapers and business and current affairs magazines.
I have been reading books on an e-reader for nearly 15 years now. I started with using an Infibeam Pi and then migrated to Kindle when it started becoming available in India. Currently, am on my 3rd Kindle device. I have the basic version with backlight and absolutely love it. nearly all my book reading is on Kindle. Highlights and note-taking are the main features I love in the Kindle.
I track my portfolio and watchlist on google sheets. Again, the advantage is I can access it on all my devices and I can customize my views and reports.
The first port of call to look up a new company. I have a premium subscription. I use screener extensively for tracking my watchlist stocks, monitoring quarterly results, company announcements etc. Having added my favourite ratios to the company page, I can quickly view and understand the basic fundamentals of a company in under 5 minutes. I have customised the excel download feature and added some basic things I check myself. Although my custom excel is not as beautiful as a lot of others that are available, it seems to work well for me.
The second port of call for getting up to speed on any company.
I use the “Discover” feature extensively. Helps in surfacing specific announcements based on topic/category. Also, their youtube channel now has a lot of concall recordings.
Concall transcripts are available here and is very useful in skimming through.
Concall recordings
I will quickly go through tijori once in a while to see if something comes up that has been missed in screener.
When in doubt about numbers or while searching for annual reports, BSE site is my port of call.
Data and visualisations for all macro data.
Interesting data, visualisations and reports on important topics.
I love tradingview charting but the free version has a lot of restrictions. investing.com uses the same tradingview charts but has no limitations (or at least none that I have found that hinders my usage).
Use this for basic explorations or scans.
Use Metastock nowadays only for slightly complex explorations which cannot be done on chartink.
A very good fundamental and technical scanner for US listed stocks
Perhaps the best dashboard app out there. I use it for looking at global stocks that I own or have on my watchlist.