
Divi’s Lab
Formed a cup & handle breakout, consolidating near the the 5600-6250 mark. Potential target of C&H could be 7500-7600 range. Fundamentally also the company’s profits have grown significantly in the recent times. Any thoughts on the pattern from senior boarders?
Overall API & Pharma space did hold its strength very well in the recent Oct-Dec. correction.
Could signal a potential sector rotation?
Disclosure : planning to invest.

4 Likes
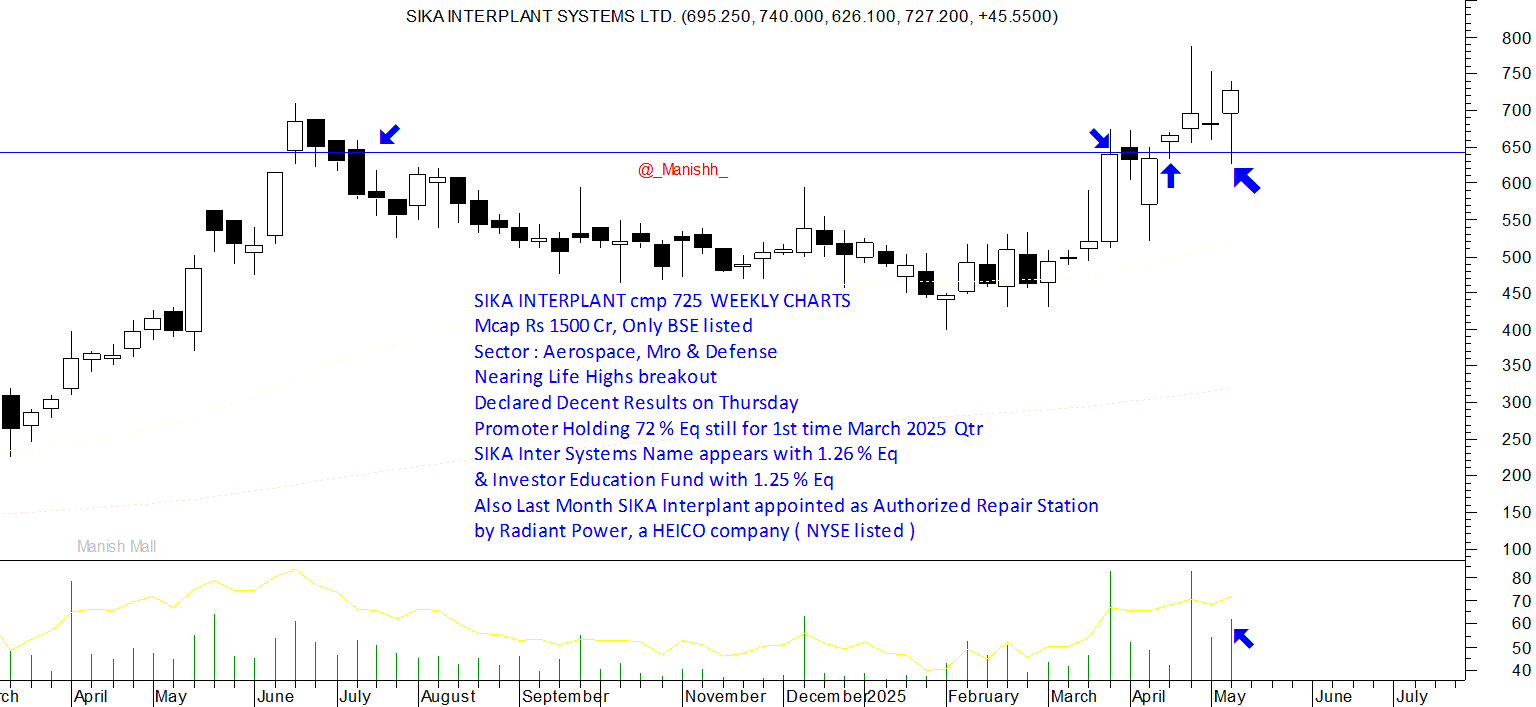
SIKA INTERPLANT cmp 725 WEEKLY CHARTS Mcap Rs 1500 Cr, Only BSE listed
Sector : Aerospace, Mro & Defense
Nearing Life Highs breakout More Details On Charts
6 Likes
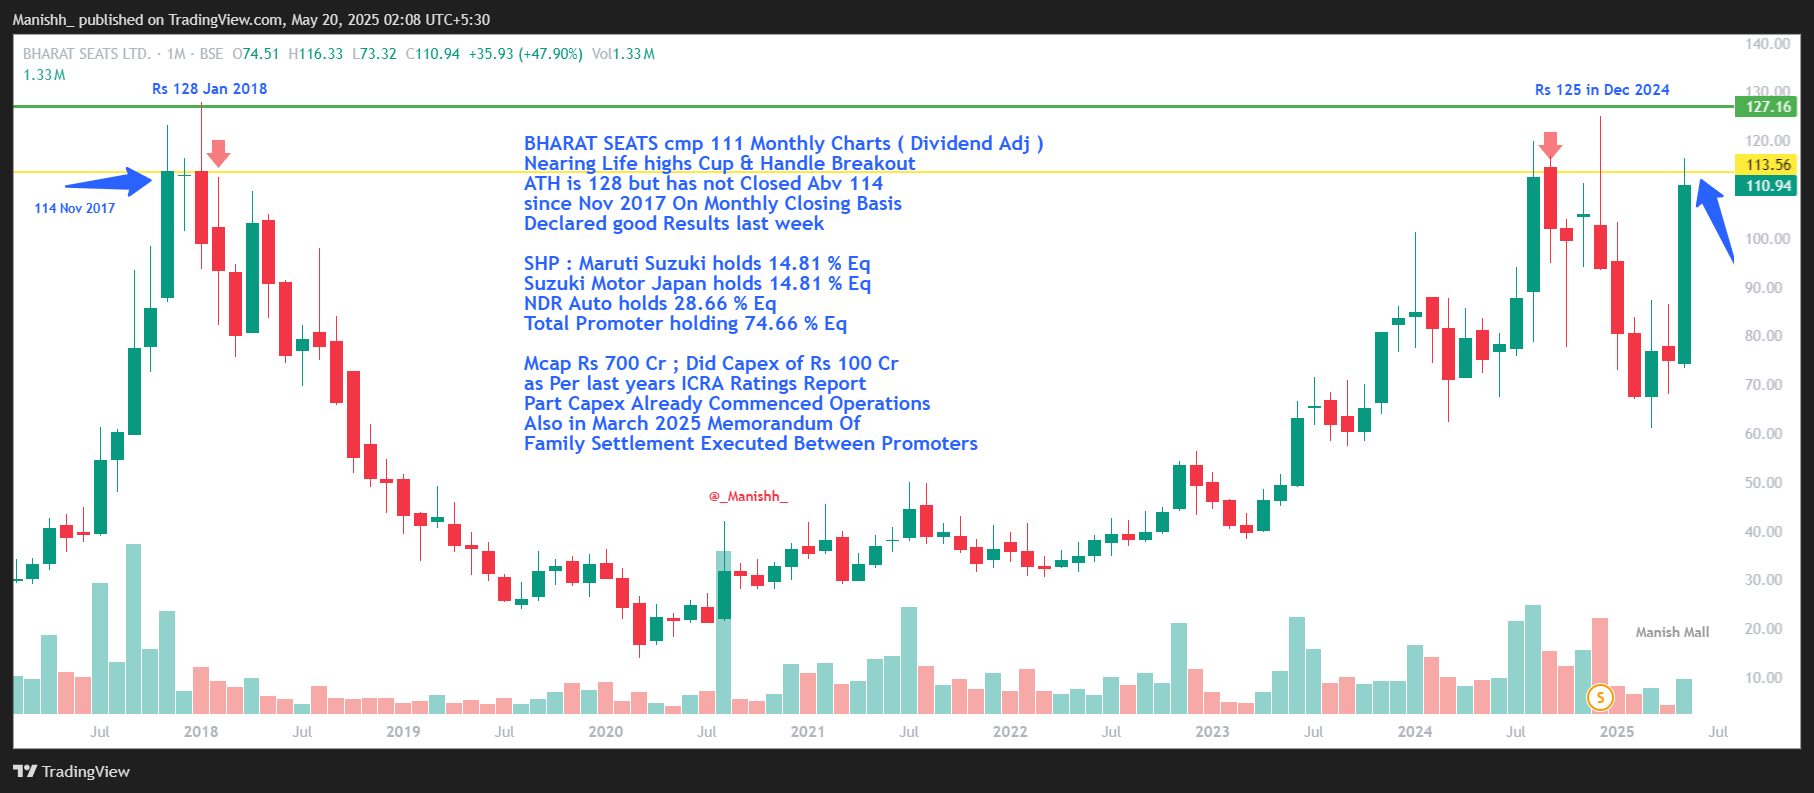
BHARAT SEATS cmp 111 Monthly Charts ( Dividend Adj )
Nearing Life highs Cup & Handle Breakout
ATH is 128 but has not Closed Abv 114 since Nov 2017 On Monthly Closing Basis
Declared good Results last week
SHP : Maruti Suzuki holds 14.81 % Eq Suzuki Motor Japan holds 14.81 % Eq
NDR Auto holds 28.66 % Eq Total Promoter holding 74.66 % Eq
Mcap Rs 700 Cr ; Did Capex of Rs 100 Cr
as Per last years ICRA Ratings Report Part Capex Already Commenced Operations
Also in March 2025 Memorandum Of
Family Settlement Executed Between Promoters
8 Likes
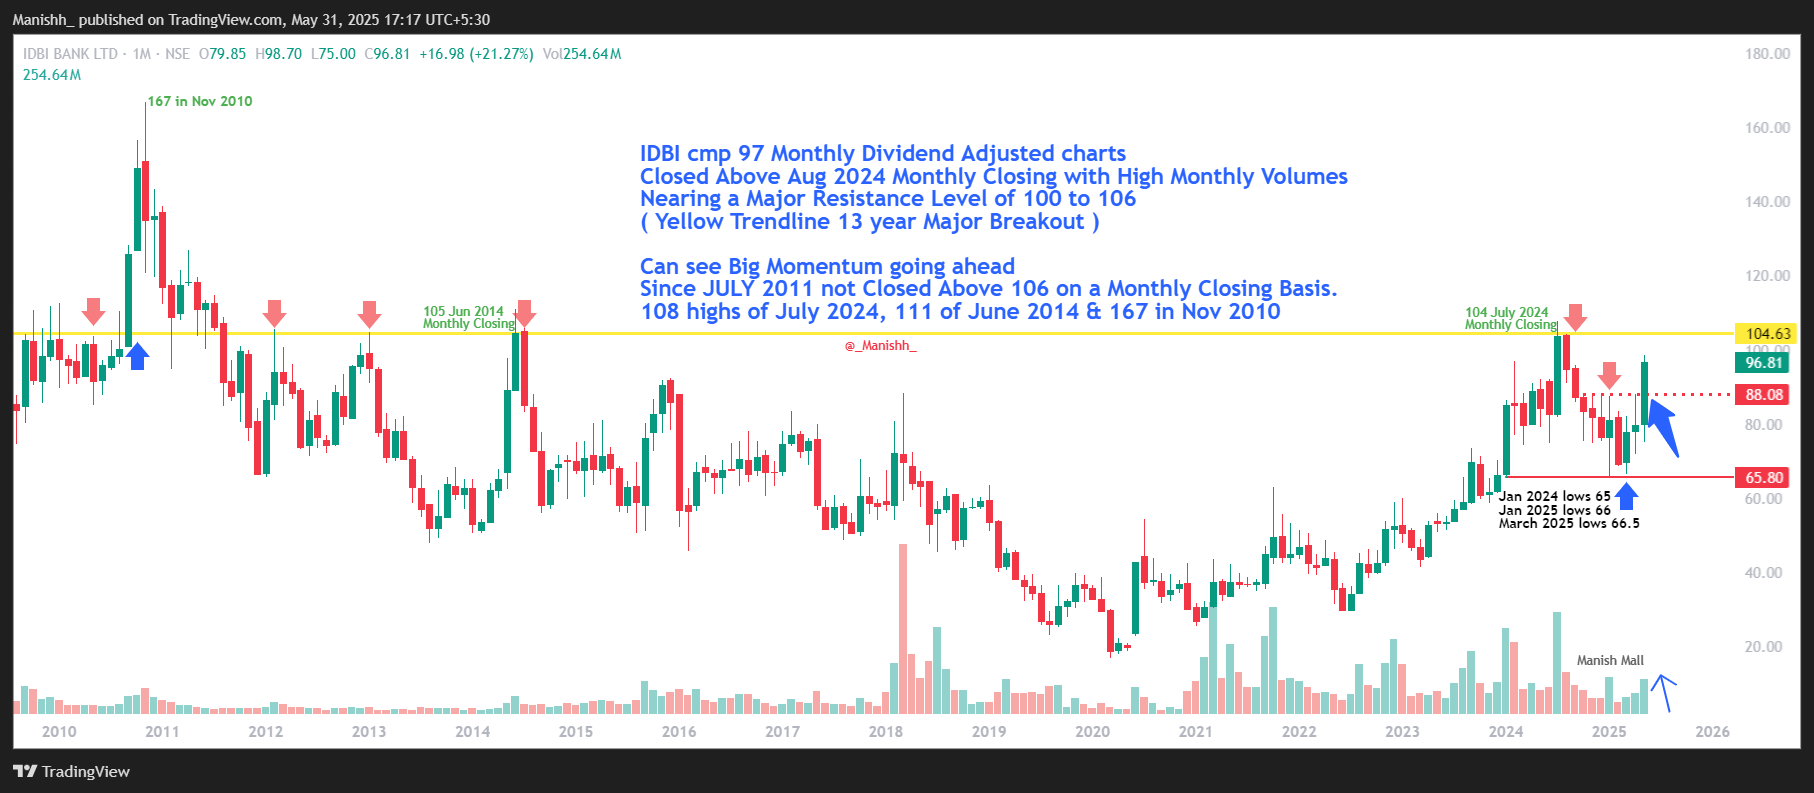
IDBI cmp 97 Monthly Dividend Adjusted charts
Closed Above Aug 2024 Monthly Closing with High Monthly Volumes
Nearing a Major Resistance Level of 100 to 106
( Yellow Trendline 13 year Major Breakout )
Can see Big Momentum going ahead
Since JULY 2011 not Closed Above 106 on a Monthly Closing Basis.
108 highs of July 2024, 111 of June 2014 & 167 in Nov 2010
9 Likes
Hello @hitesh2710 Sir.
Earlier you were liking Jammu Kashmir Bank,
And in your Hitesh Portfolio Thread 2 Days ago you have said
about Financial & PSU Banks Sector to look forward too
Would like to know your Fundamental views on J&K Bank
Technical Chart Attached for your Refrence
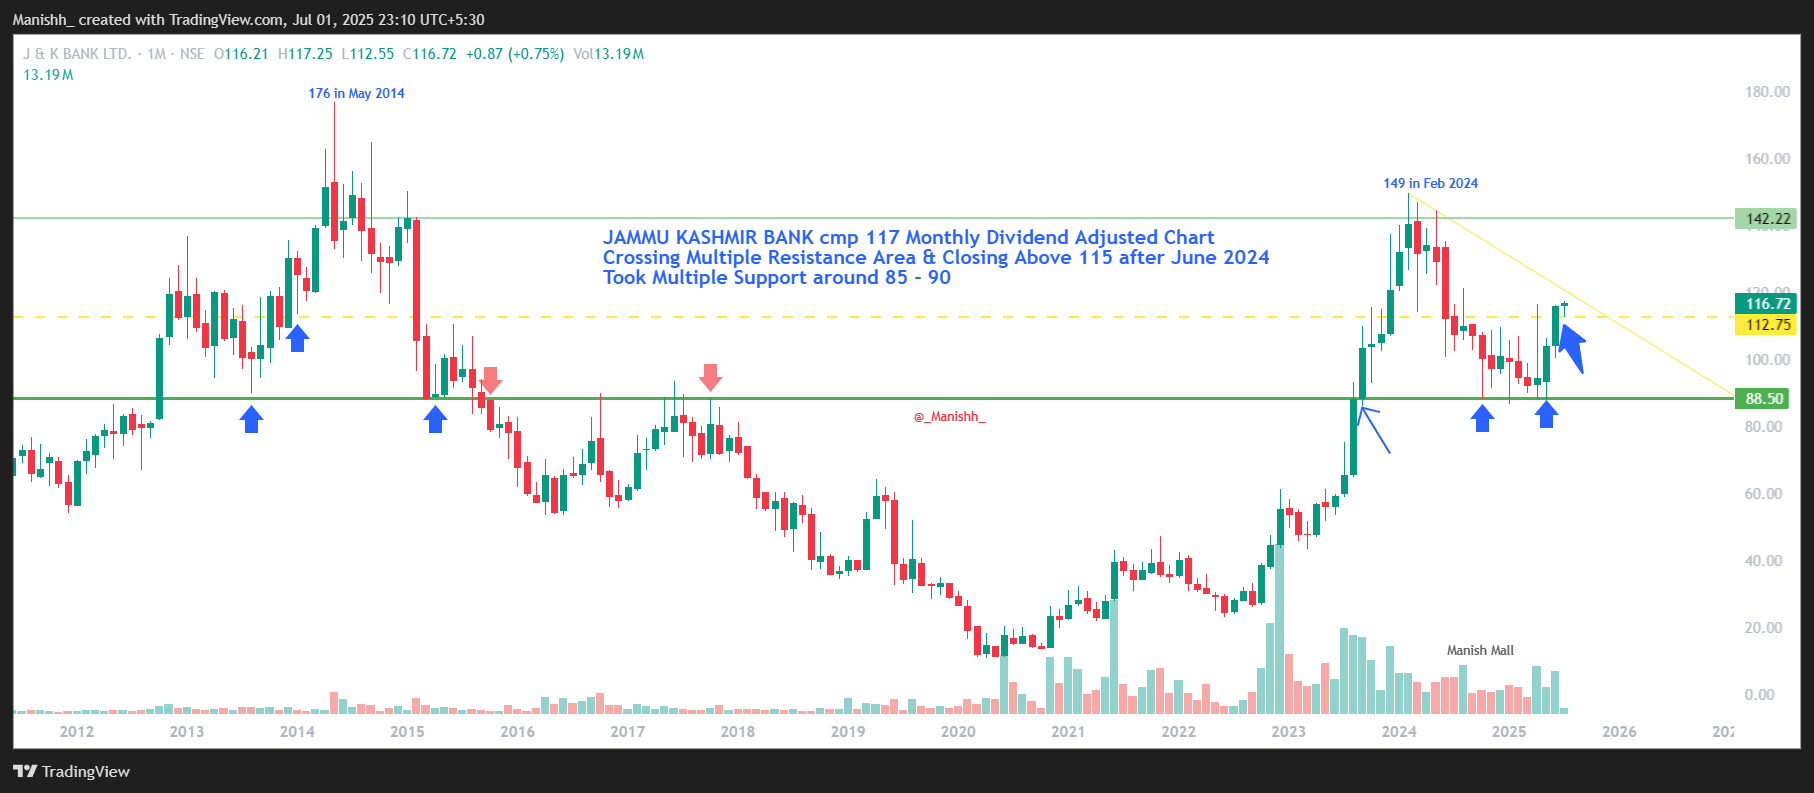
JAMMU KASHMIR BANK cmp 117 Monthly Dividend Adjusted Chart
Crossing Multiple Resistance Area & Closing Above 115 after June 2024
Took Multiple Support around 85 - 90
2 Likes
Ever since Pahalgam attack I have stopped tracking JK Bank as I don’t know how much the fall in tourism is going to affect the business of this bank. Plus there are many other smaller PSU banks in listed space with almost similar characteristics.
14 Likes
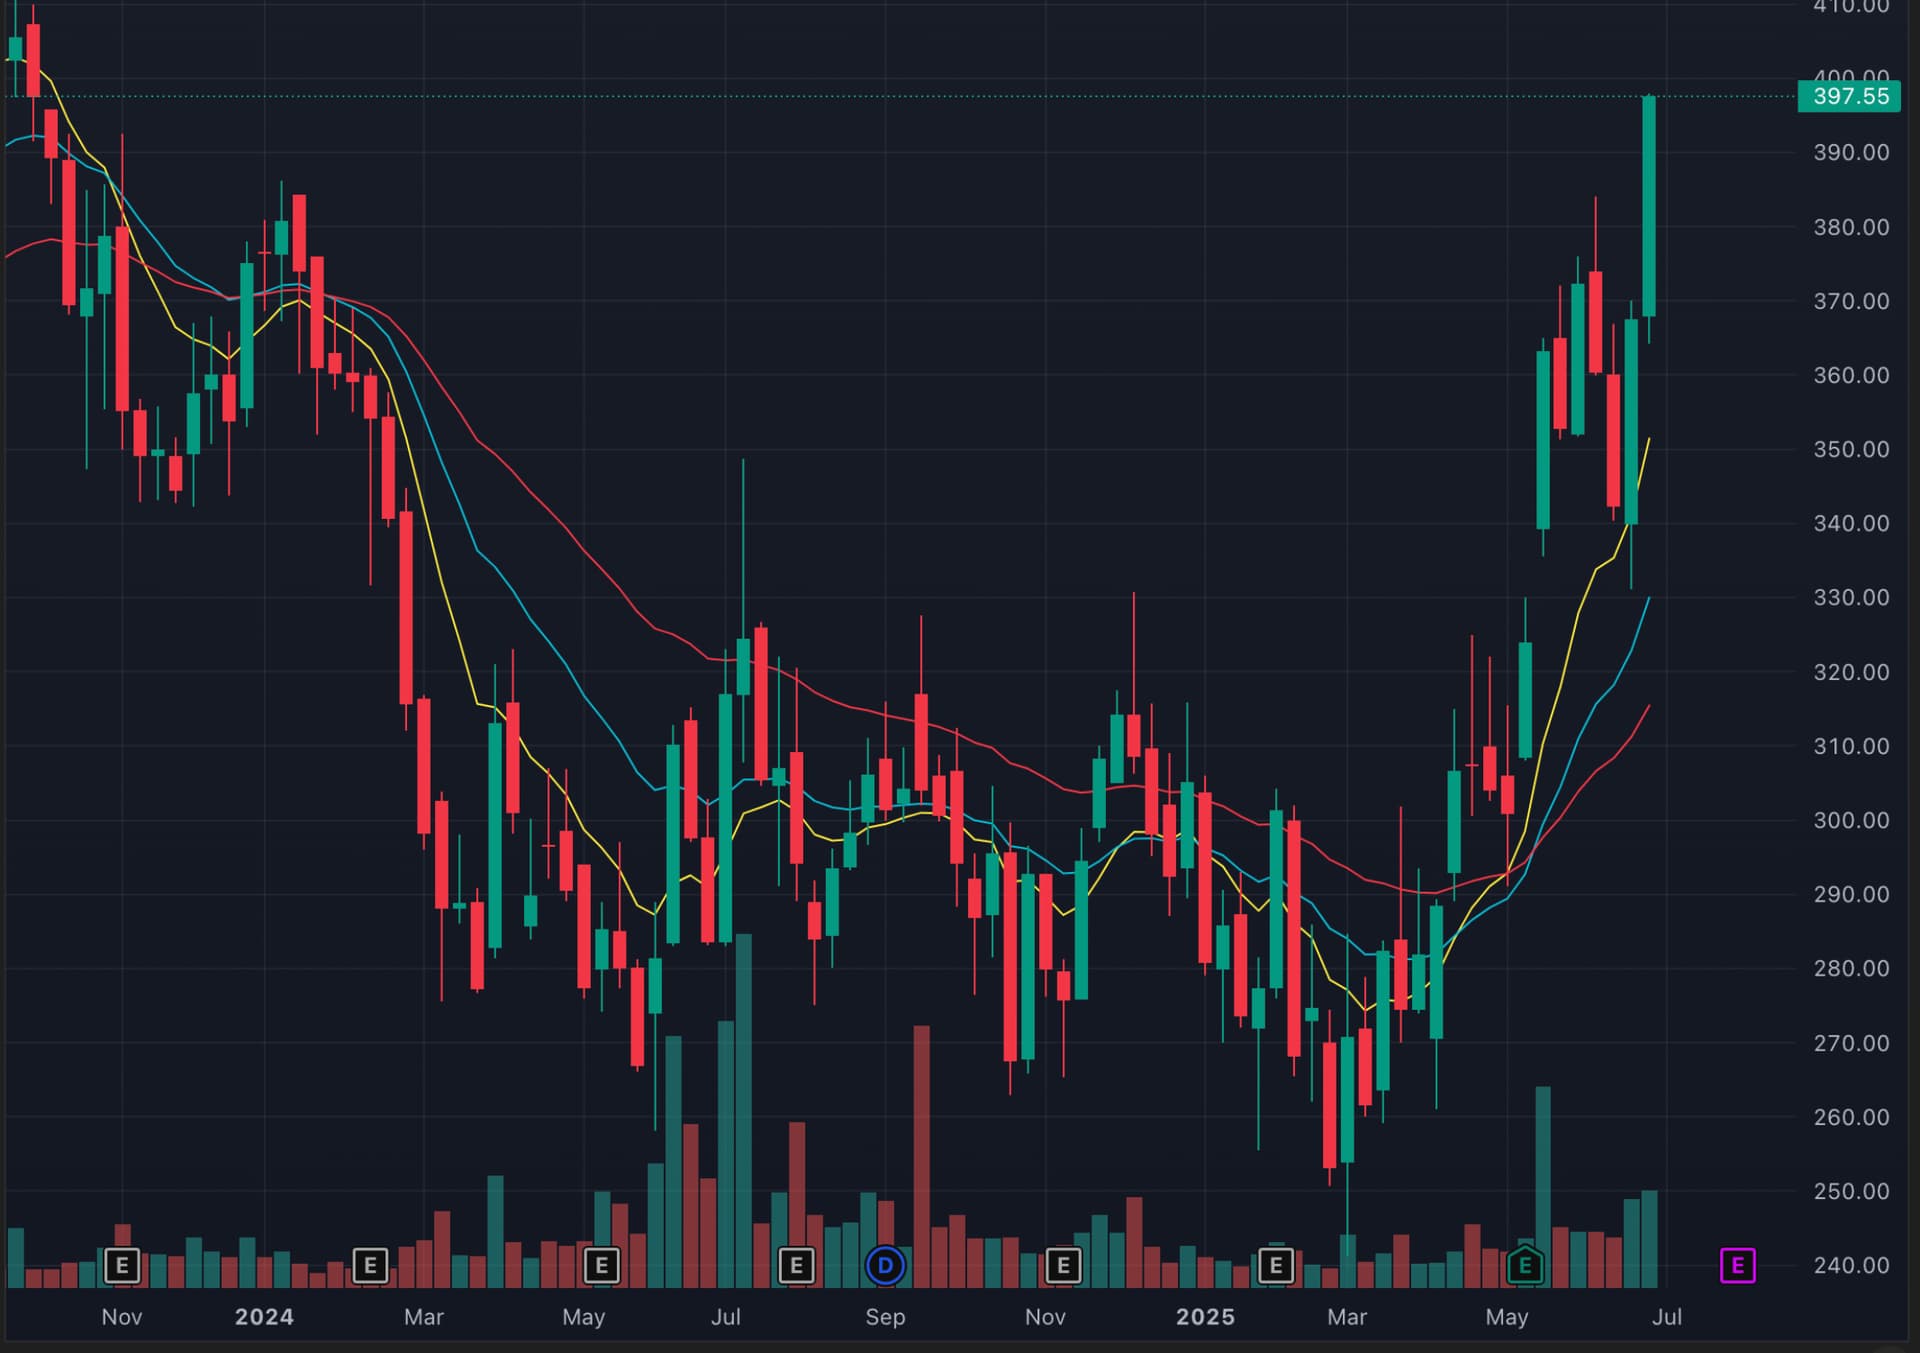
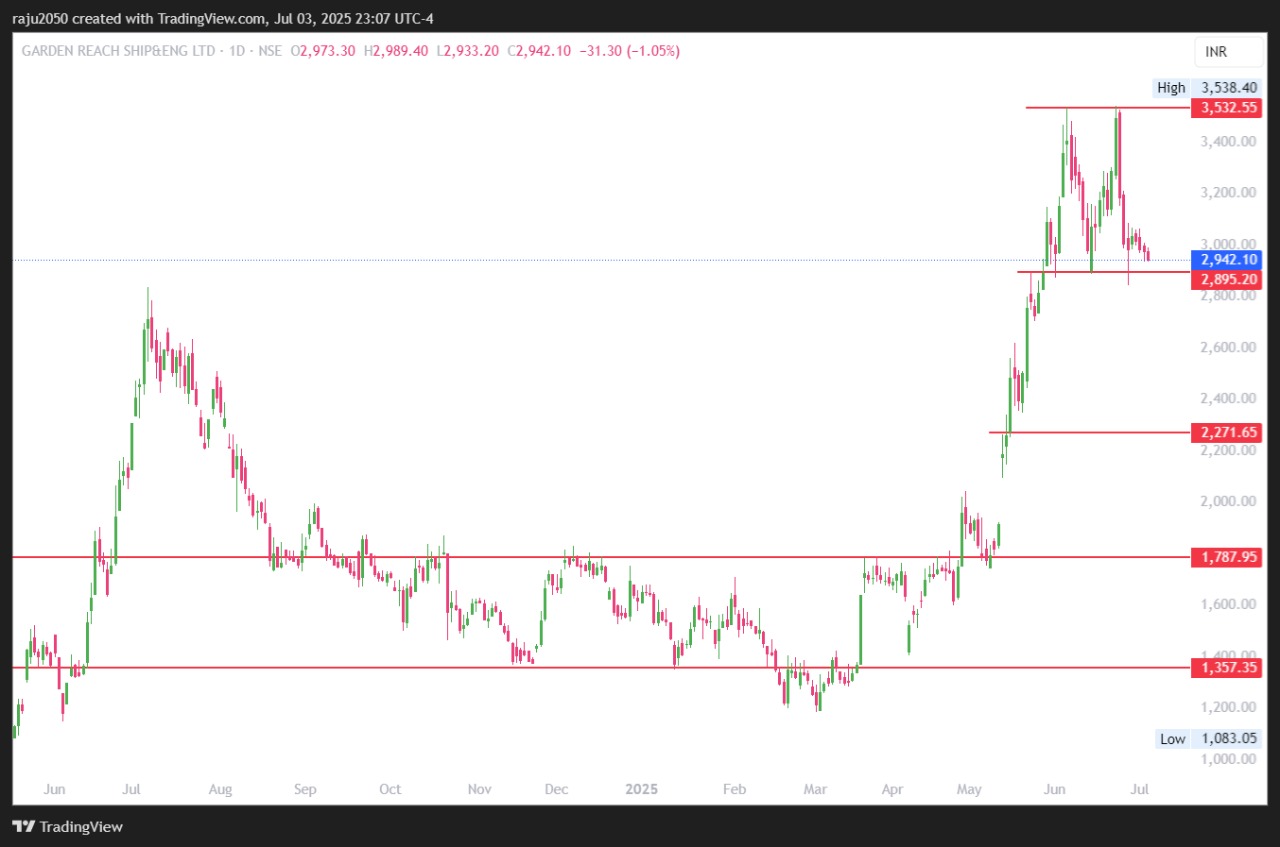
GRSE chart.. It has a lot of learnings.. On left side of chart we can see a high of 2840 in July 2024. That was the time when defence was the darling of markets and a few defence focussed mutual funds were launched and that made headlines. Stock price made a top in those heady times.. Post that it fell and spent nearly 8 months between Sep 2024 to April 2025 between a broad price range of 1350 to 1800.. And once it broke out above 1800 convincingly, it took off to post a fresh new all time high of 3530 plus. Since then it seems to have formed a double top at 3530 levels and the low of the pattern is 2900. If and when 2900 breaks on downside convincingly, we can have a target of 2270 on way down. That level is between 50 to 61.8% retracement to the entire previous rally from below 1200 to 3500. I don’t know if there will be a breakdown or not and whether 2270 will be achieved or not, but when a sector or stock starts making news headlines with bullish and super bullish news, its time to be careful. Sometimes charts do provide warnings and its up to us to whether to ignore them or not..
disc: no position in any defence stock as of now. no bullish or bearish bias. Shared only for the purpose of the learnings the chart offers. Say if in future I see a stock having a fall similar to the one we had post July 2024 in GRSE and we have say 6-12 month consolidation in a tight range and then a breakout on the upside, we can recall this kind of pattern and see if we can spot an opportunity.
59 Likes
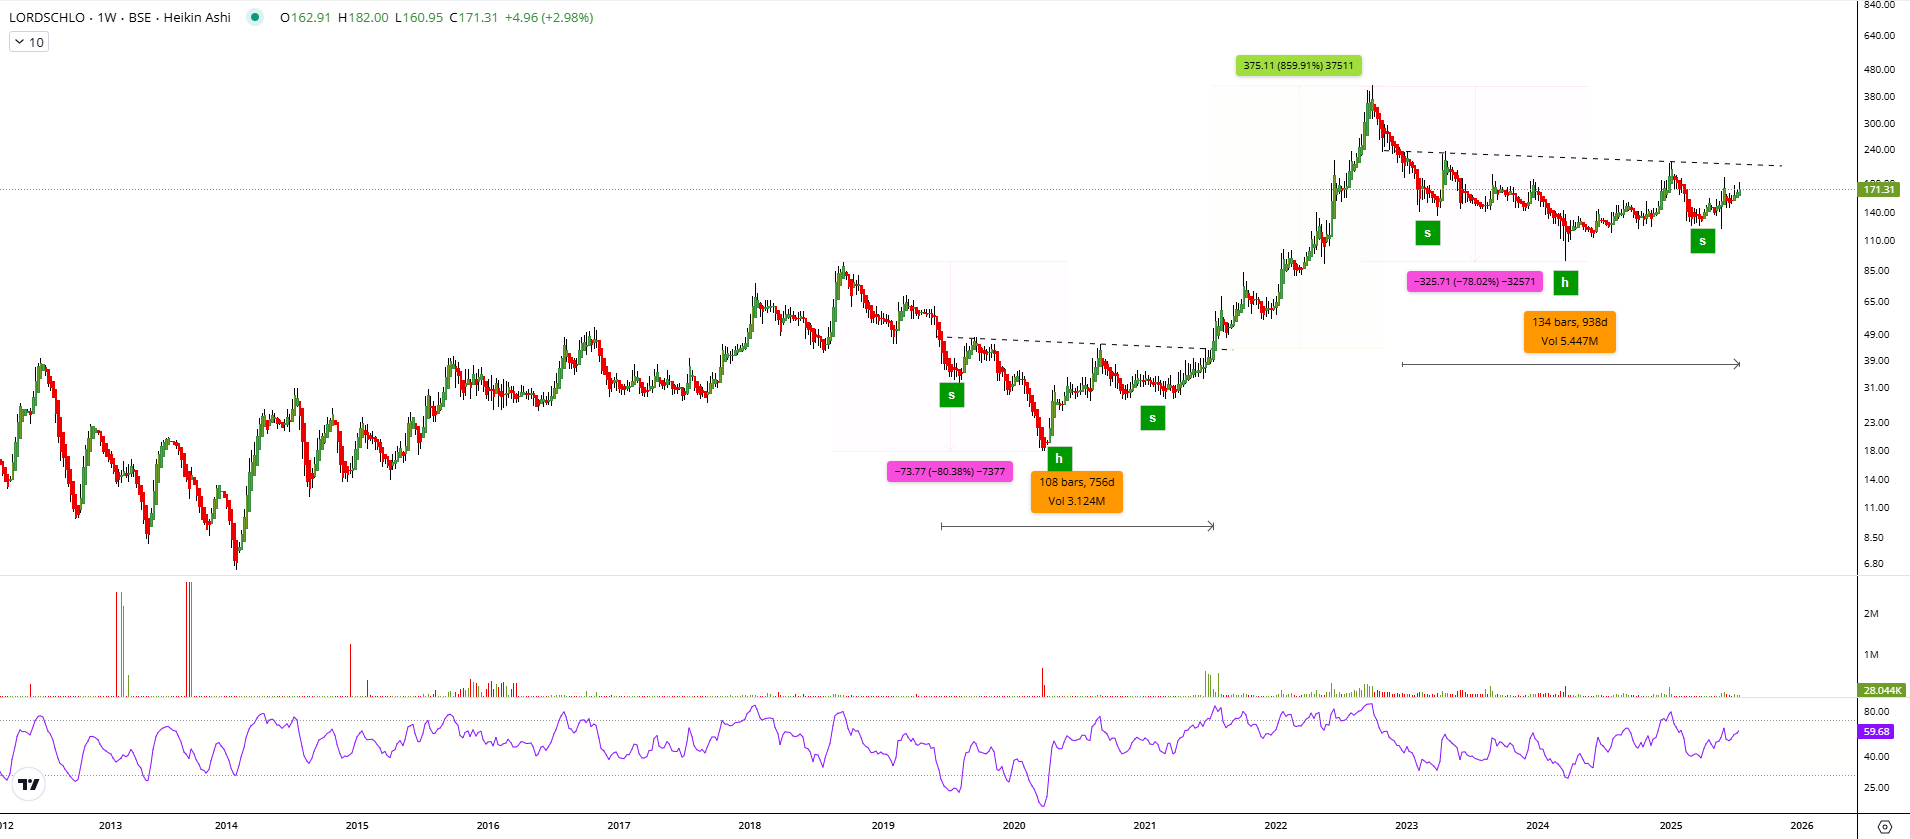
LordsChloro forming an inverse H&S pattern. Similiar pattern previously post DD lead to decent upmove.
Fundamentally Caustic soda prices have bottomed. Promoters have participated in warrants..
6 Likes
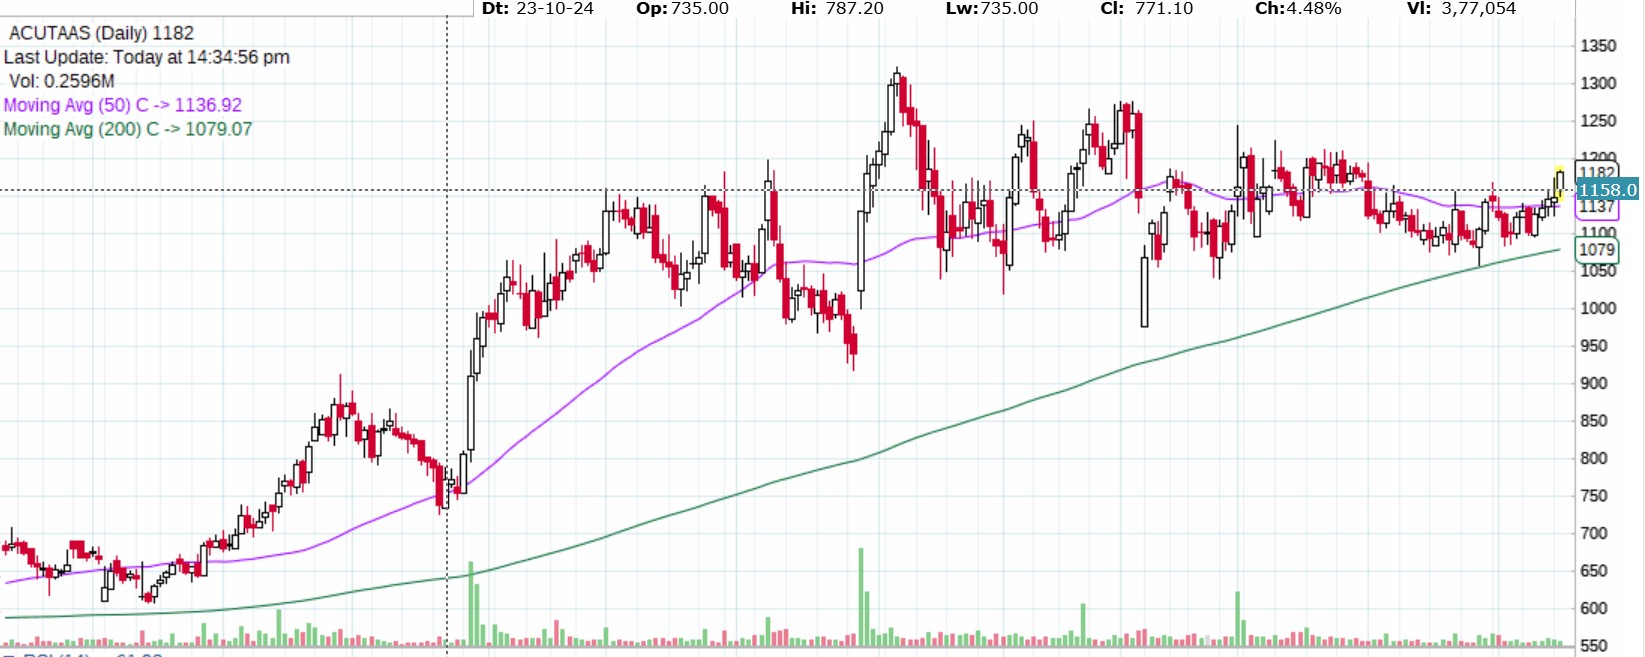
The stock has been on the downtrend. Fundamentally, the entire industry has slowed down. It would be tough for this player to perform best on Operational parameters as atleast a normal scan over Linkedin shows the team is ordinary. If today’s levels are breached there can be freefall. The first thing to do in the markets is to preserve the capital so those wanting to catch a falling knife should be conscious.
9 Likes
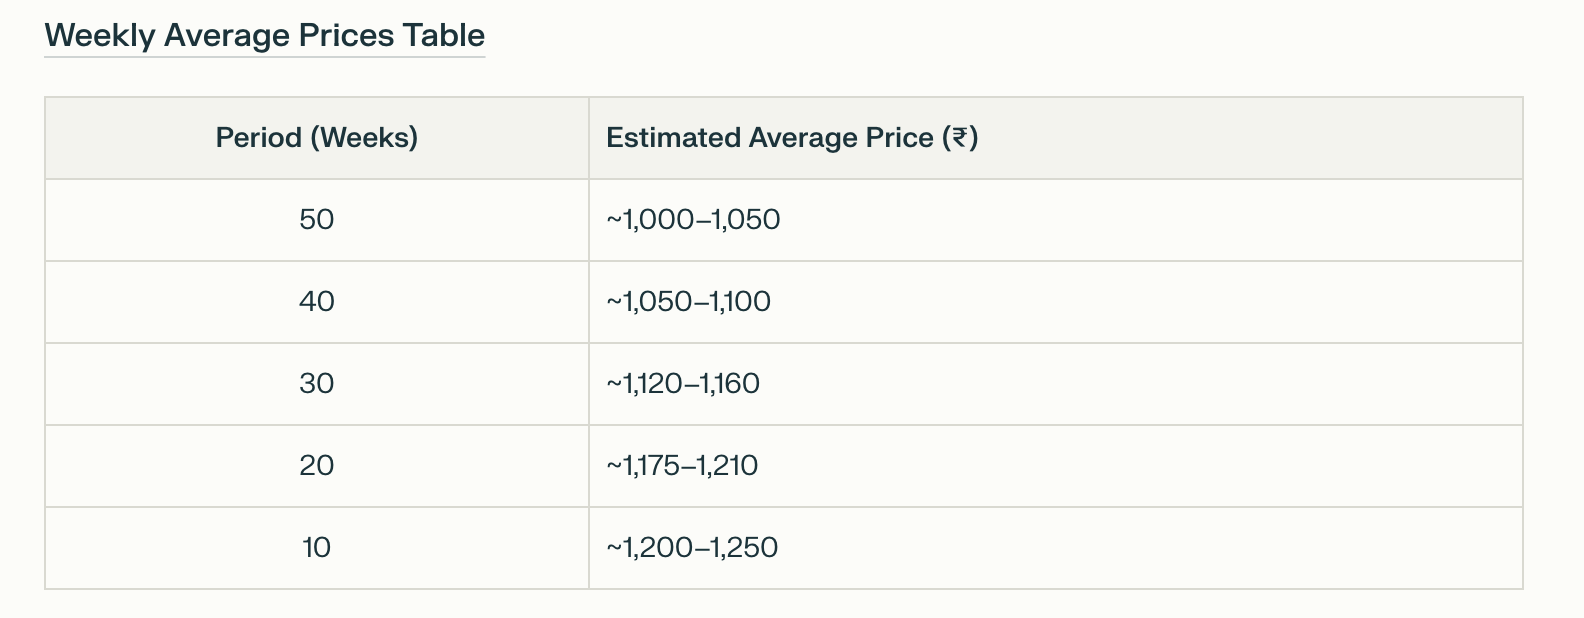
Global spirits nearing its 52 week high
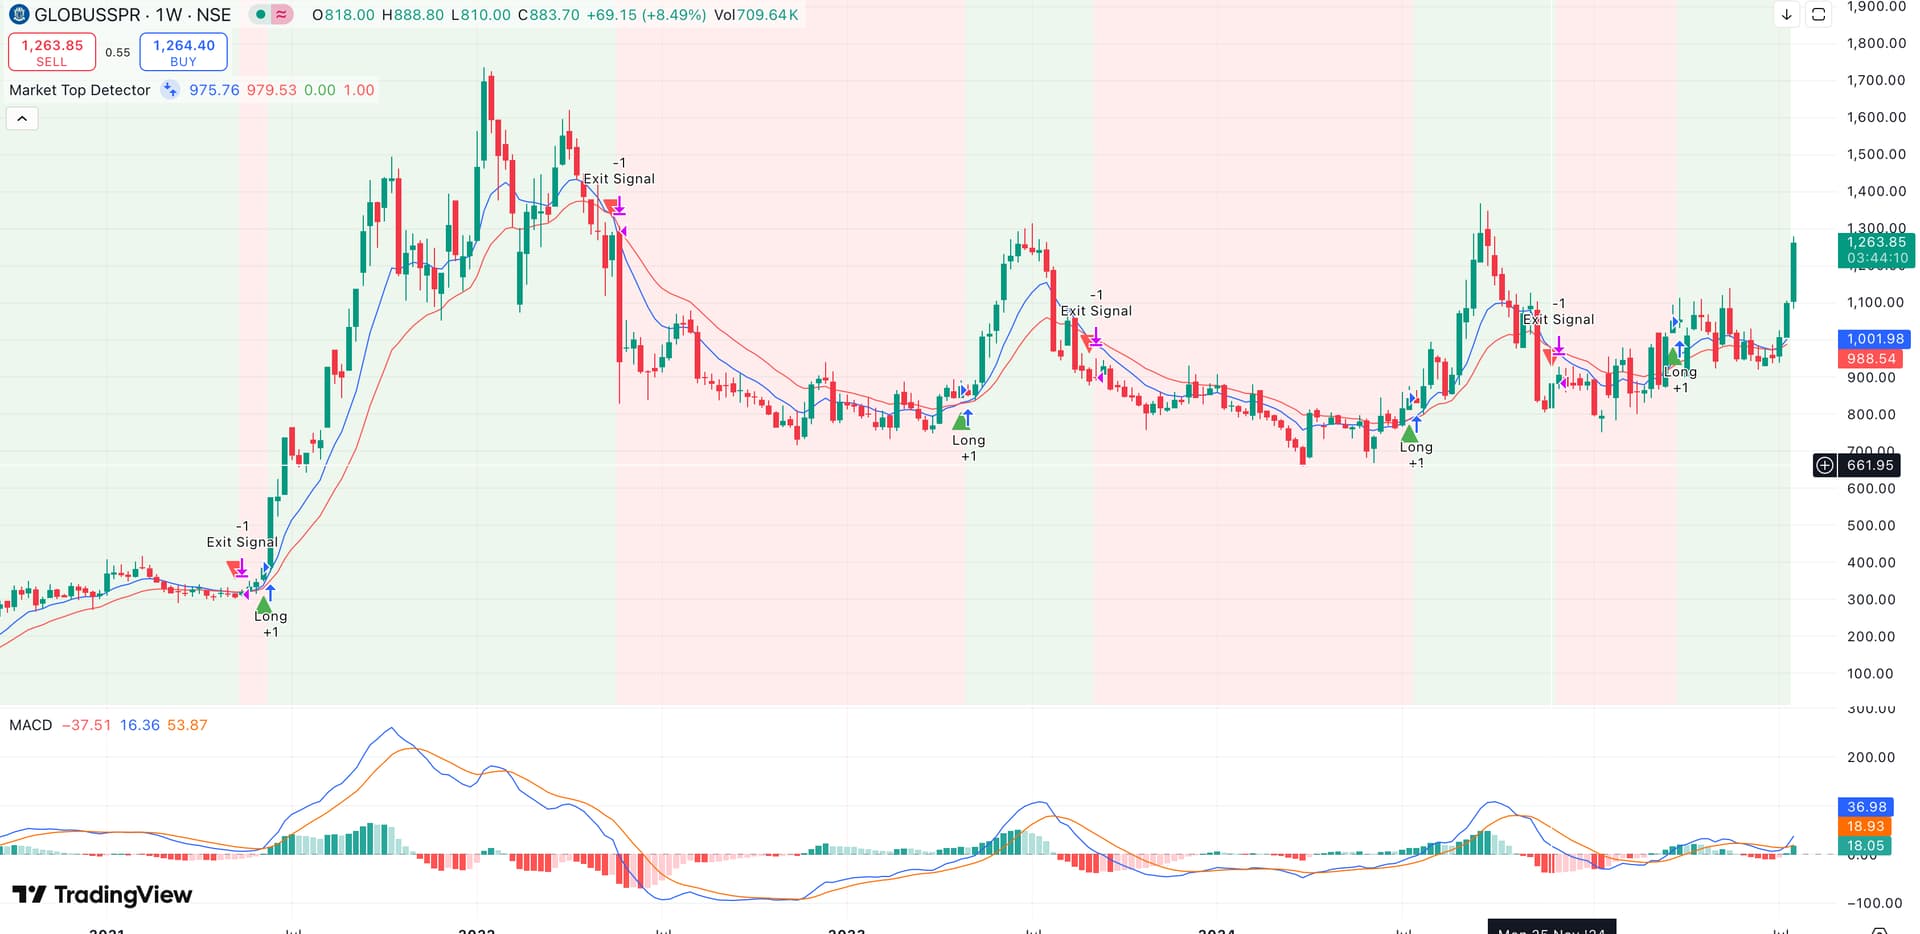
The table below presents the estimated average traded price of Globus Spirits Ltd stock across various time periods (measured in weeks).
Note: The prices were calculated using Perplexity.ai.
2 Likes
Guidelines on Posting Stock Charts and Investment Advice
Dear Members,
To ensure compliance with SEBI regulations:
• Only SEBI-registered Investment Advisers or Research Analysts are permitted to post charts and technical analysis having real time data on this forum. All such posts to include their SEBI registration number and standard regulatory disclosures.
• Unregistered members are strictly prohibited from posting any charts or messages that could directly or indirectly constitute investment advice or solicit the same.
• Any posts including “buy,” “sell,” or “hold” calls or predictions about stock movements are prohibited already and will continue to do so unless its from sebi registered Entities.
• Charts containing data older than three months may be posted on the forum for educational purposes.
Any posts violating these rules will be removed, and repeated violations may result in suspension.
5 Likes