
Anuh Pharma Ltd
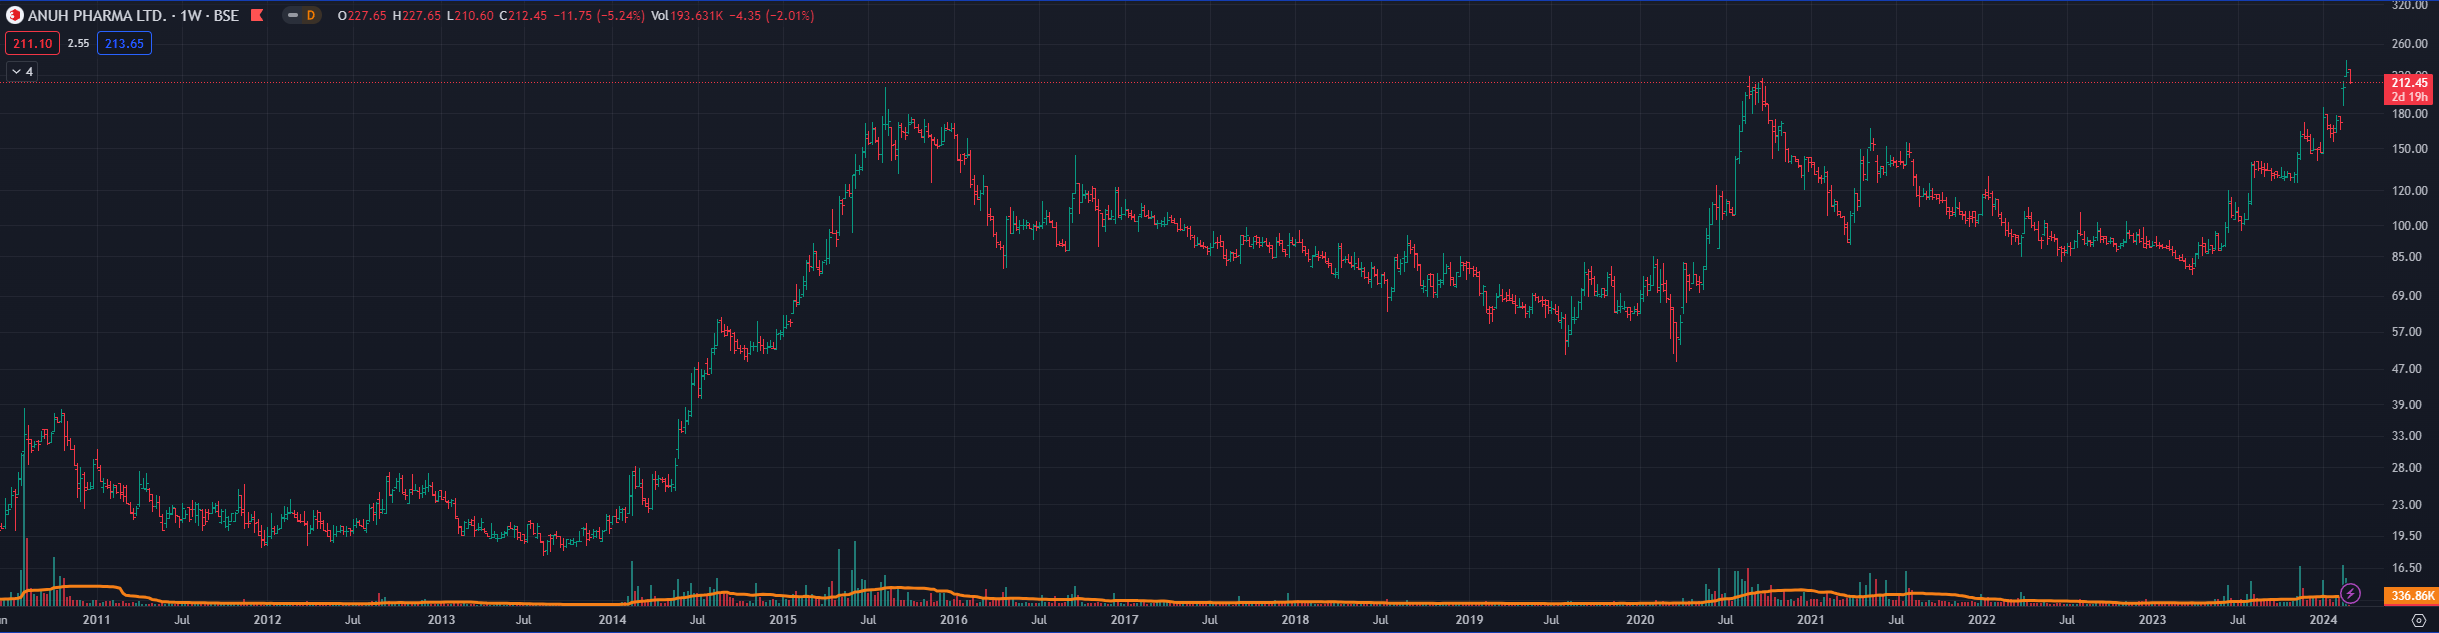
Weekly chart - Testing the long term resistance. company had guided for 16% CAGR for the next 5 years.
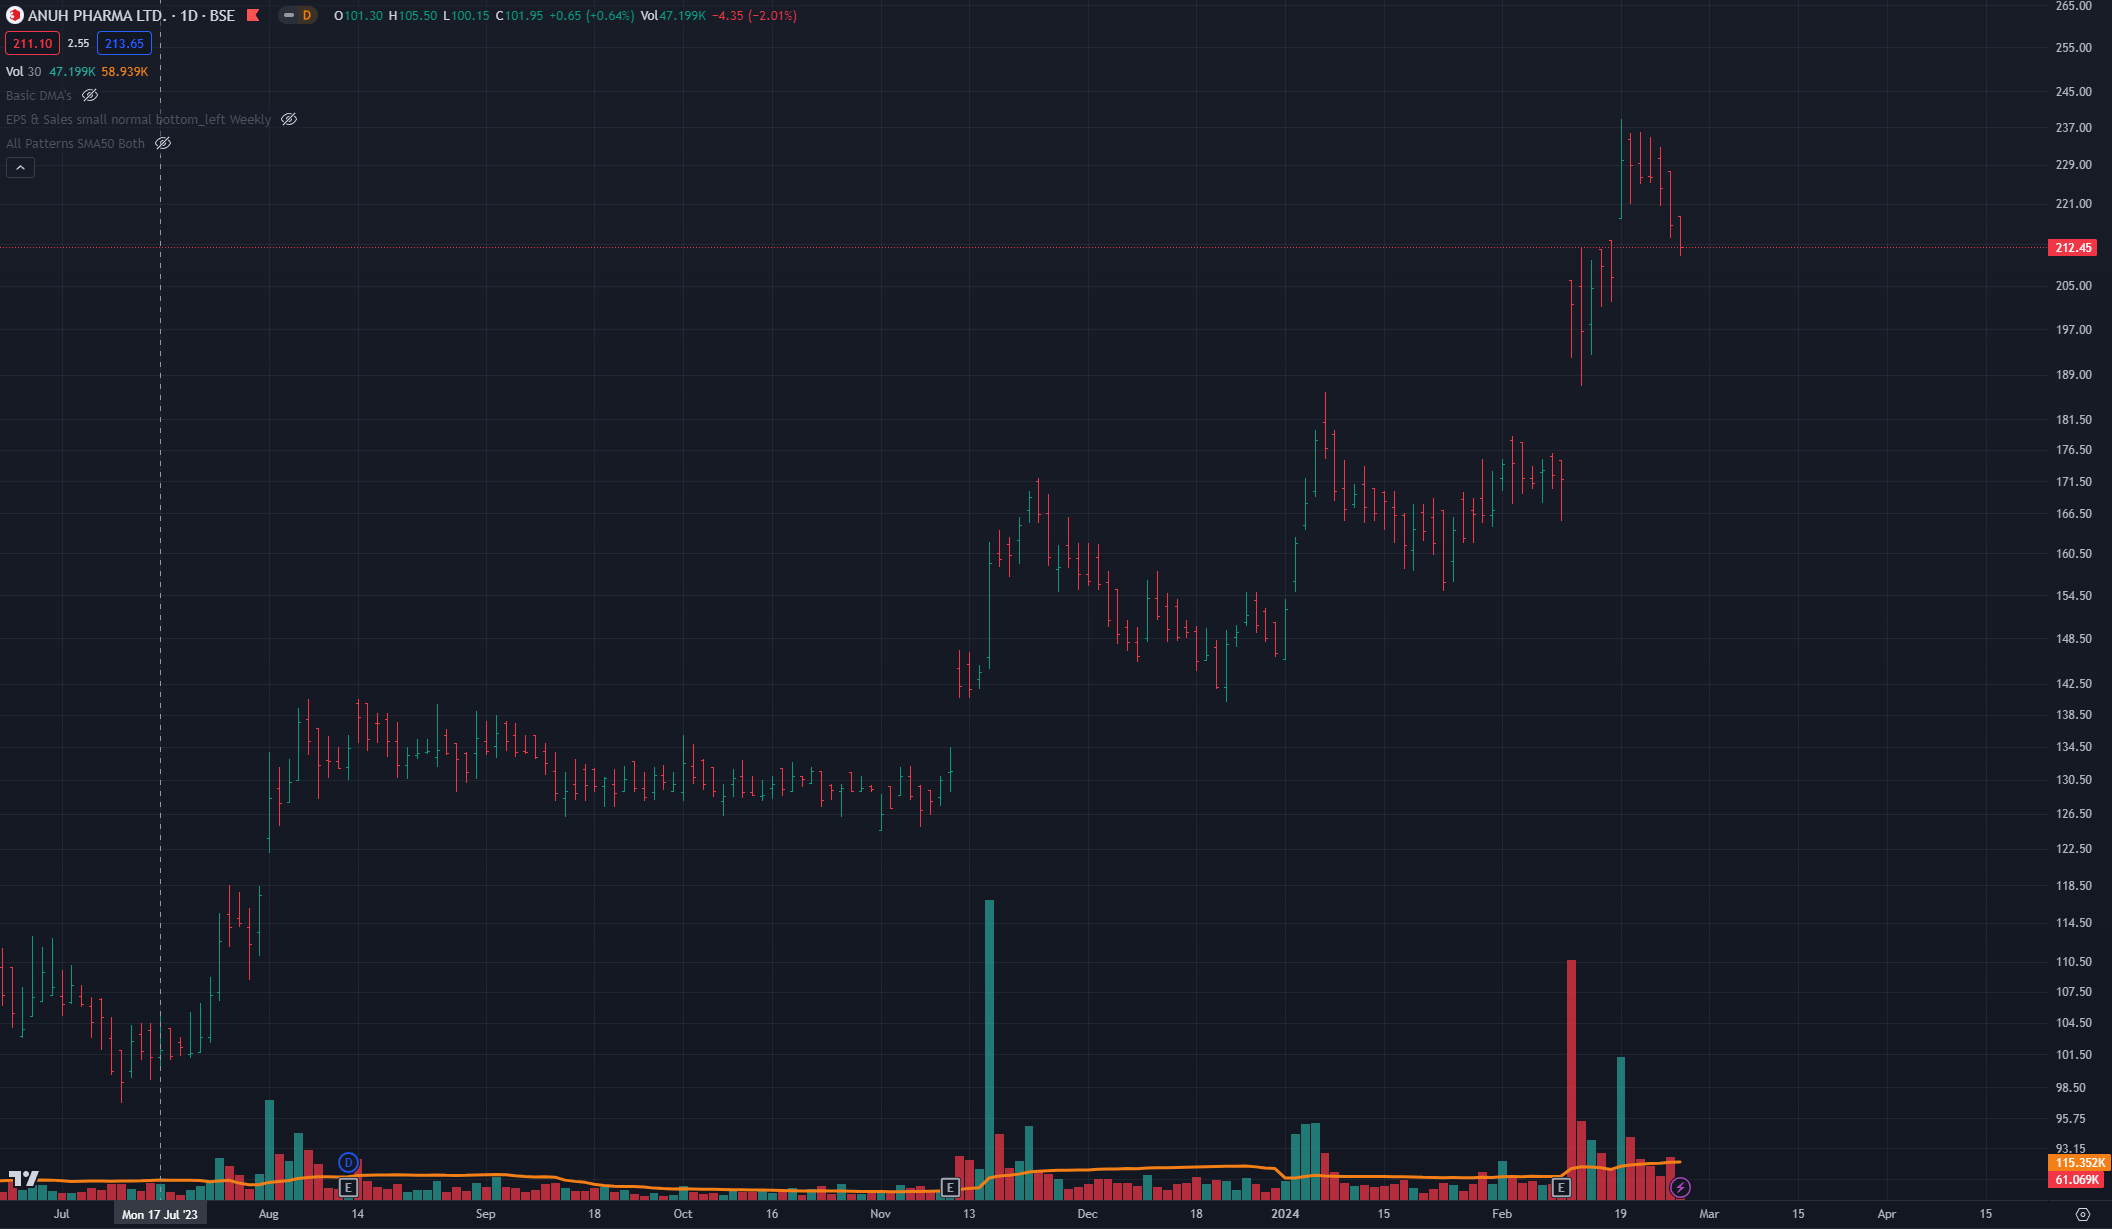
Daily chart - gap up after result + good volumes
The Q3FY24 concall summary
Weekly chart - Testing the long term resistance. company had guided for 16% CAGR for the next 5 years.
Daily chart - gap up after result + good volumes
The Q3FY24 concall summary