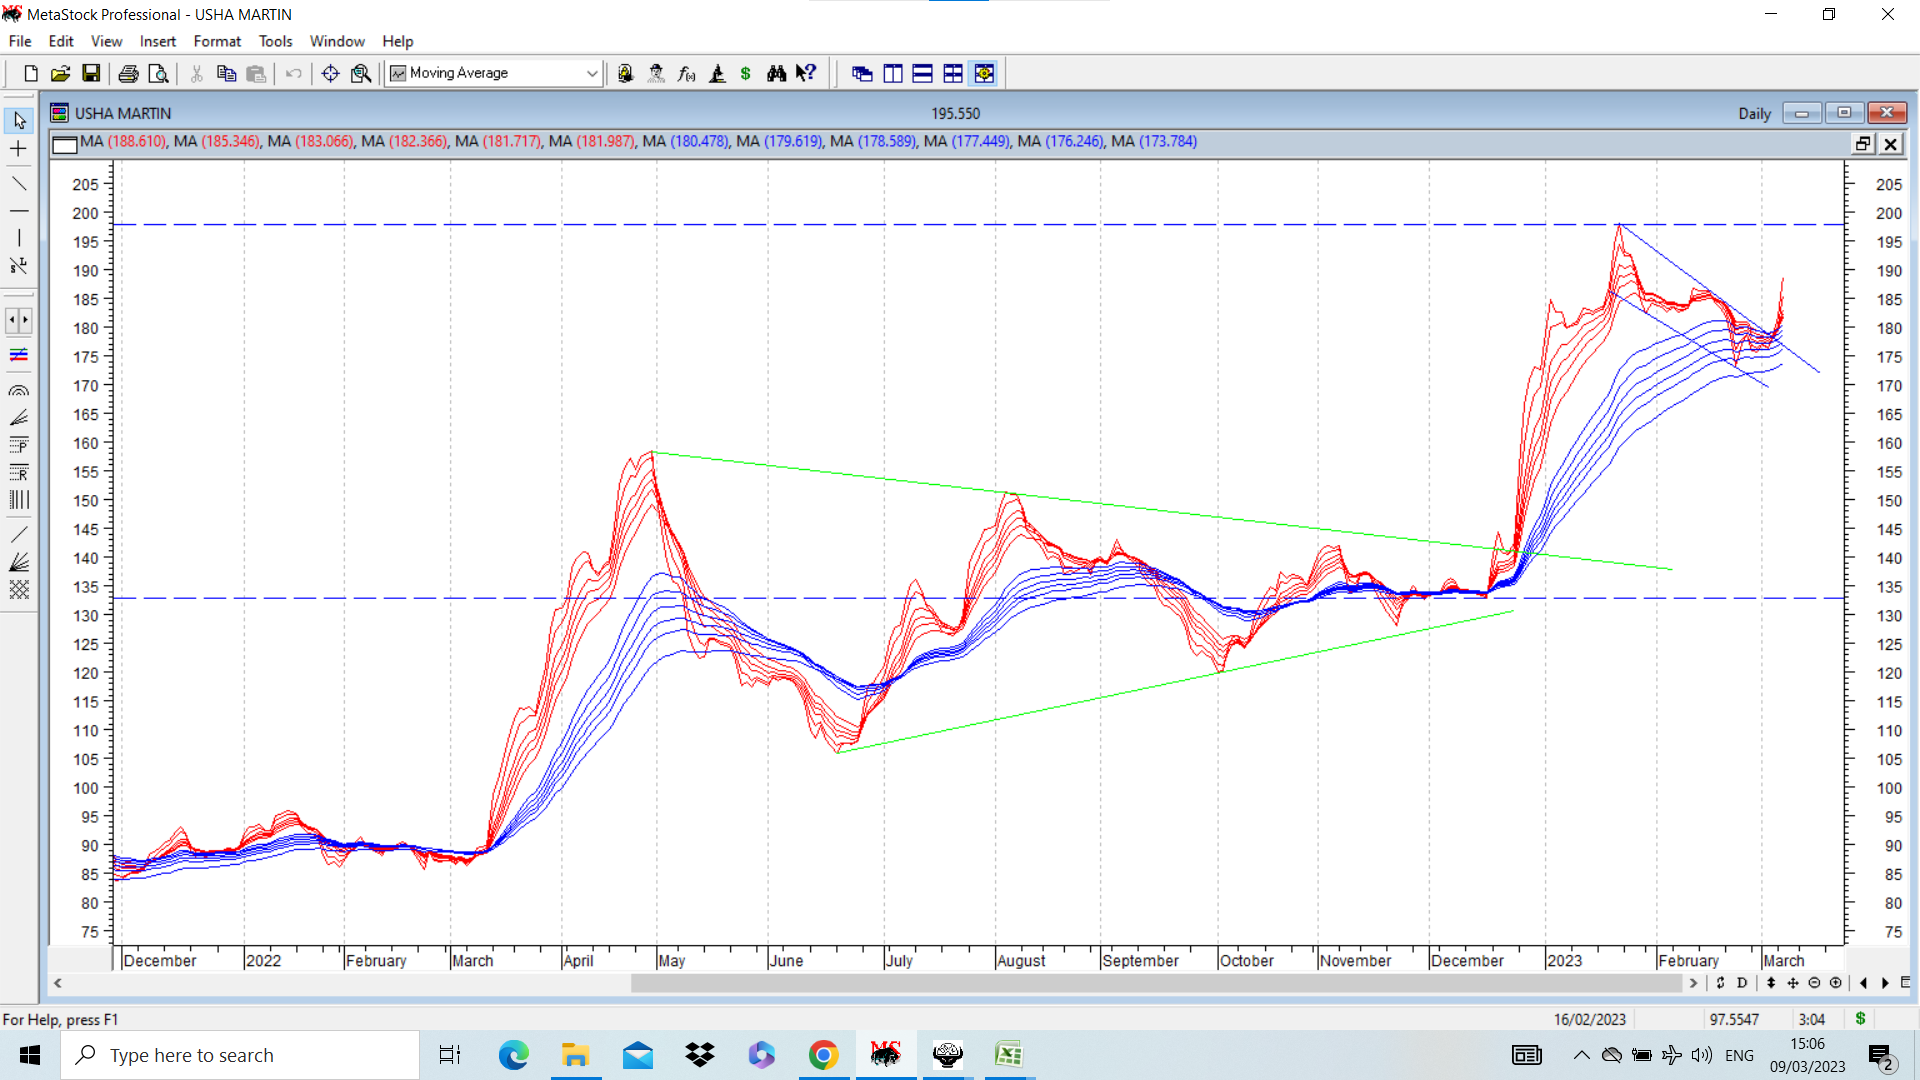
Usha martin daily GMMA chart attached. After breaking out from triangle enclosed by green lines, stock went up and underwent a sideways flag like consolidation (marked on chart) and broke out from that once it moved above 180. Further confirmation of strength on crossing previous high of 197 on GMMA chart and 209 on bar chart. According to the GMMA line chart, potential target if pattern plays out can be in range of 240-245 and according to bar chart targets can be around 255. disc: invested as mentioned before.