
@Yogesh_s Thanks a lot for your response . one more query regarding beekay steel , Why did you like Beekay steel over prakash industries and sunflag ?? .I think both beekay and prakash industries ROE and ROCE are same , Beekay steel has more debt than prakash industries and inventory days for prakash industries is less. Leverage ratio is also high for Beekay steel .
Thanks in advance 
1 Like
Prakash Industries and Sunflag are integrated steel producers while Beekay Steel is just a rolling mill. Risk-Reward characteristics of these companies is different because they will benefit differently at different stages of steel cycle.
Beekay’s ROE will be high for FY 18 as its utilization has improved in FY 18 and expected to remain elevated for FY 19 as well given traction in steel demand.
Disc: Invested in Beekay Steel.
3 Likes
Wasn’t Bhushan Steel also rolling mill. Do they really have high RoE biz model or it something special about Beekay
Bhushan Steel has rolling mills for rolling HR & CR Coils. It’s is a different ball game all together when compared to Beekay steel who are rolling primarily TMT Bars & Sections.
I would not be too bullish on Beekay Steel on fundamental basis as the product line which they are in is very competitive and lack of Moat in this business.
Disclosure: Not invested. Not Interested.
Bhushan Steel is an integrated steel plant so it has a rolling mill among other things.
1 Like
Caution: This post is heavy on statistics
Yesterday when Sensex hit new high while mid and small cap stocks remained in bear territory, I began to wonder if this is the first time such a thing has happened and what can be possible reasons behind it. Besides the reasons listed in my earlier post, I decided to use number crunching to see if there is any explanation.
Movement in stock indexes can be broadly explained by two factors, trend and shock. We know that stocks go up over long term and over the last 25 years Sensex has gone up at a CAGR of 12%. That’s the trend growth. But the journey hasn’t been in a straight line because market was hit with a series of shocks which caused Sensex to trade way below or way above the trend line. Over time, these shocks recede and market returns to trend level only to get hit with another set of shocks.
As investors we are interested in knowing if the market has gone too far away from trend as a result of these shocks. In other words, we are not interested in the trend growth (as it is predictable) but the shocks as these are unpredictable.
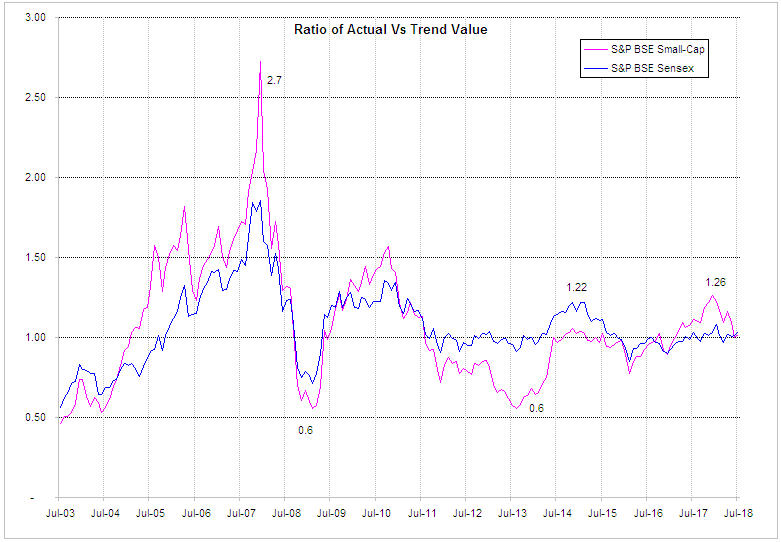
I used a statistical technique called Trend Stationary Time Series analysis to remove the trend component in Sensex so that the residual will represent purely the shock component. I then calculated the ratio of actual Sensex value and trend value to know the effect of shocks. I performed the same analysis for Small-Cap index. Chart below shows Actual / Trend lines for these two indices.
Source: BSE
A value of 1.22 means that Sensex is trading 22% above (+ve shocks has pushed the Sensex above trend) trend while a value of 0.6 means Sensex is trading 40% below the trend line due to -ve shocks.
As you can see in the chart above, Small-Cap index is significantly more volatile than Sensex. At the peak of 2008 bull market, it reached as high as 170% above trend. In 2013, the small cap index reached about 40% below trend almost as much as the trough reached in 2008 crisis. No wonder there were bargains in small cap stocks in 2012-13.
Sensex on the other hand has seen volatility drop by a huge margin since the 2008 crisis. Prior to that, index used to trade way above or way below trend, but in last 7 years, Sensex reached 22% above trend only once at the peak of 2014-15 Modi rally. Other than that is trending close to trend value i.e. neither going too much above the trend nor going too below trend.
In 2017, the euphoria in small and mid cap stocks pushed the small cap index (and Midcap index) to as high as 26% above trend while Sensex was trading withing +/- 5% of trend. Only time Smallcap index traded this high above trend was prior to 2011 when economic stimulus caused stocks to rebound from crisis low. As the euphoria receded, small caps went down in 2018 and now trading close to long term trend value. Since Sensex was always trading close to trend value in 2017 and 2018, there was no fall in Sensex.
Only other time, a similar move happened was towards the end of 2010 when small caps began to crack while Sensex was trending up. Although at that time both indices were way above the trend value so in 2011, both went down together. While Sensex stabilized around the trend line, momentum and liquidity squeeze carried the smallcaps further down to crisis level.
On the other hand, in 2015, Sensex went down more than small and mid cap stocks as large caps that were pushed higher in Modi rally returned to trend levels while mid and small caps were already trading trend level as they had barely recovered from 2013 liquidity squeeze.
Some of the factors that were at play (Fed taper, current account deficit, FII running away, rupee crashing) in 2013 are also at play in 2018. However momentum is not as strong so we may not see 2013 like valuations in 2018. even if we do get to that level, 2013 turned out to be a great time to pick small and mid caps and 2018 might as well.
56 Likes
Excellent dissection ! Are you using Matlab or equivalent for computation?
1 Like
Story of company in 40 Charts - Is this a google sheet?
Would you consider sharing ?
If already shared, please advise.
Thanks for such a useful information…
I used Excel for this analysis but Matlab will be easy as it has a builtin Detrend function.
2 Likes
It is not a Google Sheet. I use desktop version of Excel. I can’t share it as I can’t share the data from the corporate database. It is a single user licence. Almost the same data can be downloaded from Screener into Excel.
2 Likes
Hi Yogesh,
I really like this idea. I’ve been contemplating stopping my Mutual Fund SIPs and simply investing in a Nifty100 ETF. However, it’s always bothered me that buying a NIFTY ETF would force me to invest in companies Iwouldn’t touch otherwise. (Yes, MFs have the same problem).
I’ve now decided to start a smallcase (on Zerodha), selecting 20 companies from the Nifty 100 using a simiar logic to yours. There are a couple of questions I had:
- When you started we had no LTCGs. With the 10% LTCG tax have you changed your strategy of bootstrapping the portfolio every year?
- Although, I’d probably be creating a smalling and SIPing in it, which month do you bootstrap your portfolio?
Cheers,
Roy
I have always believed that large cap investing cannot give you outsized returns. Hence, when I recently came across this thread, I became curious to find out the actual returns earned by this strategy vs returns from Nifty and Large Cap MFs.
I compared the returns earned by the two model portolios of this thread with corresponding Nifty and Large Cap MF Returns. As the exact portfolio buy dates have not been provided, I assumed 31-Aug-2016 as the purchase date for the portfolio mentioned in the first thread and 31-Aug-2017 as the purchase (rebalancing) date for the portfolio mentioned in thread no 94.
Hence, the comparison period is from 31-Aug-2016 to 13-Jul-2018. The returns are total returns over the period (not annualized), excluding dividends. Following are the results:
Portfolio Return: 10%;
Nifty Return: 25%;
MF Large Cap: Average about 23% (Range from 12% to 35%).
Off course, the comparison period (slightly less than 2 years) is not adequate for arriving at any hard conclusions but the results have cemented my existing belief that MFs are the best way to invest in stock markets for people who neither have the inclination not time to analyze and invest directly in stocks.
Among the various MF Categories, Mid and Small Caps have outperformed Large Caps over long periods. For eg, over the 15-yr period ending 31-Dec-2017, while Mid & Small Cap MFs have multiplied the initial investment 30-fold, Large & Mid Cap MFs have only multiplied 19-fold. Pure Large Caps have done even worse.
There is no change in strategy due to LTCG. It will be beneficial to hold on to stocks as long as possible to delay paying LTCG but it will have to be paid eventually without any indexation benefit. Cost of holding on to overvalued stock or missing out on not buying another undervalued stock is much higher than benefit of delayed payment of LTCG.
I rebalance after all annual reports are in (around July-Aug) and I have time to go though them to make decision (Oct). NSE also re-balances Nifty 50 around March and Sept so I re-balance after that.
2 Likes
Can you please elaborate how you calculated 10% portfolio return?
Here is my calculation assuming the same purchase date and rebalancing date that you have assumed.
| Valuation Date | Portfolio Nav | Nifty 50 |
|---|---|---|
| 31-Aug-16 | 1,000 | 8,786 |
| 30-Sep-16 | 989 | 8,611 |
| 31-Oct-16 | 1,001 | 8,626 |
| 30-Nov-16 | 948 | 8,225 |
| 31-Dec-16 | 945 | 8,186 |
| 31-Jan-17 | 1,020 | 8,561 |
| 28-Feb-17 | 1,040 | 8,880 |
| 31-Mar-17 | 1,077 | 9,174 |
| 30-Apr-17 | 1,100 | 9,304 |
| 31-May-17 | 1,114 | 9,621 |
| 30-Jun-17 | 1,094 | 9,521 |
| 31-Jul-17 | 1,188 | 10,077 |
| 31-Aug-17 | 1,191 | 9,918 |
| 30-Sep-17 | 1,169 | 9,789 |
| 31-Oct-17 | 1,192 | 10,335 |
| 30-Nov-17 | 1,146 | 10,227 |
| 31-Dec-17 | 1,160 | 10,531 |
| 31-Jan-18 | 1,220 | 11,028 |
| 28-Feb-18 | 1,188 | 10,493 |
| 31-Mar-18 | 1,144 | 10,114 |
| 30-Apr-18 | 1,261 | 10,739 |
| 31-May-18 | 1,252 | 10,736 |
| 30-Jun-18 | 1,242 | 10,714 |
| 12-Jul-18 | 1,260 | 11,023 |
| Holding Period Return | 26% | 25% |
1 Like
| 31-Aug-2016 to 31-Aug-2017: | ||||
|---|---|---|---|---|
| Stock | Alloc | Init Value | Return | Final Value |
| BPCL | 8% | 8,00,000 | 32% | 10,53,600 |
| Coal India | 7% | 7,00,000 | -29% | 4,99,100 |
| Eicher Motors | 9% | 9,00,000 | 38% | 12,43,800 |
| HDFC | 16% | 16,00,000 | 26% | 20,20,800 |
| ITC | 8% | 8,00,000 | 9% | 8,68,000 |
| Lupin | 8% | 8,00,000 | -34% | 5,29,600 |
| Maruti Suzuki | 9% | 9,00,000 | 52% | 13,71,600 |
| Power Grid Corp | 8% | 8,00,000 | 19% | 9,49,600 |
| TCS | 10% | 10,00,000 | -1% | 9,94,000 |
| Yes Bank | 17% | 17,00,000 | 29% | 21,89,600 |
| Total | 100% | 1,00,00,000 | 1,17,19,700 | |
| Portfolio Return | 17% |
| 31-Aug-2017 to 13-Jul-2018: | ||||
|---|---|---|---|---|
| Stock | Alloc | Init Value | Return | Final Value |
| Aurobindo Pharma | 9% | 10,54,773 | -27% | 7,71,039 |
| Eicher Motors | 8% | 9,37,576 | -17% | 7,79,126 |
| ITC | 10% | 11,71,970 | -12% | 10,30,162 |
| Indiabulls HF | 12% | 14,06,364 | -4% | 13,47,297 |
| Infosys | 12% | 14,06,364 | -7% | 13,02,293 |
| Lupin | 9% | 10,54,773 | -13% | 9,16,598 |
| Power Grid Corp | 12% | 14,06,364 | -16% | 11,77,127 |
| TCS | 8% | 9,37,576 | 61% | 15,11,373 |
| UPL | 8% | 9,37,576 | -31% | 6,46,927 |
| Yes Bank | 12% | 14,06,364 | 7% | 15,03,403 |
| Total | 100% | 1,17,19,700 | 1,09,85,344 | |
| Portfolio Return | -6% |
| 31-Aug-2016 to 13-Jul-2018: | ||||
|---|---|---|---|---|
| Portfolio Return | 10% |
Please check your returns number for 31-Aug-2017 to 13-July-2018 period for Infosys, Eicher, ITC and Aurobindo. Returns in your calculations are less than actual returns on these stocks.
| Price As on 31 Aug 2017 | Price As on 12 July 2018 | Return | |
|---|---|---|---|
| Eicher Motors | 31,404 | 28,020 | -11% |
| ITC | 282 | 277 | -2% |
| Infosys | 915 | 1,295 | 41% |
| Aurobindo Pharma | 725 | 606 | -16% |
Source: BSE
These are just price returns. My NAV calculations are as of July 12 2018 and include dividends.
I have incorporated the corrections suggested by you and have re-checked rest of the figures as well. Following are the revised calculations:
| 31-Aug-2016 to 31-Aug-2017: | ||||
|---|---|---|---|---|
| Stock | Alloc | Init Value | Return | Final Value |
| BPCL | 8% | 8,00,000 | 32% | 10,53,600 |
| Coal India | 7% | 7,00,000 | -29% | 4,99,100 |
| Eicher Motors | 9% | 9,00,000 | 38% | 12,43,800 |
| HDFC | 16% | 16,00,000 | 26% | 20,20,800 |
| ITC | 8% | 8,00,000 | 9% | 8,68,000 |
| Lupin | 8% | 8,00,000 | -34% | 5,29,600 |
| Maruti Suzuki | 9% | 9,00,000 | 52% | 13,71,600 |
| Power Grid Corp | 8% | 8,00,000 | 19% | 9,49,600 |
| TCS | 10% | 10,00,000 | -1% | 9,94,000 |
| Yes Bank | 17% | 17,00,000 | 29% | 21,89,600 |
| Total | 100% | 1,00,00,000 | 1,17,19,700 | |
| Portfolio Return | 17% |
| 31-Aug-2017 to 13-Jul-2018: | ||||
|---|---|---|---|---|
| Stock | Alloc | Init Value | Return | Final Value |
| Aurobindo Pharma | 9% | 10,54,773 | -17% | 8,75,462 |
| Eicher Motors | 8% | 9,37,576 | -12% | 8,25,067 |
| ITC | 10% | 11,71,970 | -4% | 11,25,091 |
| Indiabulls HF | 12% | 14,06,364 | -7% | 13,07,919 |
| Infosys | 12% | 14,06,364 | 44% | 20,25,164 |
| Lupin | 9% | 10,54,773 | -12% | 9,28,200 |
| Power Grid Corp | 12% | 14,06,364 | -17% | 11,67,282 |
| TCS | 8% | 9,37,576 | 59% | 14,90,746 |
| UPL | 8% | 9,37,576 | -32% | 6,37,552 |
| Yes Bank | 12% | 14,06,364 | 7% | 15,03,403 |
| Total | 100% | 1,17,19,700 | 1,18,85,885 | |
| Portfolio Return | 1% |
| 31-Aug-2016 to 13-Jul-2018: | |||||
|---|---|---|---|---|---|
| Portfolio Return | 19% | ||||
| Nifty | 25% | ||||
| MF Large Cap | 23% | (12% - 35%) |
The above calculations do not include dividends. Dividends will add a few % points to the portfolio returns, but then you need to add Nifty Div Yield to the Nifty returns as well for an apple to apple comparison. Hence there won’t be much change in the relative performance.
As can be clearly seen from above, both the Nifty and an Average Large Cap MF have outperformed the portfolio over the 2-year period considered. The only point I want to make here is that there can be no low maintenance direct stock investment strategy. You either go the whole hog and invest considerable time and energy in stock selection, or simply invest in MFs and chill 
11 Likes
Thank you Yogesh.
You are just Great… Sharing your wisdom and the investing style of yours is just great…
Creating our own portfolio and seeing how it works is interesting and exciting unlike boring Mutual funds…
You are great in Finance stocks…
Hats off to you…
2 Likes
Yogesh ji, could you please elaborate how do you calculate returns inclusive of dividends, etc. ? Apologies for a basic question, and if it is there on the site, kindly point me to it. Thanks for all the inputs and thoughts you shared !!