Yogesh's blue chip 10 Portfolio

Indicator is now at 20 for Smallcaps.

Just 20% of stocks above 200 DMA and 10 of the 20 stocks above 200 DMA are barely above and could go under in just a day or two if the carnage continues getting it down to 10%. The worst exodus might be over though but got to be watchful.

13 Likes

@Yogesh_s
I liked the way you are screening the stocksā€¦but in your portfolio I have missed the stocks like piramal enterprises which has given 30% cagr for several years and still compoundingā€¦
My question is have you found any red flag in Piramal or something is missing in your screening method or have you just missed it?
Not posting details of Piramal ent as thread is already available on VP

This is just a diffusion indicator used to identify turning points in market cycle. I deploy cash to buy stocks in my watchlist but look at the Nifty100 index because it is diversified and consists of most liquid stocks so it is appropriate for such an indicator.

To a good extent I look at the numbers and ignore the noise.I think it will be difficult for a large bank to fudge the numbers for so long especially when it is being scrutinized by multiple auditors including RBI. If bank is disbursing loans at a higher rate every year, it must be able to do so because it is able to recover the old ones right? RBI also conducted not just one but 2 asset quality reviews followed by risk based assessment and Yes has reported divergences. I will take it as a worst case scenario and it does not look so bad.

If you can find such indicator please let me know as well. :slight_smile: When investors begin to ignore the bad news and drive stocks higher even on a hint of good news, thatā€™s an indicator for me that all bad news is priced in although it can be a false start initially.

RBI has some data (http://dbie.rbi.org.in/DBIE/dbie.rbi?site=statistics) but otherwise, you will have to compile this information yourself for individual banks.

No idea on VASA but @kaustubhkale may be able to help on this one. Havenā€™t tracked One Point One since IPO. My IPO notes are here.

Good call. But indicator for smallcaps is not so reliable as the Nifty100 indicator. Even that can trigger a false buy early in a bear market and a false sell early in a bull market. So I will be very selective in buying at this time.

I did miss Piramal few years ago as my screener is not designed for companies that are undergoing some restructuring. This is more suitable to stable and growing companies that are not changing tracks too many times. Havenā€™t spent lot of time looking at Piramal though so no red flags.

8 Likes

I tried to backtest this indicator on CNX500. Worked well for last few years. However Pre 2005ā€¦most of the time it showed 90%+ figures but market continued to perform. Similarly in 2008-2009 it didnt give any meaningful indication and same case with 2014 upswing. I think it works in medium to low volatility environment. Would like to know your findings for the same.

3 Likes

Did you use historical members of CNX500 for your analysis? Using current members for calculating indicator more than few years ago will lead to incorrect results as many of the current members would not be part of the index few years ago.

you are right about your observations. This indicator gives early buy signal at the beginning of a bear market and an early sell signal at the beginning of a bull market. Such signals should be ignored. As a rule of thumb, bull markets last anywhere from 2 to 5 years and at the end market is trading well above previous high. Similarly, a bear market lasts anywhere from 8 to 18 months and generally results in losses in excess of 20%. So until we get there, I ignore this indicator or use with caution.

Here is a sheet covering historical values going back to 2003 of the indicator using historical members of Nifty 100 Index.

Nifty100 Tech Indicator.xls (415 KB)

Chart below shows the indicator levels for last 5 years.

image
Source: Authorā€™s calculations using data from NSE.

image
Source: NSE.

As the charts show, indicator was well above 80 in 2014 and 2017 and market continue to rise. However, in 2013 and 2016, indicator correctly called out the bottom.

In early 2015, indicator started to move lower while market was creeping higher. This is typical in end of bull market as investor begin to focus on index heavyweights (which are highly liquid and easy to get out) while rest of pack begins to correct. I think something similar is happening now. In 2017, indicator was hovering around the high watermark but only occasionally crossed it, no wonder market always felt overvalued throughout the year. Market was in the overbought zone just before demonetization so reaction was swift.

statistically correct way to judge the effectiveness of the indicator will be to calculate forward returns realized when indicator was flashing a warning sign. By this measure, investors would have realized average 1 Yr forward returns of 40% when indicator was trading below 20% and a 1 yr forward return of 18% when indicator was trading above 80%. This shows that the indicator is more effective in calling bottoms than tops.

Since markets generally move higher in the long term, this indicator is more useful to spot end of bear market than end of bull markets. you are also right about volatility. In highly volatile markets, more and more stocks are likely to trade far above or below the 200 DMA so you can use 250 or 300 DMA for calculating the indicator or use 10-90 as the thresholds of turning points. Similarly, in low volatility markets you can use 30-70 as the thresholds. I donā€™t use all these adjustments as I use this indicator just to get a sense where market is in the bull-bear cycle and not put my asset allocation on auto-pilot.

16 Likes

@ramanhp yes I do track Vasa. I like the company and am invested.

Hi @Yogesh_s, appreciate your views on current market conditionsā€¦Are you accumulating mid/small caps or SMEs?

Thanks

Small & Midcaps are correcting because liquidity is drying up for following reasons

  • US Fed is raising interest rates and shrinking balance sheet size. Other major central banks like ECB and BOJ are following or will soon follow US Fed. Taper is no longer a tantrum. FII money is leaving emerging markets. Carry trade is finally winding up. This money will not come back.

  • RBI is raising interest rates because rupee has started falling. This makes FDs more attractive wrt to equities. Some capital is being reallocated to FDs.

  • Many mutual funds were mis-sold to first time equity investors who do not understand equity risk. They are now getting a taste of that and some of them are saying FD sahi hai.

  • LTCG makes equities less attractive wrt other asset classes so some reallocation is happening or likely to happen. Since expected returns on equities have dropped due to tax, prices have to drop to bring expected return back up to match required return. FIIs donā€™t have this issue as they invest through tax havens so large caps are less impacted by LTCG.

  • With the benefit of hindsight, investors have realized that in 2017, small and mid caps became frothy and so far only froth has cleared as many stocks are trading at mid 2017 levels. Hangover from 2017 rally is gone, investors are sober now and are just waking up. Some of them are hoarding cash causing liquidity to dry up.

  • RBI is bringing many banks under PCR. This is causing credit squeeze and that is hurting many leveraged small caps. This would result in their borrowing costs to go up.

  • Demon and GST have had a temporary but significant impact on some sectors.

  • Domestic investors tend to mix politics with investing so upcoming elections is causing investors to adapt wait and watch approach. Markets are only concerned about a majority govt or a coalition government irrespective of the party.

Some positives I see

  • Earnings growth is still strong.

  • GDP growth is strong and picking up.

  • Bank balance sheets are being cleaned up. NCLT cases are reaching a resolution stage.

  • Valuations are back to normal but not cheap.

  • In spite of rate rise by Fed, liquidity is still strong. Fed is not going to cause a bear market to contain inflation expectations. Thatā€™s one lesson they learned from 2008 crisis. Greenpsan put is still on the table. However Fed is more concerned about US markets and a sell off in emerging markets will be least of its worries.

  • Trump tax cuts is offsetting some of the monetary tightening by Fed. US economy and markets will continue to grow for some time. this will limit money flowing out of EMs. On the other hand Fed may end up tightening more than what it would have done otherwise.

  • Expected returns on equities is still better than FDs.

I am accumulating select small and mid caps but only when they are hitting new 2018 low. There will be plenty of opportunity to do so for another 6 months so not in a hurry.

58 Likes

@@Yogesh_s Thanks for your detailed reply. I agree with your points - very well narrated.
Which are the select small / mid caps you are keeping a watch for buying? Really appreciate your thoughts processā€¦

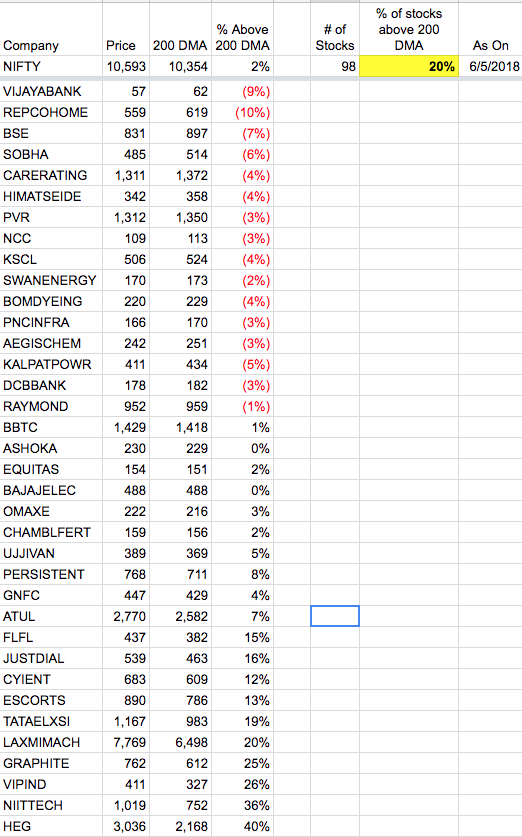
As I explained in my previous post, my watchlist is often huge and in a market like this where price are very volatile, many companies bubble up as their prices drop close to fair value level.

All VP favorites are on my watchlist. Here at VP, we have done a good job at finding strong companies but a poor job of assigning a fair value to them. So whenever their prices prices fall, they automatically become good buy candidates

VP Favorites

Avanti Feeds
PI Industries
Mayur Uniquoters
Can Fin Homes

Few others that I am interested or already own

Nitin Spinners
Caplin Point Lab
NGL Finechem
RKEC Projects
PSP Projects
Beekay Steel
Yes Bank
Indiabulls Housing
Salasar Techno

Following list contains good companies that I can consider if price drop further

NOCIL
Apollo Pipes
ICICI Securities
N R Agarwal Industries
Wim Plast
Maithan Alloys
Advanced Enzyme
CSL Finance
Shalibhadra Finance
Aarti Industries
Multibase India
Bhansali Engineering
Ultramarine & Pigments
Kajaria, Cera
Valiant Organics
Eris Life
Atul Auto
Kothari Fermentation

Few companies are on earnings watch to see if there will be headwinds ahead

Ajanta Pharma
Motilal Oswal Financial Services
APL Apollo Tubes
Nesco

There are the ones that are off the top of my head. Many are in the attractive-at-lower-price category. I havenā€™t listed many good companies whose price is so high that I donā€™t expect these stocks to even come down to my comfort level. Something that market see that I donā€™t. These will remain good businesses but bad investments for me.

There are 3 broad criteria here:

  1. Large opportunity size
  2. Good Management
  3. Fair valuation.

You can never get all 3 except for a a brief period at the bottom of a bear market. You can wait for that (if you have that much patience, it will be hugely rewarding) or you can compromise on one of the criteria.
I never compromise on management quality because as such determining management quality is difficult so even when we are careful there will be mistakes. Plus, you canā€™t put a price on a bad management and discount it in the price. I sometimes compromise on opportunity size if there is good value. Such picks becomes short term (6 months to 1 year) value plays while price catches up with value. There havenā€™t been many opportunities here since Fed flooded markets with liquidity post 2008 crisis. Since that is ebbing now, there may by some opportunities. Finally, I end up compromising on fair value if I get excited about opportunity size and management quality. Having some extra cash will help here because in a bear market that criteria will be met as well so you can load up.

Disc: Not a SEBI registered adviser. Not a buy sell recommendation. Do you own due diligence.

76 Likes

Thanks Yogesh for sharing your list. Its interesting that you feel valiant is bit expensive.

Hi Yogesh,
Thanks for sharing knowledge.
I have a basic question. What are the various sources of inputs and criterias you consider to decide on the management quality?

Regards,
Saurabh

2 Likes

Thanks for your valuable reply! @yogesh_s
Is it possible for you to mention what buying range would you be looking at ā€˜VP favouritesā€™ and other ā€˜good companiesā€™ in your list above? Of course I completely understand this is not a buy recommendation but would really help other looking at these stocks. Each investor has a different approach to value the companiesā€¦

My buy range is when price falls below fair value. Its that simple. the difficult part is finding fair value. My valuation model is described here. I use it extensively to get an estimate of fair value. Calculation depends on how well one understands the business so everyone will have a different notion of fair value.

Fair value is dynamic. It depends on earnings, risk premium, interest rates, growth rates, news flow etc. There is always something that will change every day. Some events will have larger impact than others. On an average, I think these stocks are still overvalued so a 20% drop from here will be a good low-risk entry point. It does not mean I expect these stocks to drop 20% from here. It only means if a stock 20% from these levels, risk of loss of capital will be low buying at that price. A stock gets into this list if I am willing (and able) to buy more of a stock if it drops 20% due to valuation reason. If a stock will appear overvalued even after a 20% drop then its too overvalued to be shortlisted.

If you have track shrimp prices, whoā€™s selling stake, custom duties, production in China etc (factors that companies themselves cannot control), then it means stocks are priced to perfection and investors are on the edge of their seat. Investing in such a situation mean expected return will be average (approximately 10-12% for a basket of stocks). Investors werenā€™t worried about these factors when stocks were selling at single digit PE ratios few years ago.

IMO, buying right company is more important that paying the right price as long as you are not paying an exorbitantly high price. I think its not too difficult to tell if the price is too high. you donā€™t need a complex valuation model for that.

13 Likes

Tracking management quality is difficult. Numbers tell you half the story. But since this is an important aspect of investing so canā€™t ignore it. I use following criteria / numbers.

  1. Return on equity - Efficient management will generate an ROE of 20% or more consistently. Less than 15% is low and more than 25% is excellent. A high but falling ROE is worse than a low but rising ROE.
  2. Leverage - Management should be able to generate good ROE without using too much leverage. A high leverage means that returns are coming at the cost of increased risk that has not materialized yet. Less than 2 is good for non-financial companies. It is also important to see if leverage is by choice or by compulsion. If a company is generating free cashflow, then it has a choice of repaying debt, reinvest in gross block or pay dividend/buyback shares. All three will benefit shareholders. It it chooses to keep the debt and has enough stable cashflow to service it, then its not a problem. If the company has debt because its cashflow is too low, then its a red flag. In this case, at least ratio of gross block to debt should be rising as that would mean at least some growth is coming from internal accruals so over time debt will not explode. Stable cashflow and high margin is must for highly leveraged companies.
  3. Return on assets - This is the return that management has generated before financial leverage kicks in. double digit ROA is good (for non-financial companies). More than 20% is great.
  4. Gross Margin - A high gross margin means company is adding value. Low margin generally leads to low ROA and high leverage. more than 50% is great. Less than 30% is too low.
  5. Cashflow - A good management should be able to convert sales into cash else it will get into debt trap. Efficient working capital management is important (receivable days, inventory days) to maintain cashflow. Cash profits should be close to PAT on a rolling 3 year basis.
  6. Information disclosure - Management should clearly disclose important operational metrics (capacity, production, order book, disbursements etc) at least annually preferably in annual reports. If I have to dig out the information from conf call transcripts, press releases etc, then it is difficult to build conviction. Companies that do not disclose this information are generally more volatile than those that disclose it. Companies often talk a lot about macro factors but fail to give vital information about their own companies. Too many glossy pages in annual reports or too many slides in IR presentation is a distraction and a red flag to me. It does not take more than 4-5 pages to communicate performance of a company.
  7. Money coming out of the company - A good management will not hoard cash. It will pay taxes, dividends, buyback shares, repay debt etc. If the company is only taking in cash but it is not coming out then its a red flag to me.
  8. Executive compensation. - This should not be too high but should not be too low as well. For really small companies this tends to be an issue as absolute compensation appears to be a high % of PAT. If there is a lot of gap in compensation of promoter directors and other senior managers, then company is likely to be a one man show. Growth in compensation should be in sync with growth in dividends. Exercise price of ESOP should be close to market price on issue date.
  9. Growth in dividends - Typically dividends should grow at the rate of PAT.
  10. Debt and liquid investments together on the balance sheet is a concern to me unless there is enough justification for it.
  11. Persistently low PE, PB ratios is a red flag to me. Markets can be noisy in short term but in long term it figures out management quality pretty well. If a company is trading at a deep discount for a number of years then earnings are not driving the stock but management quality is. I prefer to stay away unless there is a good reason for it.
  12. Credit rating, cost of debt and accounts payable should be within normal ranges. If the company is rated then it should be at least BBB. Cost of debt should be not too high, 8-12% is normal range. Anything more means creditors are considering the company to be risky. Accounts payable is a good indicator. If vendors are not offering credit, it reflects badly on management as these are first in line in a liquidation.
  13. Assets in emerging markets or tax havens - Unless a company is a predominantly in export oriented industry (IT, Pharma etc) having lot of fixed assets in poor countries in Asia or Africa is a red flag to me especially if it is a small company. Having a sales, office, customer service center, warehouse etc is fine but having manufacturing facilities or other fixed assets in countries with capital controls is a red flag to me. There are many good companies with overseas assets so this is not a general rule but too many times I have seen these overseas fixed assets is nothing more than a money laundering / siphoning schemes.
  14. Common pursuits - This is another difficult to find issue. If promoter or its immediate family has a similar line of business as the listed company, there can be conflict of interests.
  15. Complex corporate structure is also a no-no especially when company is small and has only few lines of business. If majority of business is coming from subsidiaries, its not good. I prefer majority business to come from parent company. companies that disclose consolidated statement only annually when a large business comes from subsidiaries is a re flag. Construction companies are a good example. they have subsidiaries that are loss making with heavy debt that operate projects on a BOT basis but information about these subs is disclosed only annually.

these are just few points at the top my my head. Often the visual screener I explained here will help me spot a pattern of a good or bad company. No company will meet all the criteria above but its the combination of several factors that ring a bell.

71 Likes

Yogesh, Thanks a lot for your response. It was quite helpful. regards, Saurabh

Amongst the others outlined, this one is a good point as there are several cos that have this tendency to hoard cash for years without paying out or doing buybacks. This often points to a business which has run of out opportunites and this directly impacts the valuation in a negative way. Several IT cos which otherwise have good margins are very stingy with cash and non cash distributions. Not only IT, newspapers, tyres, auto etc all have such cos

1 Like

@Yogesh_s any change in exclusive blue chip Portfolio. What is its structure as of now (Enterprising and Defensive)
Thank you for sharing generously.

1 Like

@Yogesh_s Regarding Nitin Spinners ,Can you please explain why they have a huge d/e ratio ? are you comfortable with the their high debt ?

@rskothari
Low maintenance portfolio is re balanced annually towards end of the year so no changes since the last update in Dec 2017.

@Bikram11206178
Textile companies are leveraged as return on assets is low. they also get interest rate subsidy from government so they borrow just to take advantage of that and pass on the benefits to customers so leverage is high across the industry while return on assets is low.

A high leverage is OK if cashflow is good enough to service it. Also most of the leverage is used to build fixed assets and not to fund working capital. Ratio of fixed assets to debt is rising which means at least some of the fixed assets are funded with internal accrual. This is an indication that cash flow is large enough to service debt, fund working capital and part of capex. Cost of debt for Nitin is 6% and expected to remain low due to subsidy. I also look at interest cover to see if leverage is helping or hurting equity. A rising interest cover means leverage is helping. Anything more than 5 is acceptable. Return on capital is also higher than weighted average cost of capital so there is some value added. And finally they raised some equity earlier this year to bring down the leverage.

7 Likes