
Would it be able to index annual reports.
For instance, Black rose makes polyacrylamide and its there in their annual report. If annual reports were indexed it would bring up the paragraph mentioning polyacrylamide in blackrose annual report
Not all companies give all products on p&l but most single product companies do.
Yes we are indexing annual reports, but currently have not enabled key word search. Working on opening this out. Will keep you posted.
1 Like
Thanks Karthik: )
And we have recently added a features page to showcase some of the core features available on Tijori:
3 Likes
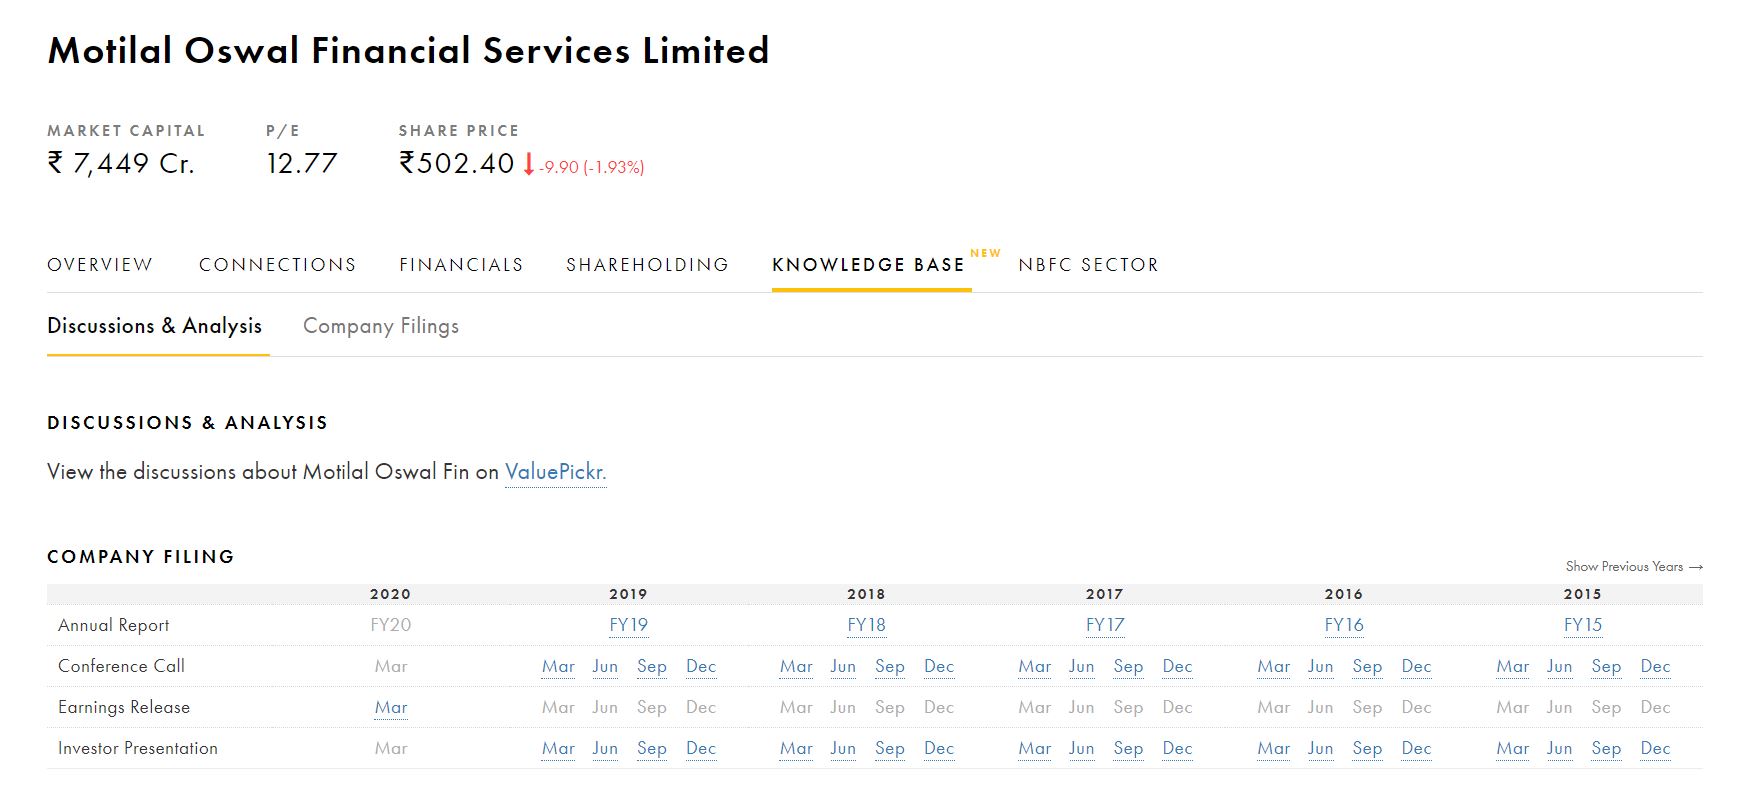
New Feature Update: Knowledge Base
We are trying to compile a knowledge base for investors to go even deeper.
Here all the key company filings such as annual reports, investor presentations, conference calls, earning release etc. would be compiled in a single place. This is still WIP & will be improved in the coming months.
12 Likes
Hi, Really good and useful site…Would be great if you can add
- Client list of each company
- Raw materials used by the company
You can only add what is available somewhere digitally
If you know where to find this info then it’s easy to add
Do you know where this is available ?
Hey Kiran,
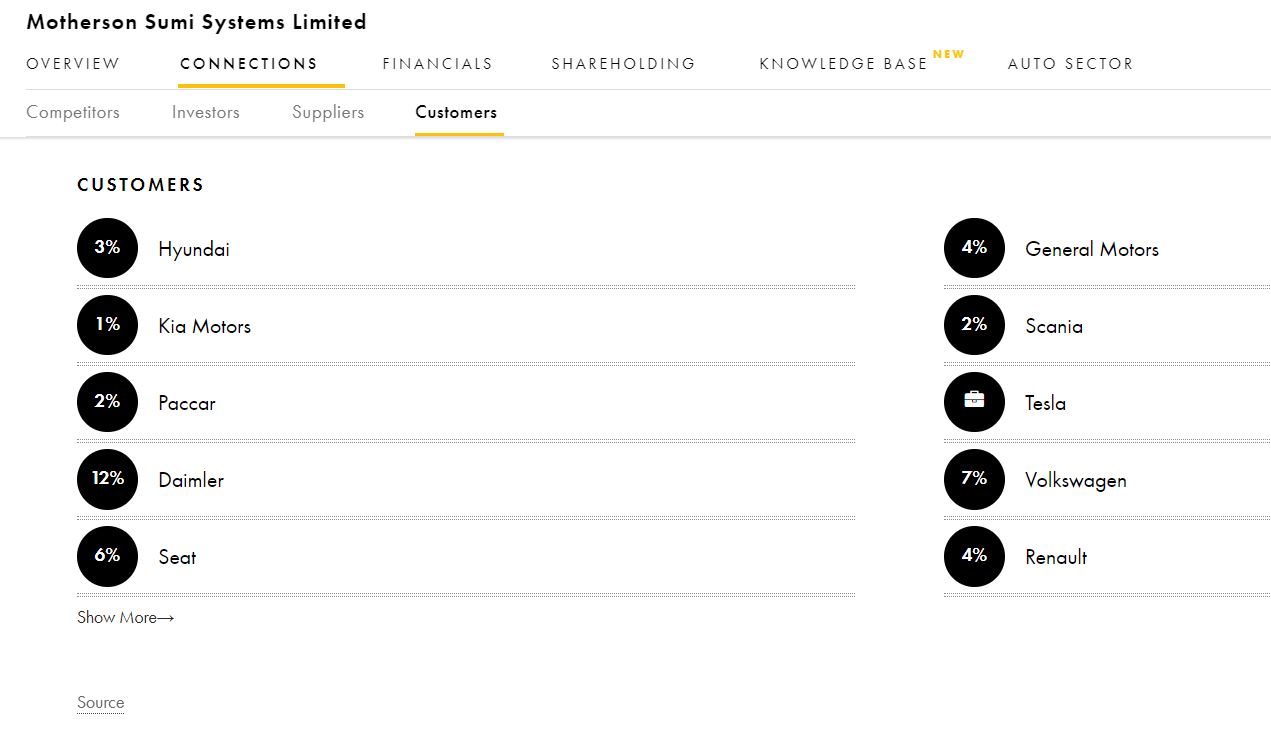
- Yes we display the list of suppliers / customers where available in the connections tab.
- Raw Materials - Yes we have indexed the list of major raw materials used by companies (where available). This info is not displayed on the Tijori website yet, will work on this soon.
5 Likes
Feature Update: Macro Indicators - India
We’ve covered some key macro indicators in addition to the one’s usually reported such as:
- FMCG Volumes
- Personal Loan Outstanding
- Country wide Tractor sales
- GDP, Inflation, Core Industry Production etc.
Do let us know if we missed any important one’s.

3 Likes
Hi @Sidhegde
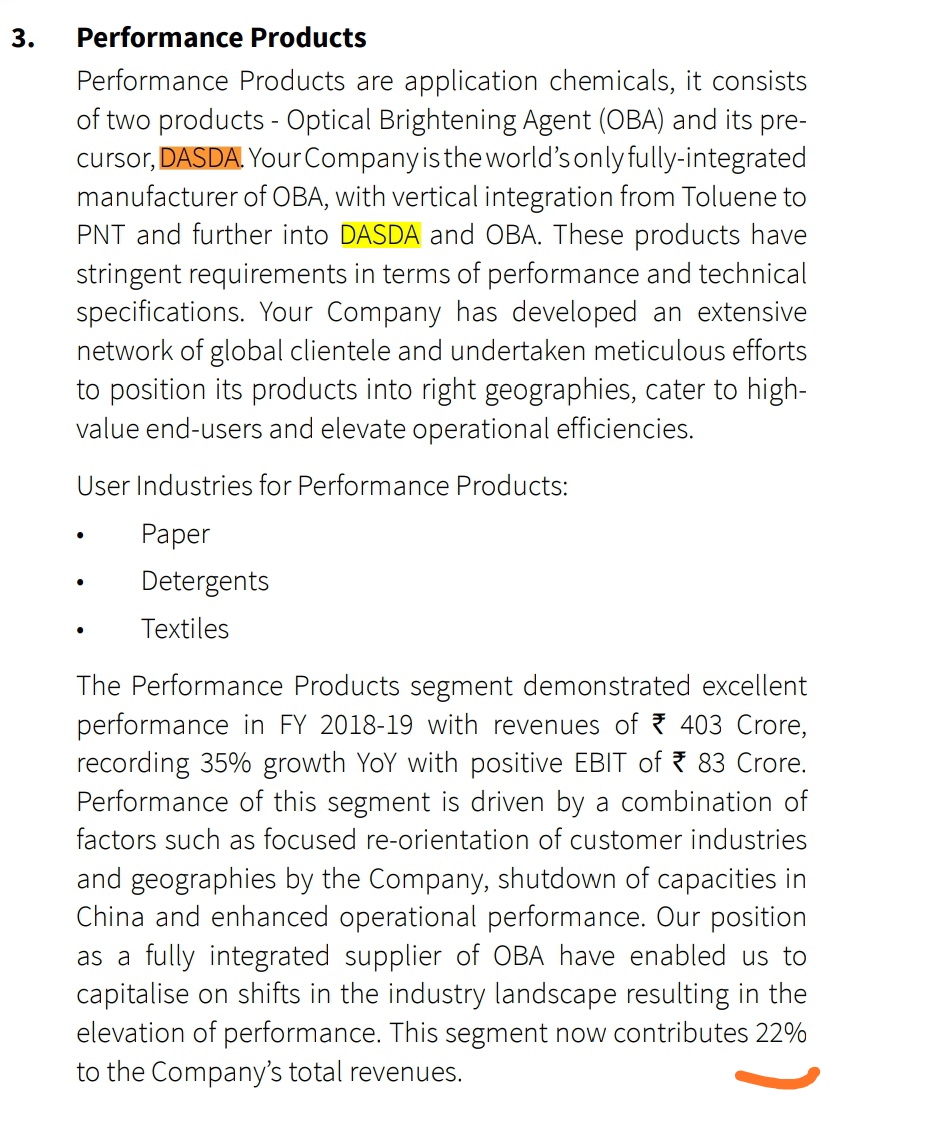
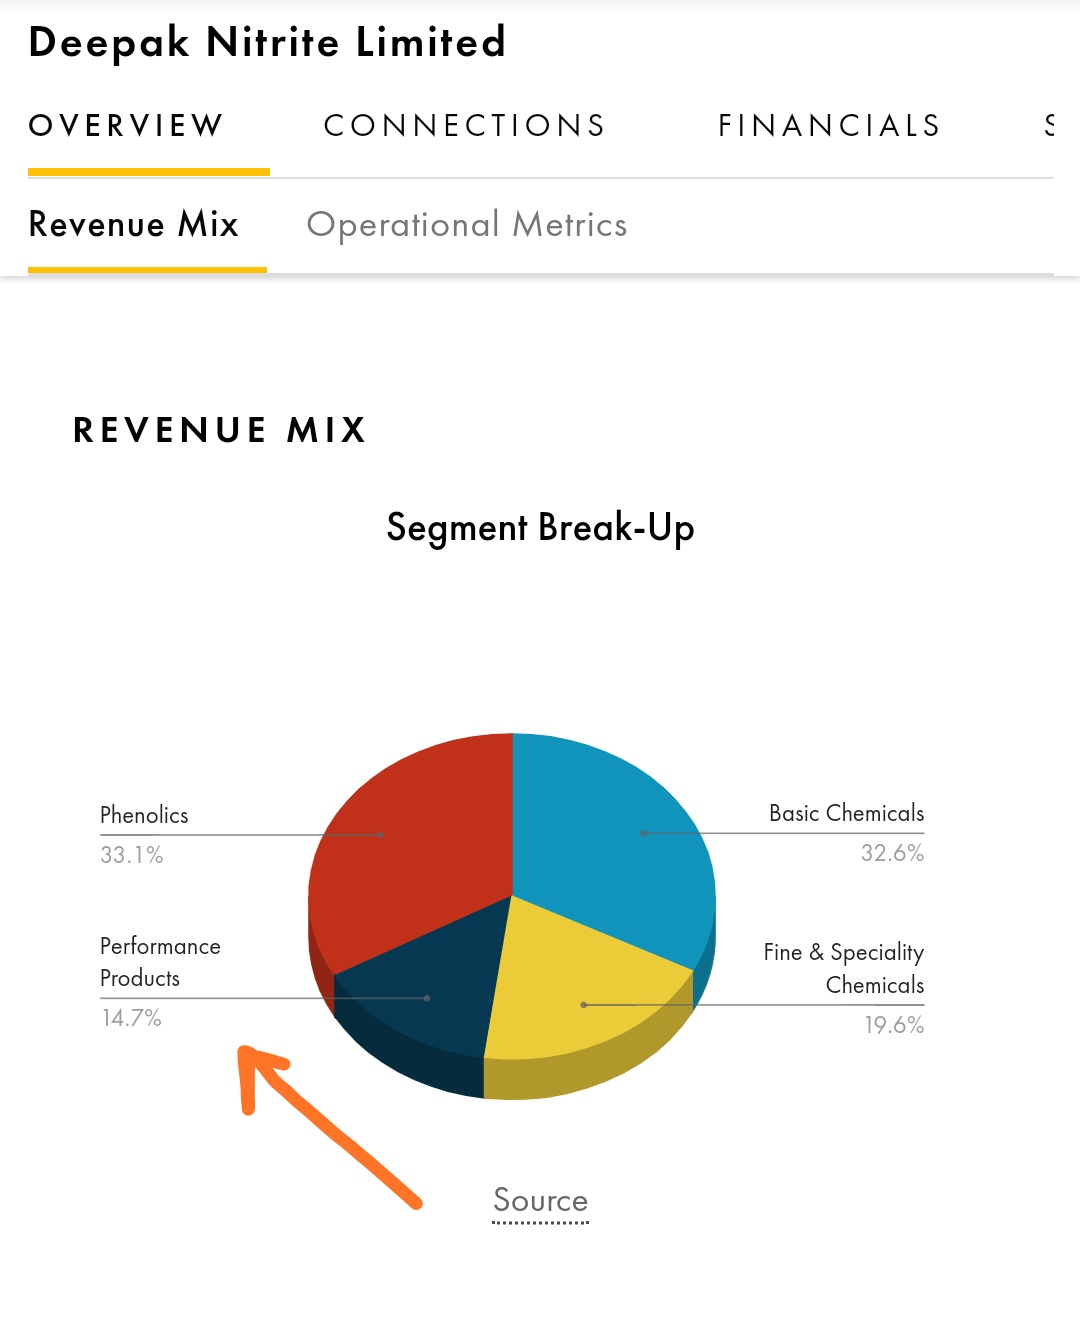
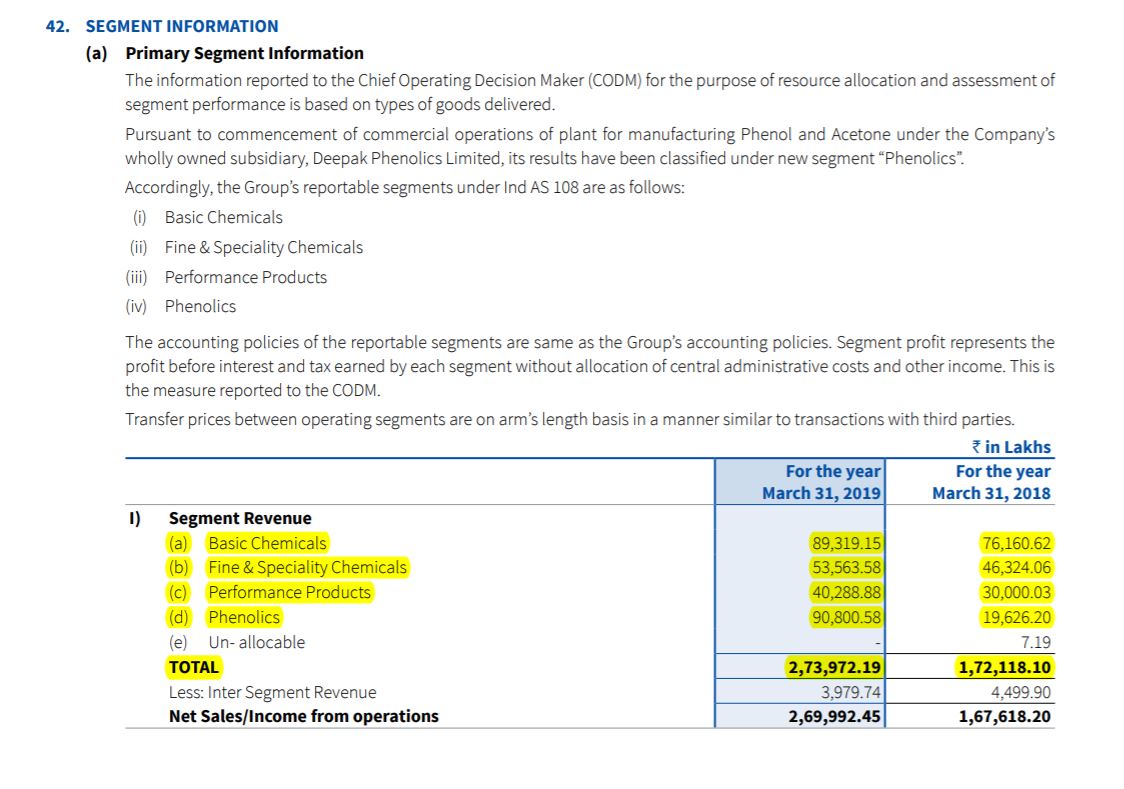
For Deepak nitrate , Revenue mix for performance product is shown as 14 percent and in annual report 2019 it shows as 22 percent .
Hi Devaraj,
Thanks for raising any data disparity you’ve come across, however we’ve also derived our data from the 2019 AR (pg 238).
There the company mentions that they get ~403 Cr from performance products & the overall company revenue is ~2740 Cr. From these 2 points we derived the % rev from performance is 14%.
You could view this filing by clicking the source button below any the charts / data points shown on Tijori.
4 Likes
Hi @Sidhegde, I was looking at Mold-tek Packaging’s Consolidated Balance Sheet on Tijori, and found it to be inconsistent with the Annual Report. For eg. Total Assets of 355cr for FY19 vs. 368cr on Tijori. Can you please check? Thanks!
Hey, thanks for notifying. Let me check & get back to you on this
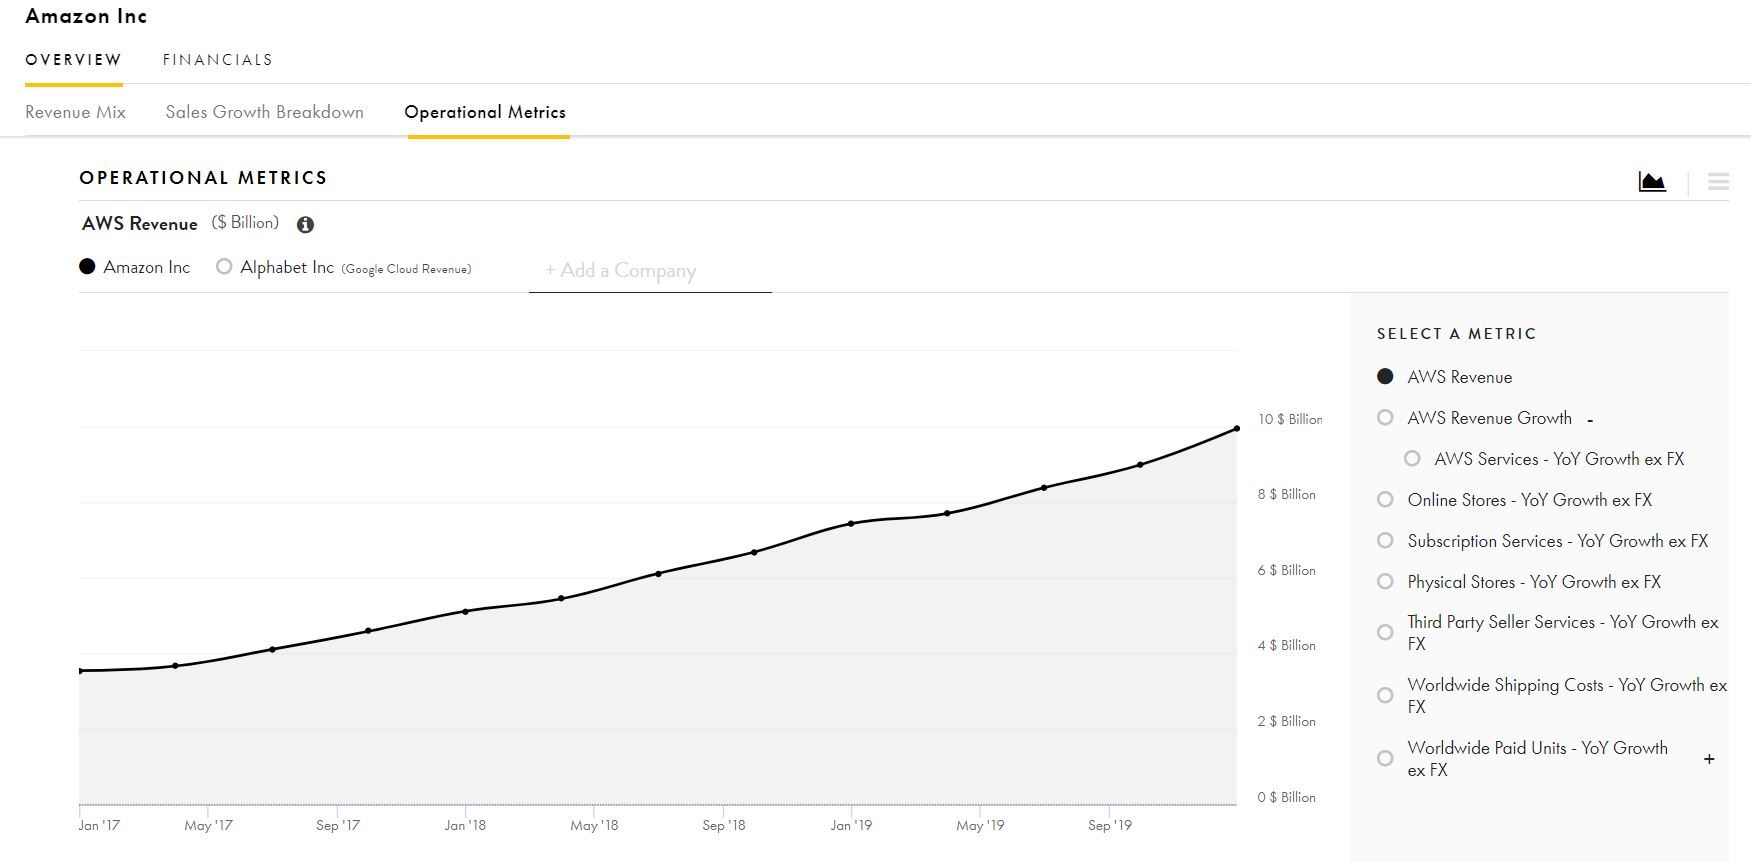
New Product Update: Tijori USA
We’ve just rolled out the 1st version of Tijori USA currently covering S&P 500 companies only. The features now available on the site include:
- Revenue Mix
- Sales Growth Break-Down
- Operational Metrics
https://tijorifinance.com/us/company/AMZN
Revenue Mix

Operational Metrics
Will be adding increasing the coverage & adding more features in the coming months. Please do share any feedback / improvement points
11 Likes
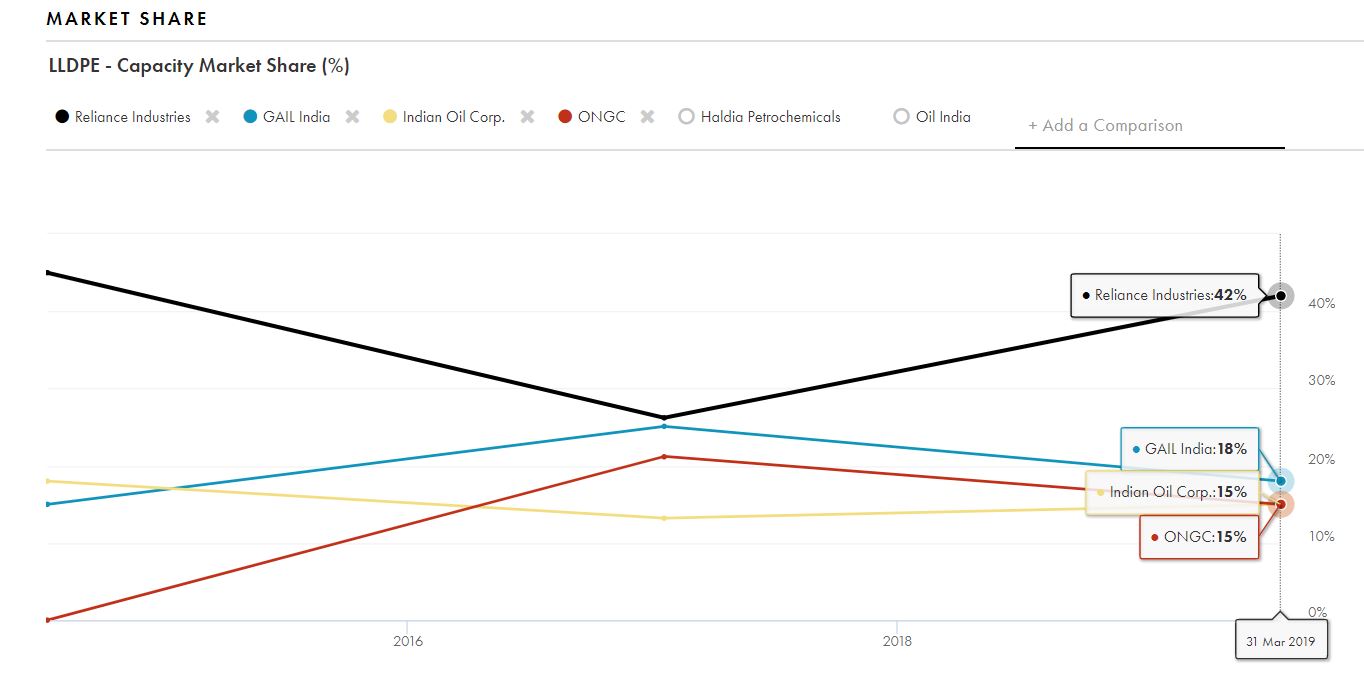
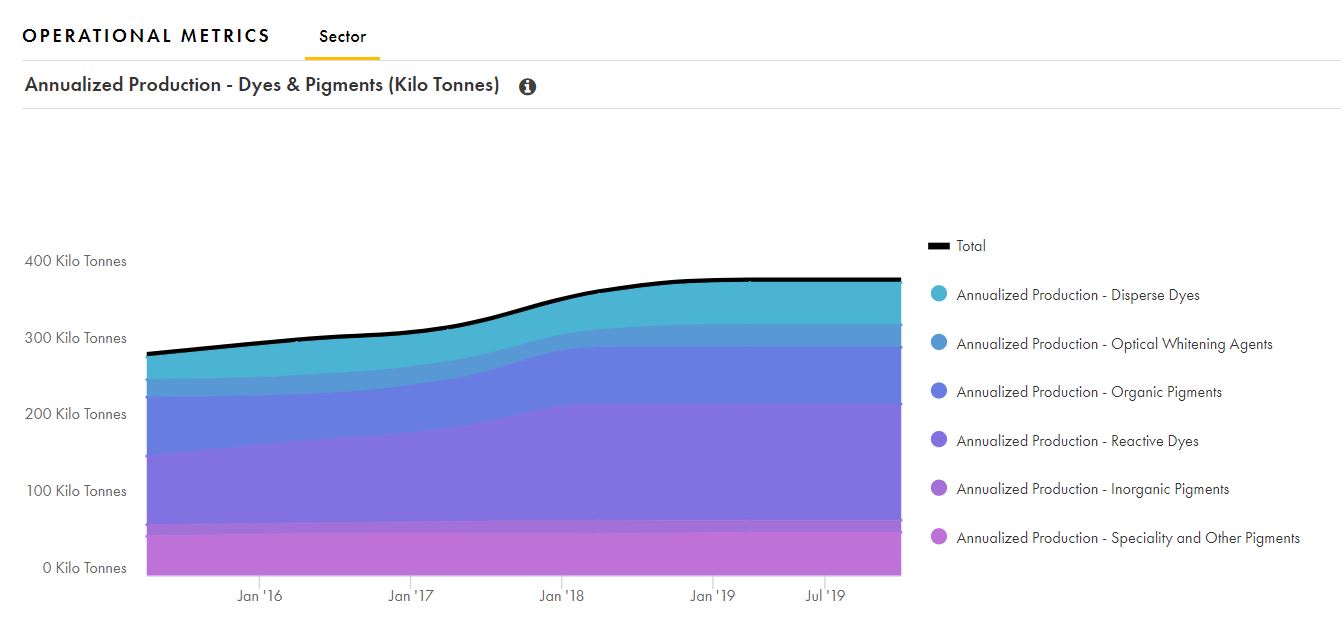
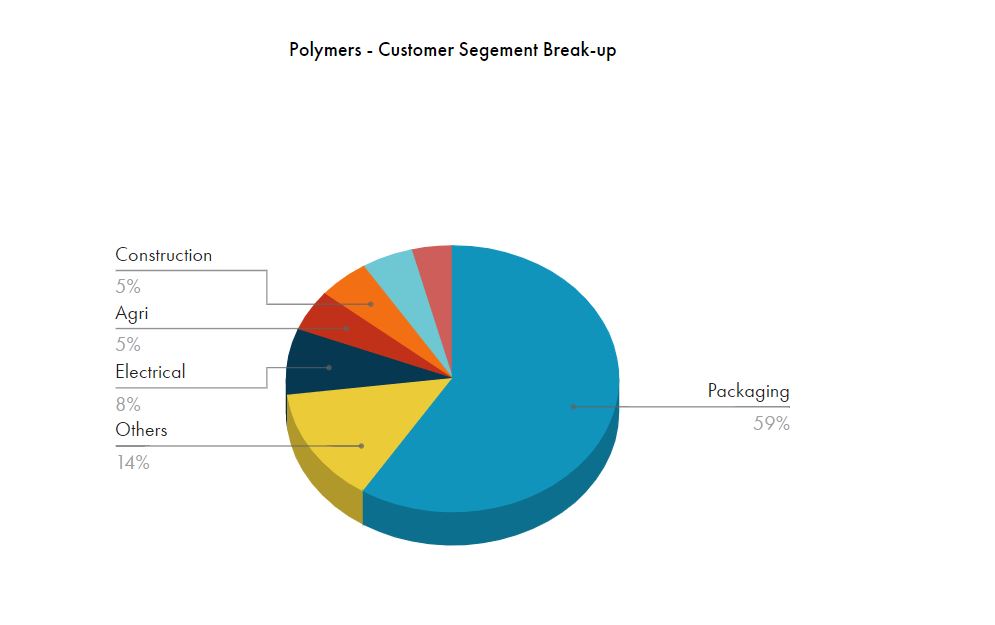
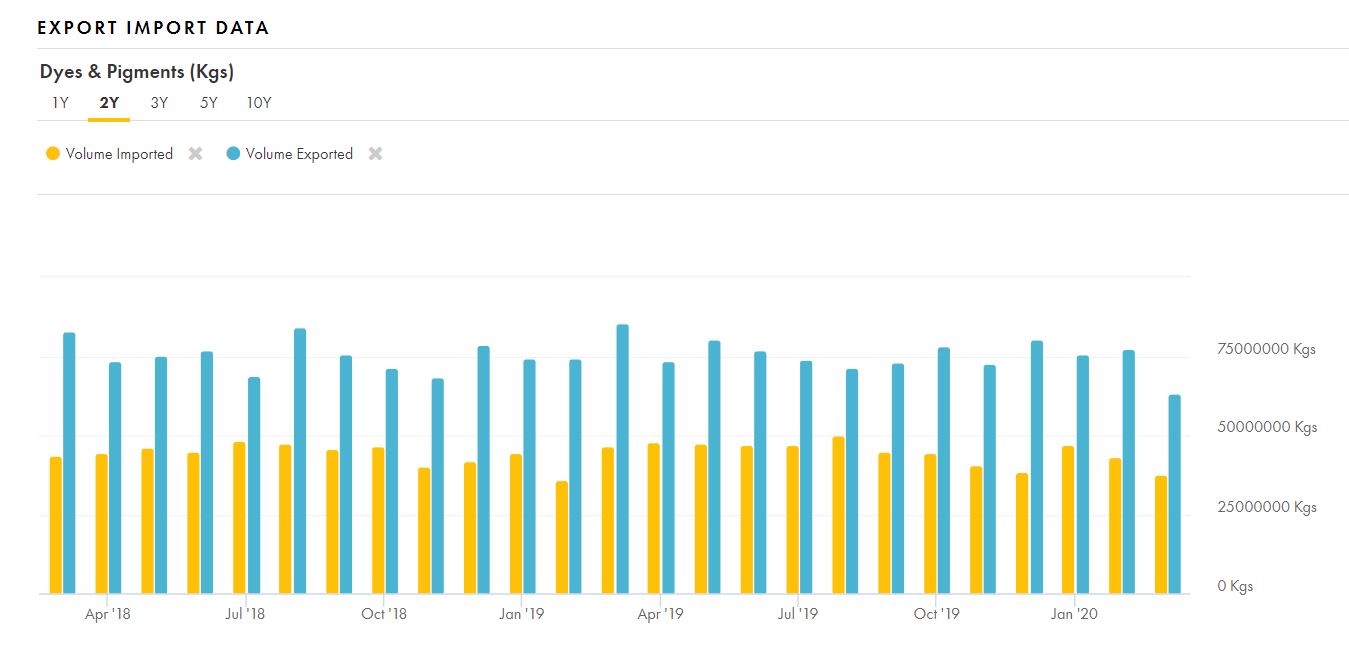
Chemical Sector Analysis
Just released the 1st draft of the chemical sector by extracting data from multiple sources, the key areas covered include:
- Capacity Market Share
- Chemical Wise - Domestic Production Figures
- Chemical Wise - Customer Segments
- Export Import Data
Do check it our & pl let us know if there are any other aspects we should try & cover.
2 Likes
How can in Tijori website - we can know when was any particular field was last updated.
Whereever there is source link it is easy to find from the linked source date.
But where there is no source how can we get that information. For eg. Tech Mahindra market share is 3%. But how old is this info?
Hey Saurabh - yes very valid point. Will include a time stamp on all data points in market share & revenue break-downs so its clear when this was last updated.
Also Tech Mahindra market share was updated as per last year’s filings.
2 Likes
Hi
There is no data on SBI cards and credit card industry.
It will be helpful if you add and it’s good that there is new section of us markets. It will add further value if u add global peers with Indian comapnies 
Hi,
For Sandur Manganese:
https://tijorifinance.com/company/sandur-manganese-iron-ores-limited
- I see market cap as 0
- cant see critical graphs
- Cant see sources for some numbers.
Can you please take a look?
Hey Sahil,
Thanks for flagging this - will get this corrected soon.
1 Like