The following points are noted from Skippers Ltd FY 21 Q2 result and investor presentation:
Skippers Ltd Q2 shows sign of recovery post FY 21Q1 which was marred by COVID. The company reported higher revenue both on YoY and QoQ. EBITA was 11.8% of revenue ( which includes forex gain of 13.8 Cr.), so operating EBITA is 8.4 %( operating EBITA is less than YoY quarter) which according to company is on account of inventory damages and losses booked (One time) due to lockdown/Amphan Cyclone and COVID related restrications. PAT is approx.12.4 Cr.( YoY same qtr 1.4 Cr. and in last quarter it was -12 Cr.). Revenue saw growth in all three segments. Total Order book stands at 3265 Cr. as on Sept 2020, while bidding pipeline is Rs. 4650 Cr. ( almost 2/3 is international). As per them T&Dare picking up and they target to grow export 50% of revenue in next 2 years. They expect EBITA margin to stabilise to approx. 11-12% for rest of year. They have largest tower monopole and tower testing in India and even one of the largest abroad. They have reduced debt by 22.9 Cr. in comparison to March 2020. ( Now total debt stands at Rs. 430Cr.). They have reduced short term debt and increased long term debt. Debt to equity ratio stands at 0.63 in comparion to 0.66 Cr. in March 2020. Net working capital days improved from 128 days to 95 days.
The following is my inference and I may be wrong also:
There is increase in Cash flow from Operations, which has helped them discharging the debt. There is substantial decrease in trade receivables ( from 438 Cr. to 388 Cr. during March 2020 and Sept 2020).
The company is aggressively persuing oversea projects where margin is better and domestic T&D activities are also gaining momentum.
Company is weathering COVID issue in better manner and not compromising margins for sake of growth. Although, growth in Sept Qtr is quite good.
Still management stake is 71.89% which certainly inspires confidence.
Decreasing short term debt is a positive sign, which may further bring down cost of borrowing.
Since, the stock remained a wealth destroyer over last years, so valuation will depend upon timely execution of projects, winning new bids, further reducing trade receivables and reducing debt.
Disclosure: Invested from higher levels and no transaction made within last 30 days.
kippers Ltd published FY21 results on 04.05.2021. Results appears to average but there is reduction in gross debt level from 453.7 Cr to 438.5 Cr ( D/E marginally improved from 0.66 to 0.62) and Finance Cost reduced from 84.7 Cr to 72.3 Cr). If one removes the tax adjustment Rs 23 Cr from FY 20, then PAT for both years is nearly same at 21 Cr., but at the same time this year there is forex gain of 27 Cr. ,so there is not much improvement. No significant change in Operating Margin. Annual Turn over is stagnant for last 4 years. But following points can be seen:
1.Strong performance of polymer division ( 59% YoY increase in revenue)
2. Order book of Approx. Rs 1600 Cr. , which gives revenue visibility and contains 33% export orders, so reducing the orders book position on Power grid and SEBs. Bidding Pipelines of Rs 3800Cr.
3. There is increase in input cost which may dent there margins further ( presently OPM is approx. 9% for year)
4. There is approx. 283 Cr increase in trade payables, which is very huge and at the same time 33 Cr. increase in trade receivables. There is Rs. 109 Cr in inventory and Rs. 14 Cr. increase in cash as per balance sheet. It appears there major money is stuck in inventories.
5. Cash Flow from Operations is Rs 208 Cr. v Rs. 214 Cr in FY 20.
6. So,overall still company is struggling to come out of wood and increasing its reliance on polymer business, trying to get capture oversee markets. The effects of efforts may be seen in medium to long term.
Disclosure: Invested from higher levels and no transaction made within 1 month.
There are many related party transactions. Security Deposits Paid by Skippers Ltd towards Skipper Polypipes Pvt Ltd Skipper Realties Ltd.,Skipper Telelink Limited. Although related party transactions are not new and appearing in past ARs also.
Inventory in FY 21 is approx Rs 601 Cr. against approx. Rs. 492 Cr in FY 20.
Trade receivables in FY 21 is approx. Rs. 471 Cr. against Rs. 438 Cr in FY 20.
Trade payables increases in FY 21 to Rs. 652 Cr against 371 Cr. in previous FY
However, there is improvement in company’s position in June 21 Qtr. Order inflow in June Qtr is Rs. 453 Cr., totalling 1940 Cr. ( strong revenue visibility for next year). Company is bullish in expectation of riding on export order, profitable and expanding polymer division, productivity on pre-covid level.
Going ahead execution is the key and to see how company is able to control Working Capital.
Disclosure: Invested and no transaction in last 30 days.
The commodity prices seem to have done them in. The increase in short-term debt seems a bit worrying (must be monitored). The order books seems to have grown nicely. If they can get margins back in a few quarters and also reduce debt, I think this stock can get back to previous levels.
As per Skipper Ltd the profitability impacted due to unprecedented commodity price rally in Key raw material items (i.e Steel & Zinc) and higher ocean freight rates & Container unavailability adversely impacted profitability of Engineering segment business.
Finance Cost increased to Rs. 25 Cr in this quarter wrt Rs. 17 Cr YoY. Total debt increases to Rs. 628 Cr. in Sept 2021 from Rs. 438 Cr in Mar 2021. The main reason appears the rise of inventory to astronomically to Rs. 738 Cr. As per management ‘deliberately held high level of RM inventory so that a large portion of fixed type contracts get covered through the same which resulted into higher working capital utilisation’ . Due to money stuck in working capital the OCF is negative Rs 117 Cr in comparison to positive RS. 118 Cr YoY. So, the debt of company is increasing.
Trade receivables are marginally down comparison to March 2021 ( Rs. 454 Cr. v Rs 472 Cr.) and trade payable are also marginally down in comparison to March 2021 ( 609 Cr v 657 Cr.).
Order inflow in this quarter is approx Rs 500 Cr. and inflow continues to be strong. There is strong order visibility on domestic and international front.
Over all execution is the key and it is not clear how much percentage of order book contains fixed rates and how much contains price escalation clause. Very high inventory is also cause of concern.
Disclosure: Invested and did not make any transaction in last 30 days.
Skipper - Inching towards coming out of wood/ At inflexion point
Year
Turnover (Cr.)
EBITA (Cr.)
PAT (Cr.)
OPM %
Inventory(Cr.)
Trade Receivable (Cr.)
Trade Paybale (Cr.)
Borrowings (Cr.)
Cash Flow from Operations (Cr.)
2015
1310
228
89
17
228
376
242
383
174
2016
1501
227
95
15
250
372
212
468
65
2017
1665
273
124
16
368
372
289
436
176
2018
2074
305
118
15
562
516
490
496
80
2019
1871
182
43
10
535
494
351
523
134
2020
1391
140
41
10
492
438
374
454
214
2021
1582
145
21
9
601
472
657
439
209
2022
1707
164
25
10
786
786
626
568
17
From above table ( data is taken from screener) following is noted:
There is degrowth in sales of company on last 5 years, decline in OPM ( from 15% to 10%) and PAT.
During the past years there is significant hike in inventory, trable receible and trade payble. Due to this WC problem, comapny is making borrowing which is all time high and operating cash flow is all time low.
During the time from 2018, when orders from Powergrid/ SEB dried up, comapny had to explore other low margin avenues and over the period of time company entered in international market for which performance is yet to be seen. Meanwhile, comapny faced tough condition in last 2 years due to raw material/ COVID related issues.( EBITA margin quater March 2022, is 11.2% which provide some hope that management is walking the talk). At present there is pressure on raw material front due to Russia -Ukraine war.
Company in its presentation has mentioned that increase boworing is due to logistic issues ( unavailability of containers, port congestion etc.). They have also mentioned that high invenstory is mitigate commodity price risk on secured contracts; Prices of key raw materials have gone up by over 30-40% during last quarter on account of Geo political issues, leading to increased working capital utilisation.
Total ordder book as on March 2022 is 2115 Cr, which provides some revenue visibility. At present 45% of orderbook is of export and 55% of domestic. Comapny is hopeful of increasing export revenue significantly in coming year. As per company there is strong bidding pipeline for domestic and international markets.China plus one policy and also supprting them for getting orders.
Polymer pipes and Fitting business is also showing some traction, which is at present 15-20% of sales, but at present low OPM business. Perhaps company wants to establish the brand position.
From all above it becomes clear that company is slowly weathering the storm, reducing dependence on domestic orders but stretched working capital is excerbating the recovery.
Company is not holding any conference call for past 2-3 years. So, difficult to ask from management. But some analogy can be drawan from Skipper Limited Q4 FY2018 Earnings Conference Call on May 17, 2018:
Meanwhile I tried to see intest rate of some of infrastructure companies. Findings are as below:
Kalpataru Transmission Ltd
FY
Borrowing (Cr)
Interest(Cr)
Rate (%)
FY17
2849
469
16.46
FY18
3319
473
14.25
FY19
2610
486
18.62
FY20
3296
603
18.29
FY21
3153
532
16.87
FY22
NA
NA
Skippers Ltd
FY
Borrowing (Cr)
Interest(Cr)
Rate (%)
FY17
436
68
15.60
FY18
496
79
15.93
FY19
523
102
19.50
FY20
454
85
18.72
FY21
439
75
17.08
FY22
575
93
16.17
L&T
FY
Borrowing (Cr)
Interest(Cr)
Rate (%)
FY17
92807
6829
7.36
FY18
106619
7714
7.24
FY19
124579
9339
7.50
FY20
141770
11021
7.77
FY21
133505
11750
8.80
FY22
123468
9078
7.35
From above it can be seen, that bigger companies has much higher pricing power, have access to cheaper loans, can negotiate terms and conditions,have much higher advances from customer, credit rating is high, so there interst cost is low ( i.e. L&T)
I couldn’t make sense of the trading losses they reported last qtr or this qtr. On the top of that it being notional. Can they be trusted? Order book remains strong though.
Disclosure: Invested for last 4 yrs and seriously considering exiting.
Management has started con call after the long time. This is very poisitive sign, it appears that managament is now confident about future growth.
Although, YoY quartely revenue slightly decreased but EBITA ( even with forex loss) is increased, it means margins have gone better. Since, they are now dealing fairly good amount of international orders, gain/ loss due to currencey fluctuation will be routine featue. They want to grow export to the tune of 75% of revenue up to FY 24.
Higher debt is eating their profits. Although, it has come down to Rs. 585 Cr in comparison to 628 Cr. in Sept Qtr FY 22. The interest payment is slightly lower in this quarter in comaparison to previous quarters. Management in threir investor presentation has mentioned to reduce it significantly in second half.
Although revenue from polymer segment is slightly reduced but profi increased. Comapny is aggressively expanding the dealer network. Considering drop in PVC prices, these results are good. Much pressure on this front is seen in big companies like Astral etc.
Rs.905 Cr. are stuck in inventories in comaprision to Rs. 786 Cr. in Sept Qtr FY 22. Management in their investor presntation has mentioned that this is due to maintaining high inventory level to avoid raw material fluctuation. But, such a high level inventory may lead to invenstory loss also in next quartes, especially when RM prices are on down turn.
6.Cash flow from Operation are quite good ( Rs. 93 Cr.) significantly better than many previous quartes. It means realisation are better.
Order book is Rs. 2163 Cr. , thus providing revenue visibiltiy for next few quarters. They are having good bidding pipelines.
Conclusion: In my opinion, the skipper is working hard to grow profitibility and margin. Starting Investor conference intimation shows management confidence about future visibility. Macros are also favourable due govt. push on infrastructure.
Disclosure: Invested. No transaction in last 30 days.
Revenue Q3 = 444 Cr. which is nearly 10% more YoY (Q3, FY22 = 400 Cr.) and approx.4% lower sequentially.
PAT is 9.5 Cr, which is more than YoY and QoQ. Although, PAT in comparison to turnover is not significant however, better than with previous quarters.
Forex Loss in this quarter is 4.4 Cr. (YoY forex gain = 6.8 Cr., QoQ forex loss= 12.1 Cr.) which is notional but form part of P/L statement.
It appears, Skipper is scaling up polymer product division . ( Profit= 3.5 cr., YoY= 3 Cr., QoQ= 2.8 Cr.). Margins are lower (4.8% operating margin).
In their presentation they have shown operating EBITA margin as (excluding forex & JV) 11.2%, which is 100 bps better than YoY (10.2%) and same as YoY ( 11.2%). Operating margin of Engineering segment remains in 13 % range, which of polymer it is 4.8%. Total OPM margin is 10.19%, which is better than previous quarters.
Finance cost is heavily eating in their profits. This quarter Interest cost = 25.7 Cr. ( YoY= 22.8 Cr., QoQ= 22.5 Cr.).
Skipper-Metzer India LLP JV which is in drip and micro irrigation business has turned profitable. ( PBT 4. 7 cr.)
Total Order book as on end of Q3 is 4705 Cr (20% export and 80% domestic orders). They won largest order from BSNL ( 2750 Cr) for supply and erection of Ground based towers and infrastructure, and maintenance for 5 years to be extendable for further 5 years. Capex is 60%, while Opex is 40%. They expect 1542 Cr. revenue in FY 24, 25 ( Capex )and rest 1028 Cr. ( Opex) over next 5 years).
Skipper has strong bid pipe line of Rs. 8320 Cr. ( 5200- international, 3120 – domestic). There are many prospective schemes of govt. due to push on infrastructure and FTA with Australia which will benefit company. Company expect to replicate domestic low cost model in international market also.
Company expects revenue 25% CAGR for next 3 years, grow export to 50% in FY 23 ( 51% stood in 9MF 23), 75% in FY 24.
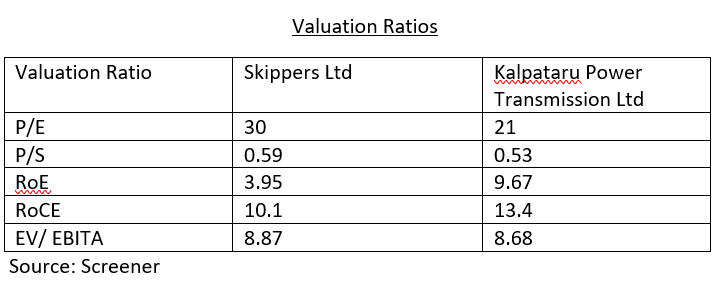
From above it can be seen that company is slowing inching OPM upward, consolidating their position in international market, providing revenue visibility for next few years. However, dependence on PSU orders is till very high, which company needs to reduce. If we compare OPM of Skipper with Kalpataru it is in same range , while better than KEC international. Skipper has to improve on asset turnover ( Skipper=3, KEC=9, Kalpataru=4), and inventory turnover ratios ( Skipper= 1.73, Kalpataru= 6.10, KEC=6.35). Interest cost as % of turnover for skipper is quite high ( Approx. 5.5 % of turnover), while it is 3.1% for KEC international, and 3.5% for Kalpataru. Scaling up business with higher rate, controlling working capital days , and reduction of interest is key to better market capitalization of Company.
Source: Screener
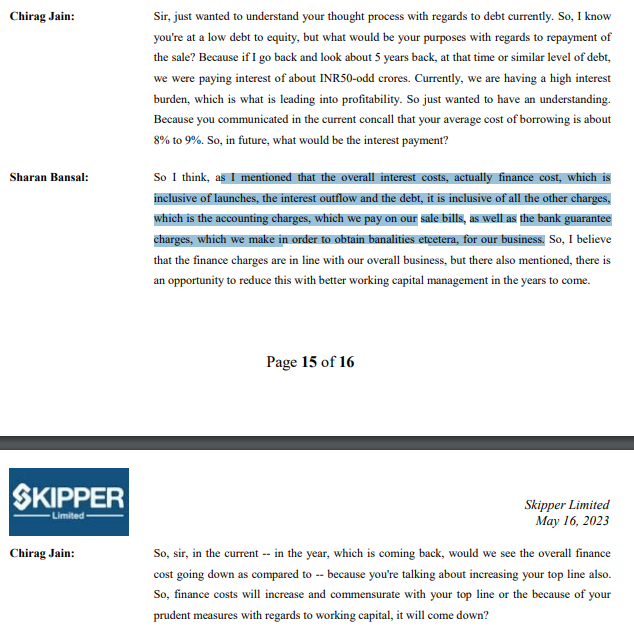
Does any one know why interest cost is so high ? Term loan + Working Capital + Lease Liability ~ 500 cr max. At 10% interest max interest cost should be 50 cr. While in Q1 results 25cr of interest payment was there.