Sarla Performance Fibres - Another Interesting Textile Story in Making?

Dear Members, wanted to draw your views and attention on Sarla Performance Fibres.

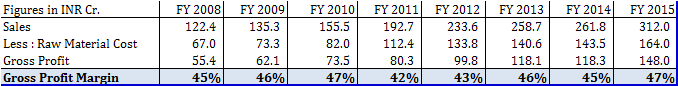
Company is manufacturer of specialty polyester and nylon yarns. Its product finds application in innerwear, hosiery, sportswear, narrow fabrics, seat belt, car airbags, fishing nets and leather goods. These products are different from commoditized yarns given their nature and it requires a strong understanding of product & customer requirements and specifications. This transpires into healthy operating margin to company - operating profit margin has been in range of 20% to 17% over last 7 years with exception of FY 2012 where it dipped to 14%.

Company has 2 manufacturing facilities at Silvassa, India with capacity of 11,000 TPA and one dyeing plant in Vapi with capacity of 3,200 TPA

Co set up wind mill with total capacity of 7.25 MW to cater captive energy needs.

Co caters to branded global players including - Jockey, Hanes, Gildan. No single customer contributes more than 15% to revenue. Yarn constitutes ~5% to total cost of final product; however a very crucial product, hence Premium paid for Quality & Consistency desired by Large Global Customers (Hedge against raw material price volatility).

~57% revenue comes from US and Europe and 43% from Asia Pacific.

Growth Triggers -
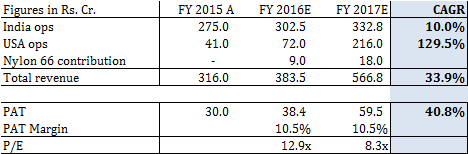
a. Co. has set up manufacturing unit in South Carolina, USA with installed capacity of 9,990 TPA. As of March 2015, it was operating at 20% capacity utilization and is expected to scale up this year. (Exact details not available as company did not conduct any investor call). Key highlights of this plant include -

  • NAFTA & CAFTA treaties, allows waiver of duties upto 32% on synthetic garments manufactured in North or Central American region using US origin yarn when exported back into the United States (company claims to be only Indian company having presence in NAFTA and CAFTA regions)
  • Proximity & Visibility to customers (majority clients in USA and Europe)
  • Lower Logistics & Power (majority clients in USA and Europe)
  • Lower Cost of Borrowing (dollar debt)
  • Plan to expand current capacity to ~18000 TPA by 2017 (double in 2 years)
  • Land cost of Rs. 7 crores to be paid over 7 years

b. Company has set up pilot plant at Silvassa to manufacture Nylon 66 which is high tenacity low shrinkage product used in parachutes, shoes. Company claims to be only manufacturer of Nylon 66 in India. Note capacity of this pilot plant is mere 450 TPA as of now

Financials -
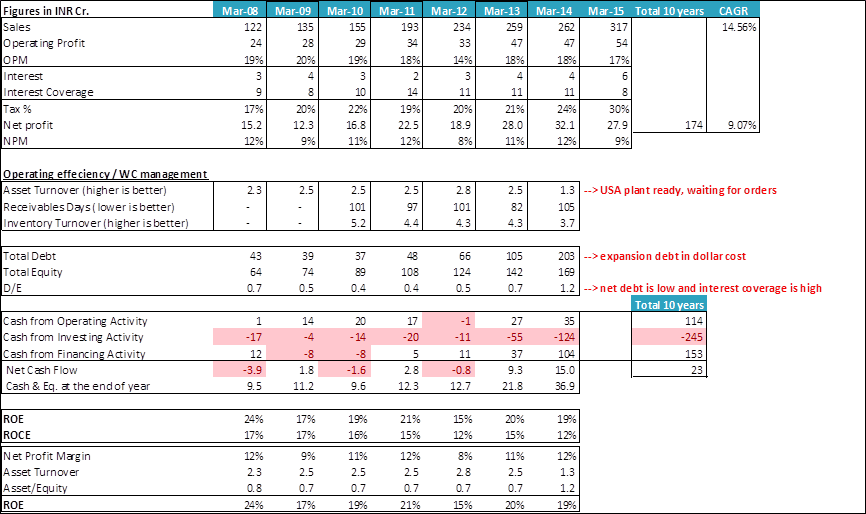
Market cap of company is Rs. 358 cr. and FY 2015 PAT is 28 cr. (P/e = 12.7x)

Sales have started to pick up : FY2015 sales of Rs. 317 cr. is 21% rise over FY2014 sales. Operating profit margin have been in range of 20% to 17% over last 7 years (with exception of FY2012 where it dropped to 14%). Due to increase in tax rates from 24% to 30% in FY 2015, net profit margin is at 9%.
Though debt levels are doubled in FY2014 over FY2013 to 205 cr. interest coverage ratio remains healthy as it is dollar debt. FY 2014 debt and equity is 203 cr. and 169 cr. resp.
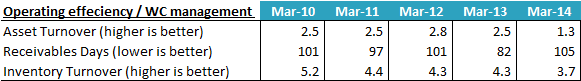
Asset turn has taken hit to 1.3x from 2.5x due to recently installed USA capacity (asset base increased to 196 cr. from 102 cr.). FY 2014 ROE is 19% (net profit margin of 12.3%, asset turnover of 1.3x and asset/equity base of 1.2x)

Note : debt/equity has been conservative in range of 0.11x till recently. Expansion in USA plant has expanded leverage albeit at healthy interest coverage ratio as it is dollar debt.

Company recently concluded QIP of Rs. 46.7 cr. in Oct 2014.

Company has been dividend paying since last 11 years.

Promoter holds 55% stake in company with no pledge.

Company’s website is very informative and updated (http://www.sarlafibers.com/desk-managing-director.html?reloaded=true)

Key concern remains - response to USA plant expansion. If the USA plant delivers then growth coupled with higher margins will lead to good value accretion to shareholders.

Review comments on Sarla Performance Fibres and above write up are invited please - happy to explore this idea further.

Disclosure - invested in stock

12 Likes

Hi Pratik.

One question that I have is “Do we know why the plant is operating at 20% capacity. Meanwhile in the latest investor presentation from the company, it says the capacity will be expanded to ~18000 TPA. Do we know why the capacity is doubled where-as the utilization is at 20% ?”

Link to presentation: http://www.sarlafibers.com/images/Sarla_Performance_Fibers_Ltd_Presentation_FY2015.pdf

Hi Aravind, thank you for taking this up.

Under Phase I of USA operations, company plans to have 9000 TPA capacity. Phase I started commercial operations in Jan 2014. Company hired resources in USA, trained the manpower, manufactured sample products, sought client approvals, and started shipping out minor quantities till H1 FY 2015. In Q3 FY 2015, utilization level increased to 20% with cash loss.
Co expects to go to 30%-35% utilization level by Q4 FY 2015 or Q1 FY2016 as it receives more orders at which USA operations shall breakeven. Co. expects to sign up major client by Q1 FY2016 (as indicated in Q3 FY 2015 con call). Co boasts of long term relationship with global brands.

As Phase I reaches 50-60% utilization level, Phase II build out will start (to take capacity to ~18000 TPA). Margin for US operations is expected to be ~24%.

Evolution and impact of USA ops is as highlighted in attached excel (as compiled from ppt on company’s website).

QIP proceeds which are lying in FD will be used to fund Phase II expansion.

Key here remains Q1 FY2016 quarter performance : any update on new order for USA plant, any visibility, Nylon 66 repeat orders, Euro crisis impact. Albeit, an investor call for Q4 FY 2015 would have helped immensely.

Some prudent policies of Company extend comfort like :

  • Company bought 42 acres land in USA at mere Rs. 4 cr. as it was acquired from county (non profit organization).
  • Company is stepping its capacity only as it gets more clarity
  • Rs. 23 crore loan in USA which will be waived off after 7 years
  • Trying to reduce raw material cost as % of sales and notch up on value chain to cover raw material price risk
  • Exclusive warehouse for Hanes in Vietnam and Thailand - company has 8 years of relationship with Hanes
1 Like

a. FY 2015 sales = Rs. 316 cr. = Rs. 275 cr. from India ops and Rs. 41 cr. from USA ops
while FY 2014 sales = Rs. 262 cr. = Rs. 253 cr. from India ops and Rs. 8 cr. from USA ops

b. At full utilization level, Phase I USA plant has potential to yield $35 mn sales (Rs. 200 cr.).

c. India ops (ex Nylon 66) to grow at 10% (as per Q3 FY2015 mgmt. con call) and if USA ops scales to 50% utilization levels (from current 20% levels) then FY 2016E sales = Rs. 402 cr. = Rs. 302.5 cr. from India ops and Rs. 100 cr. from USA ops which is healthy 27% growth from current levels. At 10% NPM, it transpires to 50% PAT growth.

This is my 1st post, request fellow boarders to usher the flow and guide.
Please contribute if you have any insights on industry and management as well. Thanks

1 Like

The company sounds interesting even if this is a commodity company where there will be many external factors which limits pricing power . A glance of the share price chart for past 15 years shows that the company has many ups and downs with regard to share price which is stagnating for a long period from mid 2005 to mid 2013 .Reasons will have to be escertained .
I had a cursory look at the financials for past 3 years . Will try to go through the ARs for past 15 years or as many as could be accessed to have a detailed view . Can Somebody see if there are any change in management for past 3 years ?

1 Like

Had a look of financials for past 15 financials .Saliet points .
There was no dilution of equity .
Same management( promotors ) for 15 years .
While there is not much pricing power a company - between ups and downs - was able to perform with a ROC hovering around 15 to 17%.
The company operates in niche products where the margins are reasonable but with limited market size .
I expect the company to perform in tune with the past growth .

1 Like

Hi Murthy, thank you for inputs.

This quarter result would shed light on key triggers including - US operations, any new sign ups for US plant, about Nylon 66 demand etc…

In meanwhile, i have enclosed below last 7 years consolidated financial performance of company for quick reference -

OPMs and ROE have been healthy and steady in range of 20%-17% and 24%-17% respectively(except for FY 2012) over last 7 years. Asset turn and leverage have been impacted due to US expansion, positive results of which are expected to be seen this year (per management con call conducted in Feb 2015).

1 Like

Hi Murthy, three quick points on your post -

  1. There was dilution in equity in October 2014 through QIP route; dilution was to support to US expansion

  2. Why do you say ‘limited market size’ - please elaborate on industry size, competition data if you have any?

  3. Why do you expect ‘company to perform in tune with the past growth’ - please elaborate if you have insights on US operations, new product, client pipeline etc etc

Many thanks

  1. Product manufactured in USA plant are textured and twisted polyester yarn. They find application in sewing thread, narrow fabric, furniture and automotive upholstery

  2. Re USA plant it can yield ~Rs. 200 cr. revenue. In FY2015, it generated Rs. 41 cr. revenue connoting 21% utilization levels.
    As picked from con call, USA plant is ready and test/sample orders were shipped to clients last year and orders are expected to pick up this year. In fact, management has gone a step ahead and plan to increase capacity by another 9000 TPA after existing Phase 1 picks up. Financing for Phase 2 financing is availed.

This remains key question for management - visibility on USA plant demand levels. Company has been very conservatively financed in past, plant in USA has led to leverage albeit with expected growth kicker so USA plant expansion warrants a close watch.

  1. Nylon 66 plant in Silvassa is on pilot basis with capacity of 450 TPA which seems to low to add meaningfully to revenue.

  2. On Management, did not find anything about integrity issues. Request boarders to add/guide on this please.

Some prelim thing -
a. Did trivial comparative mapping of sales, net profit and salary of MD and CEO

2 Likes

Similar to this thread.

1 Like

Hi Pratik,

Thanks for the research on Sarla. A couple of points from my side. The presentation prepared in May states that the utilization levels in the US factory stands at ~30-35% (mentioned in slide 26) and US performance is the key growth trigger for this stock. As you mentioned, capacity utlization was 20% as of March 2015. Would like your opinion on the May number. Also, I have noticed in the management commentary that Sarla concentrates on high margin products but net margin figures are slightly on the lower side. Would like your input on the margins side as well.

Disc: I am invested.

Hi Smiran, thank you for reviewing the write up.

Refer page 5 and 10 of Q3 FY2015 con call transcript (link below) - It talks about both points
http://www.sarlafibers.com/images/earnings_call_transcript_feb-18-2015.pdf

  1. EBITDA margin to be in range of 24% - Current OPMs are in 18% range factoring in loss at USA plant.
    In Q3 FY2015, raw material to sales ratio had fallen below 50%. Company is vying to get this %age down to 40%-45% range (implying 55% gross margin) by moving up the value chain (refer page 10 of above link). I will also share the brief maths around this shortly.

  2. Potential of $36 million revenue (i.e. ~Rs. 200 Cr.) contribution at full utilization of Phase I of USA plant. Also page 5 and 10 of con call highlight these points : Rs. 500 cr. revenue = Rs. 300 cr. from India ops + Rs. 200 cr. from Phase I of USA plant.

Now for period ending March 2015 : USA plant did sales of Rs. 41 cr. Therefore, implied utilization of 20% i.e. 41/200

I am assuming May presentation being more updated and recent one is giving more fair picture of 30% to 35% utilization levels - but in absence of exact numbers i am being conservative in my maths with 20% utilization levels

Let me know if this helps, happy to get into more collaborative research.

1 Like

@Smiran please see below for gross profit margin calculation. Average gross profit margin has been 45% over last 7 years. As per con call transcript, mgmt. endeavors to scale it up to 55% levels.

@borapratik03. Thanks. This helps a lot.

Hi All, company has come out with outstanding set of numbers for Q1 FY 2016. Below is the quick analysis of numbers -

+5.1% and +5.3% y-o-y improvement in EBITDA margin in standalone and consolidated resp.
+33.5% and +58.1% growth in PAT in standalone and consolidated resp.
very sizeable improvement in gross profit margin

http://corporates.bseindia.com/xml-data/corpfiling/AttachLive/220CB3D8_7C59_4C01_91C8_C4B5C00B9B66_151920.pdf

It is important to track following things now -

  1. how is the USA plant picking up - expected capacity utilization this year and hence revenue. And how has been client reaction for supplies from USA plant?
  2. are the margins sustainable (gross profit margin and EBITDA margin)
  3. Is relationship with Hanes auguring well for business at USA plant ?
  4. Co. expected to sign up major client by Q1 FY2016 (as indicated in Q3 FY 2015 con call) - any update
  5. any plans to increases capacity at pilot plant set up at Silvassa for Nylon 66
1 Like
  1. Standalone sales is Rs. 63 cr. -> implying sales from USA plant is Rs. 17 cr. as consolidated sales is Rs. 80 cr.
  2. Rs. 17 cr. quarterly sales from USA plant implies annual sales of Rs. 68 cr. i.e. 66% percent growth over Rs. 41 cr. sales registered last year from USA plant.
  3. Also Rs. 68 cr. annual sales corroborates ~35% capacity utilization levels (Rs. 200 cr. sales is expected from USA plant on full utilization so Rs. 66 cr. implies 35% utility levels)
1 Like

Hi. I wud like to highlight some basic things like…

  1. From June 14 to March 15 the top line has been on a decreasing trend from 70.02 crs to 60.71
  2. In Sep 14 & March 15 qtr, Other income was over 4/crores which in Dec 14 & June 14 was in decimals…
  3. Promoter shareholding from Sep 14 has gone down
  4. Inventories & Debtors have been on an increasing trend (generally) since last 3/yrs.
  5. Secured loans have gone up from 43 crs, March 11 to 95/crs in March 13. And just dropped marginally in March 14/to 91 crores.

Above are some negative indicators.

2 Likes

Hi @kash3001, please see reply to basic things/negative indicators pointed out by you –

  1. Mgmt. had guided for muted growth in FY2015 given focus on up-streaming the USA plant – which is main kicker. This year (FY 2016) India ops are expected to increase by 10% and USA ops are expected to double (June 2015 quarterly result are walking the talk).

  2. Other income as % of sales has been ~3% average over last 10 quarters

  3. Promoter shareholding gone down from Sept. 2014 as Company did QIP and allotted shares to some reputed fund houses including HDFC MF, DSP Blackrock, Canarra Robecco MF to name few. Fund raise was to support USA plant expansion.

4 and 5. From Feb 2014 till date USA plant is supplying sample quantities to potential clients – test marketing as they call it. Also the net block has increased to Rs. 200 cr. in FY 2014 from Rs. 102 cr. in FY 2013 (double the capacity). These things has led to increase in net debt and impacted operating efficiency – see table below

My takeaway: It is conservatively financed company with net debt/equity well below 1x till FY2013. Company did QIP and doubled capacity by launching USA plant in FY2014 and did test marketing in FY 2015. FY2016 numbers are expected to underpin the results of investments made in past 2 year - June 2015 quarter result being testimony to it.

Let’s hear management on concall tomorrow at 4 pm to corroborate the story.

2 Likes

Pratik… Appreciate your meticulously organized information. :thumbsup:

Hi All, the Investor concall with Sarla’s management today to discuss Q1 FY2016 results was very informative. Management was very forthcoming on the queries raised by participants.

Key messages which came out were –

  1. On revenue side :
    a. US plant delivered $2.34 million revenue in this quarter and is safely expected to deliver $ 12 million i.e. Rs. 72 cr. revenue in this FY i.e. 33% utilization level

b. For FY 2017, management expects US plant to operate at 100% utilization level safely and deliver $ 36 million revenue i.e. Rs. 216 cr.

USA plant is currently operating at 15% EBITDA margin which is expected to scale up to 20% this year and at peak utilization is expected to rise up to 25%

c. Nylon 66 production is stabilized and plant at Silvassa is expected to contribute Rs. 9 cr. revenue in this FY starting Q3 FY2016 and deliver Rs. 18 cr. revenue in full year FY 2017

d. India ops are expected to grow at 10% CAGR

  1. On margin side, management is confident of maintaining ~10%-11% PAT margin

  2. Above numbers lead to below estimates, which management confirmed for FY 2016

    At current market cap of Rs. 495 cr., FY 2016E P/E is 12.9x only

  3. As most of capex is already funded, Management may increase dividend rate going forward

  4. One big client in USA has approved yarn package supplied from Sarla’s USA plant. This client incidentally gives $90 million business annually to Sarla’s competitor in USA – Unifi (listed company). Company is now waiting for client to place order with Sarla.

  5. Total market size for CAFTA/NAFTA plant in USA is $1.5 billion

  6. Management endeavors to maintain raw material/sales ratio i.e. gross profit margin in current range of ~50% and due to specialized nature of yarn they are confident of maintaining the margins – covers cotton price fluctuation risk. As manufacture and supply is in foreign currency, currency risk is minimal.

  7. Client concentration risk is minimal – no single client contributes more than 5% of revenue

6 Likes