I agree with the first three buckets of risks, but not the last.
Infact I will combine the first two into one bucket. Instead of projecting my own future earning estimate, and to obtain a valuation from that, I try to figure out what kind of earning growth is built in the market valuation and whether I believe that the company can do even better. Risk lies in actual earning underperforming the ones baked into buying price.
Management quality is very important factor. We can view the stock price as discounted sum of all future earnings, but only when the promoters/management’s integrity is not under question. If the management shows signs of cheating the minority shareholders of their wealth, then the share value is close to zero in my opinion.
In addition, I will also add a bucket for business quality. Some business are top quality owing to their industry structure or competitive moats, and there is always a risk of underlying moat getting eroded due to technological innovations or change in regulations or competition. Before investing, we should always think about how likely it is for the underlying business to get disrupted.
Lastly, market valuation risk must be re-labeled as market risk. I am not convinced that timing the valuation is more effective than timing the market itself. Afterall, a market can be fairly valued, like in the start of 2017, before a bull run takes it to even higher levels. You lose money if you are not fully invested during the bull run due to valuation fears, and to avoid that loss, you need a good handle on market risk. To do that, you need well tested system which helps you stay in the market during most of the bull run, and avoid it during most of the bear run. Using valuation model is one such system, but not an effective one. That said, I still don’t have an alternative, I am a novice myself, so market risk is something I will have to take until I build myself a good system.
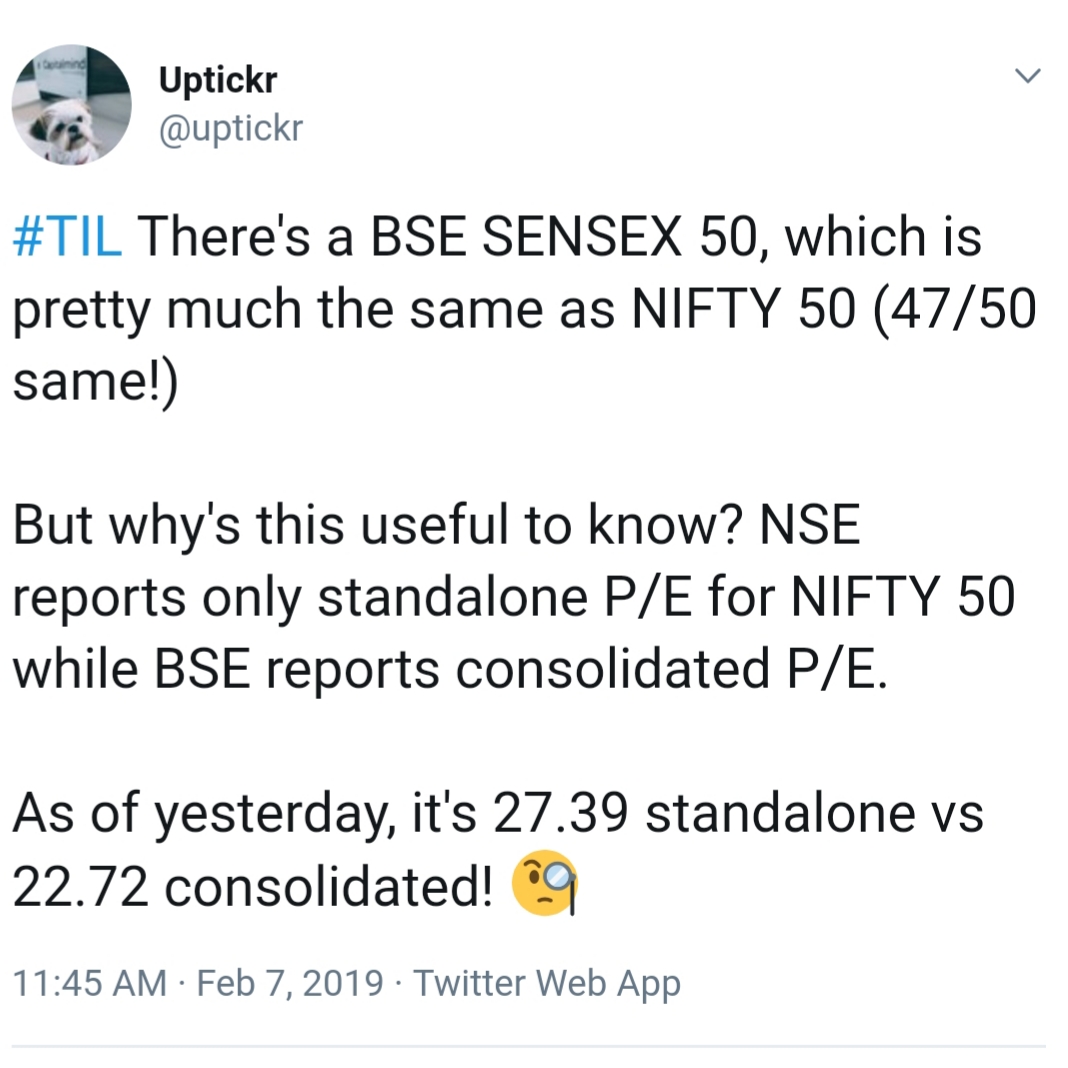
That 27 standalone PE compares with long term standalone average PE of 18. Against 23 consol the long term average might only be 15 or so! These kind of arguments (consol vs standalone, trailing vs 1 year forward) are generally only made to rationalise a point of view that current facts don’t fully support - that fact in this case being, in general, markets (large caps) are fairly expensive
This assumes same allocation and not lump sum outflow during dips. People who tend to stay in cash and employ significant funds during market falls would surely make more returns?
Hypothetically yes. But very few were able to do it in 2008-9. Most waited for clarity including professional and seasoned investors. Here I am not even talking about professional and seasoned investors. I am just talking about 98% who are avg investors like me.
If one uses the Nifty PE as a basis of investment, then one other rule will apply in corollary:
The Rule:
PE bell curve strictly applies to the Index of Nifty 50, and in exact % allocation as the Index is.
In other words, if one allocated 10% in Eicher Motors, but Nifty 50 allocated only 0.80% then Nifty PE histogram does not apply. Bets would be skewed.
Rephrasing the above:
The theorem “Nifty PE 25 is expensive, PE 20 is average and PE 15 is cheap”, applies only to the The Index of Nifty 50 AND In exact proportion of % allocation in every scrip as published on the NSE website.
Does anyone have the statistics of how much small cap, midcap and large cap correct in a typical bear market in percentage terms (or let’s say in 2008).
We definitely know that the market is two paced with large caps and other stocks. But I am looking to get a feel of how bad it could get for midcap and small caps.
Dear @valuestudent,
It’s a fight between mind and the bladder. The mind wants a dopamine high you say. The bladder cant hold on indefinitely said…uh…me. In other words, sitting on cash indefinitely is very hard.
Its interesting how you package age old wisdom in different words. There’s stock risk and there’s market risk, one is alpha, and one is beta. Most analysts and managers seek to better their alpha and take beta as inevitable ( smart beta is a later invention), whereas you seek to cover for lapse in alpha via beta. Interesting. So, even mistakes, or bad choices made when the market is truly in the dumps gives one a chance to recover, and even make some money.
One dichotomy everyone sees is how there is now no one Mr. Market. There’s the favored ones, which trade exorbitantly and then there’s the other stocks which have taken a pounding. What do you think of looking at the second category - the ones where business remains fundamentally strong, but prices have been pummeled simply because they do not belong to the “A++” category?
Hello. In case anyone can comment on how much all three caps have corrected from their highs, it will help us in understanding how much maximum fall/upside can we expect? Thanks
This sounds reasonable this time around. Small caps are already down around 40%. But large caps haven’t moved a bit. Now what’s left I suppose is 40% drop in all caps. Or let’s say a nifty Value of around 7000 (worst case).
2008 and 1929 happen once in few decades and part of long economic cycles. So 2008 like draw down in near future has low probability and waiting for that may be futile…
The % wise it varies based on time/price correction, but the average bear market lasts around 367 days. The small & midcaps are in bear market for more than an year now (entered 14th month). While small & midcaps faced sharp correction, guess nifty will be in time correction (range bound).