Nifty PE crosses 24|A statistically informed entry-exit model!

Even Nifty EPS growing 18.5% in one year, on the back of NPA recovery, is no guarantee that it will cross 12k. The one time exceptional growth may already be priced in, and if the global liquidity situation is not supportive, our markets may not rally either. We may just have another rangebound year like 2018.

The only guarantee one can give is that, companies showing sustainably high growth rate will see their share price rise in proportion, provided we are considering time periods long enough for full PE expansion and compression cycles.

That said, learning to time the markets is an admirable goal, but you must use the right tools for it.

But the real question is, “Is this the outcome you wanna bet on?”

As for me, I do not see the EPS picking up drastically. Furthermore, my biggest concern is the real reason behind the rise of the markets. Our economy is a good one, maybe not presently, but in the long run yes. But, before the long run, comes the short run, where liquidity counts.

FED are tightening rates, and that is the biggest news for the stock market for everyday of this year. USA is down around 20% from the top, India should be more. But, let the general election get over, then sanity will prevail, probably after a little bloodbath. Investors in FAANGs are gasping, whereas our IT is thriving at all time highs. There is noticeable disparity which will even itself out post election. When the government will have no motive to prop up the public sentiment.

And the first to go will be IT, Banks and NBFC because they are most affected by foreign policies and liquidity crunch. This makes most of our Index.

**Market has historically traded for a total of 50% of all trading days at or below PE 18. Therefore, I believe PE 18 is not too much to ask for. I would be too bearishly ambitious if I were pressing for PE 12 or 14.

As far as EPS growth is concerned, why expect what is improbable. Expect what is seemingly a natural progression of current events. Meaning, currently the EPS growth is poor, and is likely to stay like this or start improving. This is more logical, Instead of expecting growth to jump to 19% from 2.35% in a short duration. That given, Nifty 12000 is unsustainable, and Nifty 8000 is highly likely.

**Edit

2 Likes

Just a thought, FAANG and Indian IT have nothing in common.

1 Like

Attached are charts giving us the “spread of returns” over various time frames of the sensex. The data has been sourced from Historical - Indices and is historical data from 1999 - so 18 odd years

A common way to look at risk is to measure volatility of returns by looking at the standard deviation. However, in a trending market ( up or down ), you will have volatility by default and thus its just one piece of the puzzle. The other two measures are the skewness of the distribution and the kurtosis.

A positive skewness is preferred as it means excess average returns which is good.

A lower kurtosis is preferred as it means less extreme observations and bunching up. The kurtosis of a regular normal distribution is 3. Excess of kurtosis over 3 means risk or fat tailed risk. Hence, if returns are normally distributed excess kurtosis is 0 or the possibility of extreme events remains slim

The best combination is ofc positive skewness combined with negative excess kurtosis

image

In the table one can clearly see the kurtosis reducing dramatically as the length of holding increases indicating a reduction in risk. The annualized returns also reduce in tandem.

The take way is a strong argument for long term patience as far as the index goes. The returns are there and as the holding period increases they do come down but not as much as the risk comes down. Holding on to the index through thick and thin is one way of reducing risk of extreme events.

For some good inputs on risk (the stastistical variety) one can visit the following articles

WEB & his partner CM are well known for disparaging standard deviation as a measures of risk and i concur. However, the higher measures of risk (at least in financial literature) are well worth spending time on as they too can offer clues on the all important topic of risk.

2 Likes

With some people rightly questioning PE as a measure of how expensive markets are , let’s look at another data point . GDP to market capitalization used by warren buffet. We are around 80% right now below last years >100%. Still we are trading at historically higher levels. We are not cheap and we are probably not in bubble zone either.

However I don’t believe we can go up. Reason being if markets go up , US fed will increase rates further because they need to be as high as possible to be ready for next recession . They will not stop until they have to. Upside in my view is limited as fed rate hikes won’t allow to much of an upside .

1 Like

I think it’s not going to fall like it did in 2008 as there is lot of liquidity this time. It would be a gradual process with lot of volatility. People wont be able to make a lot money in shorting . It’s best to wait until the time to buy arrives. One thing I am sure about is that this next bull run won’t start until it pushes away majority of retail. That’s what our entry point should be. That may happen 2019 or 2020.

1 Like

Continuing from the previous post - you can visually also see the distribution of returns becoming more normal as time passes by.

1 Like

Came across this interesting article on correlation between Central Banks led liquidity and stock market movemnet. Posting here as this may be relevant to understanding how market price discovery may have been and may remain overwhelmed by Fed’s actions.

Updates to the Gloom & Doom Report By Your Friendly Bear.

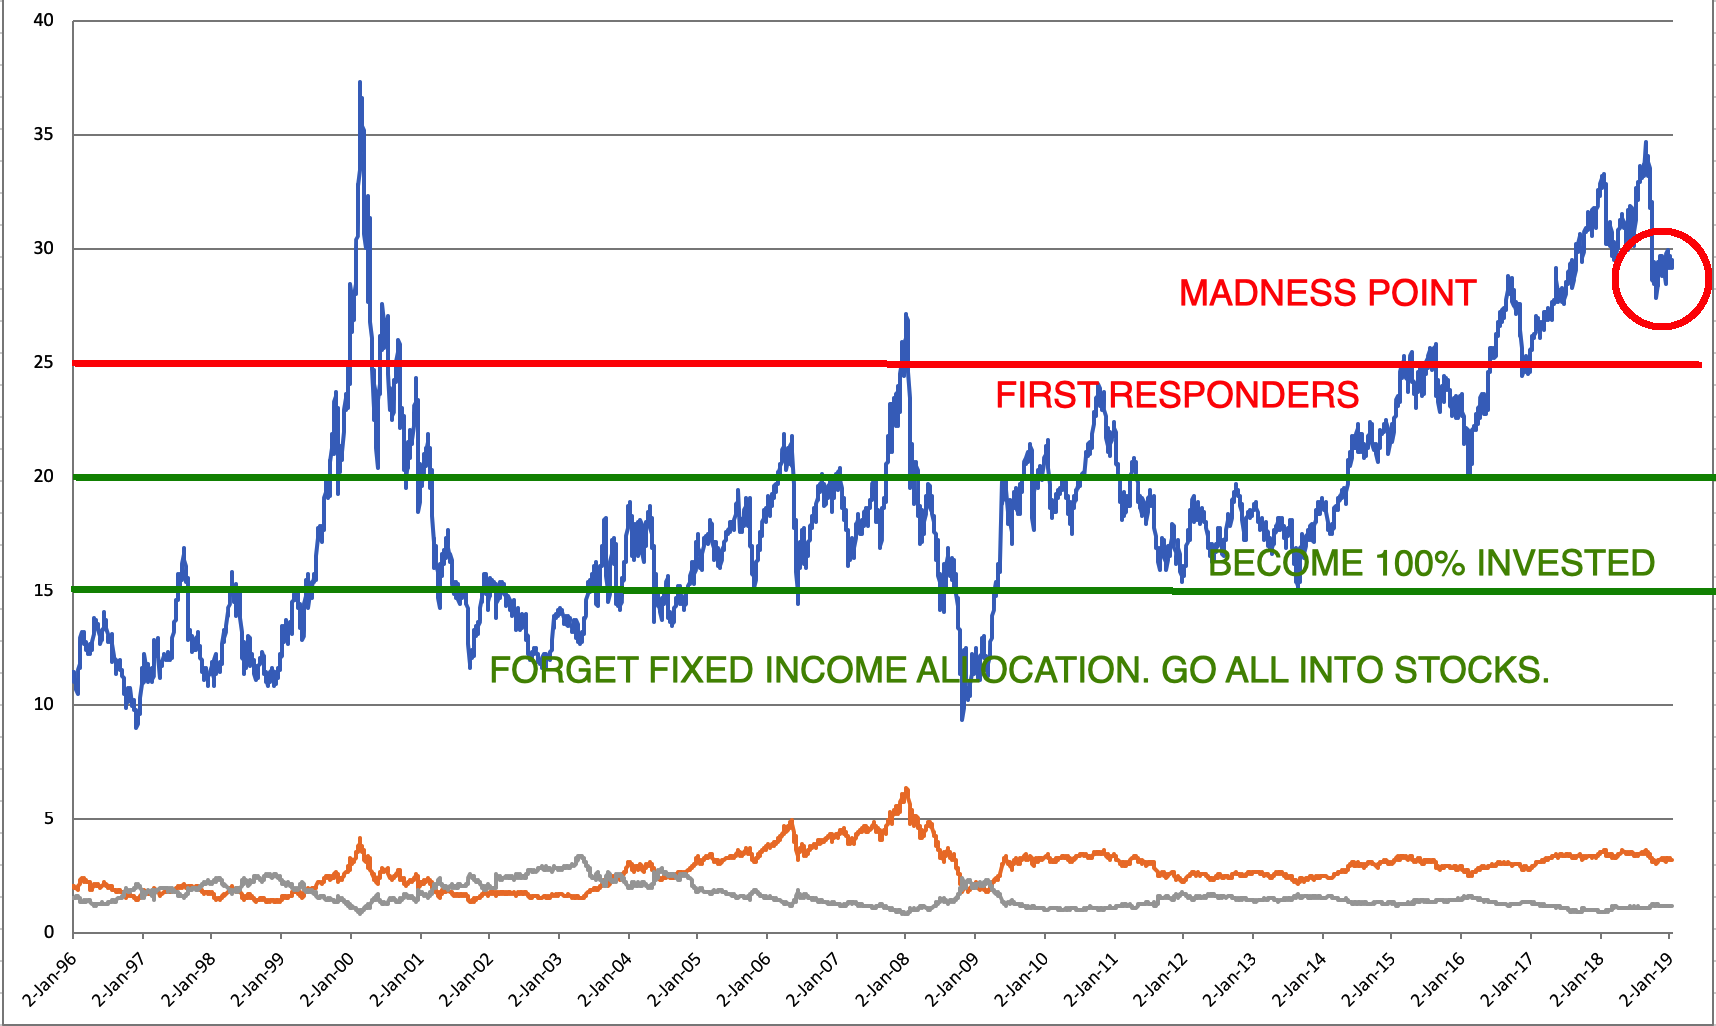
The markets are still very overvalued. The chart below is the current updated Nifty 500 as it stands as this week. Yes, it is 23 years of data you are staring at.

As you can see we are still at madness point for the entire stock market (Nifty 500 no less, not just 50 stocks of the Nifty). The full downloadable sheet is attached at the bottom of the post.

I feel the October 2018 drawdown got in the extremely early birds. When (not if) the Nifty 500 goes below a multiple of 25 I think we will then get the first responders.

Only after that it will drift down to below 20. That is where I will use my fixed deposits which are meant for allocation to stocks.

However, there is some good news. The whiplash of 2018 has removed the froth (though that does not mean upside has arrived) and since the froth is removed, very good stock pickers may have a good year; this today’s market is a market only for professionals, make no mistake about it.

Idiots like me should and will stand and watch from the sidelines, and directly speculate with interest income, if at all. Else, hand the job over to a professional you trust.

I would also not take advise on whether I need a haircut from a barber. There are many fund managers who are going on TV and claiming things like; on a market cap to profits ratio we are cheap, election years the index always goes up etc etc… See, we are private investors and we need to be clear in our minds on what is reality; their jobs depend on saying these things, I am for sure not listening to the barber. Each one has to decide if they want to listen and put their future at stake without using their mind to come to a conclusion. Best if we all came to our independent conclusions.

This post is just a friendly nudge to wake up and smell the coffee and realize what one’s skill level is. If skilled and you know what you are doing, one could do ok, but if not, it is said for times like these that “If you don’t know who you are, this is an expensive place to find out"

This year 2019, independence of thought and action will be very valuable.

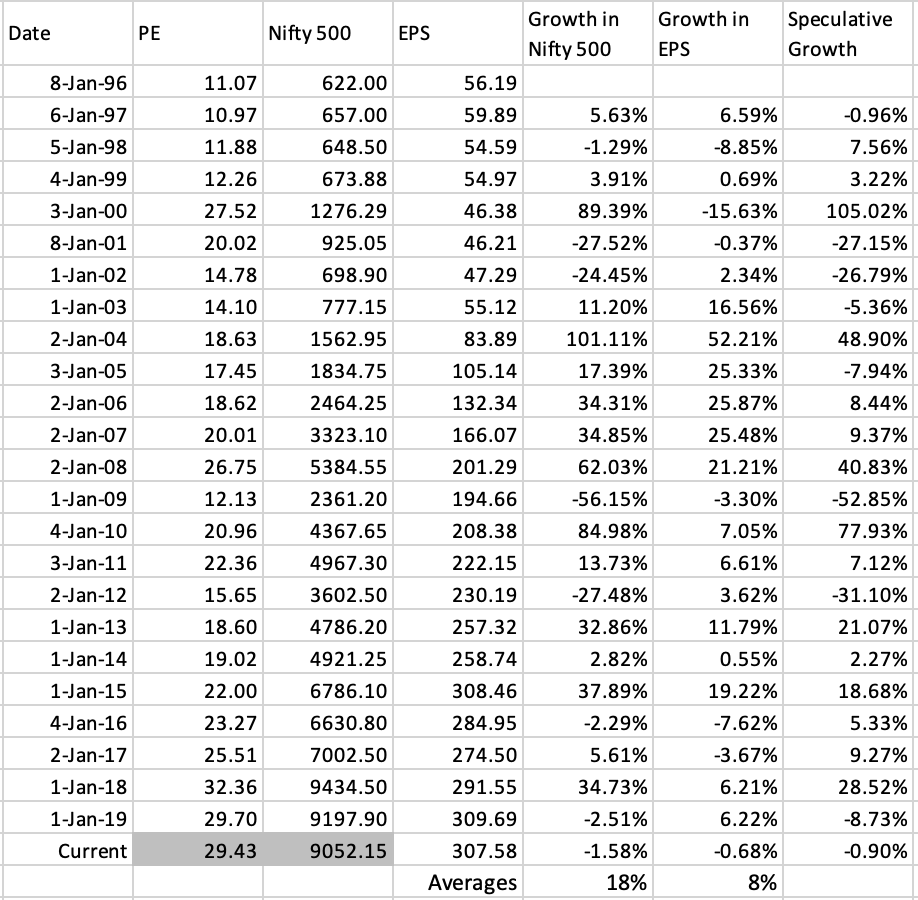
Please find below the valuation model from Mr Parag Parikh updated for Nifty 500. (Also part of the excel)

Happy investing. Be safe.

1996-2019.xlsx (351.7 KB)

16 Likes

Hello Mr. Changu,
Data on trendlyle suggests small cap index is now trading at long term averages and mid cap is slightly above average. Its the large caps that are skewing the curve. Any view?

1 Like

Dear @am648 For sure the data is what it is due to two primary reasons;

  1. What you correctly mentioned, that the “safe” stocks are skewing the data.
  2. Banks posting losses / low profits.

But, there is always something that brings the valuations for the entire market to a depressed state. This time, it may be one of the above or something else.

Early 2018 I felt everyones portfolio will burn and best to step out of the incoming fire (especially small caps), now in early 2019 I do not think so. I feel, since the froth is out, good stock pickers will do alright from here, but novices such as myself still need to be careful.

2 Likes

435 stocks have hit 52 week low today! That’s a seriously high number and I dont recall it ever being this high. Anything and everything auto are dominating the list along with commodity/specialty chemicals, paper, textiles, construction, plastics, metals, renewables, media and cement. The broader market’s back is well and truly broken at this point.

https://phreakonomics.in/quant/yearly-high-low

10 Likes

The true sign of back being broken will be when retail investors start stopping SIPs. Seems the run rate of 8000 crore a month is still going strong. Patiently waiting…,

1 Like

Many new investors are coming regularly with pocket full of money and cart full of dreams, mantra being SIP and SIP alone, they are seeing SIP as a sure-shot return formula, one that could fulfill all their dreams. So much innovation in marketing SIP and making it as a one-stop financial solution. I don’t know what would be the signal that will make this SIP train to stop.

1 Like

Individual exposure of public in equity has historically been low. If the public believe in equity and keep sipping it more than the fall … we have a base for the market as FII’s are not relenting in pulling it down. If the companies start delivering on the results and Election give a clear mandate we will have the bulls roaring. A fractured mandate & Global growth slowdown will be a signal of a protracted bear hug…

1 Like

The other possibility is FIIs know true capabilities of rulers, have a better grasp of economic reality and ability see truth through the propaganda with a clinical, non-partisan lens. Recent blue chip earnings, including autos support the idea of growing economic distress in India. It is no longer rural distress, banking, telecom or real estate but has spread to NBFCs, industry and urban consumption as well

3 Likes

Why does it worry a bottom up investor that whether fiis are buying or selling. Whether sip money will continue to pour or will dry up . We are here to be patient , exploit value inefficiencies which the market offers from time to time. If our aim is long term and we are able to hold above average businesses. We will make money … Politics is a not factor which affects market.
Best
Divyansh

4 Likes

The reality is that the current government is trying to whitewash the black economy which India is. This involves a lot of pain. My experience when I am discussing with any of my friends who does business is that the environment is very pessimistic. The reason is they were never required to pay taxes or show true income before. This is still not the case although they’re required to show at least more income than before. This in itself is not good for the businesses or shareholders like us which probably FIIs have sensed. Whether it is good or bad in the long run remains to be seen.

1 Like

For every seller there is buyer. As financialisation of savings is happening due to various factors like formalization of economy, technology, investor education, increased prosperity etc, indian investors are willing to buy Indian stocks at a valuation and foreign investors are willing to sale at that valuation.

We all want to buy quality stuff when we have purchasing power. 80% ownership of HDFC by FII was not perpetually sustainable.

Now what has prompted FII to be seller:

  • This period saw huge acceleration in US economy and even Europe, Japan and China did well
  • FII except for few, tend to rotate emerging economy investments
  • Indian markets have been trading at relatively elevated valuations compared to some other emerging markets.
  • FIIs may have got overweight on India during 2012-13 due to very cheap valuations/
  • Rollback of QE / Rising interest rates
2 Likes

Yes.

A very large number of Indians are dependent on Small to Medium scale businesses. For every business, big or small, it’s life line is it’s working capital, which used to be is cash. Then came the ban and most businesses came to a grinding halt.

As a result, most MSMEs are operating at lowest efficiencies ever. No spare money in people’s pockets, elites and labour alike.

This makes me wonder, I was expecting eradication of the truckloads of black money which the politicians and industrialists had amassed. Instead, the axe came down upon the aam aadmi, again.

5 Likes