There has been cyclical distress in sectors like corporate banks, telecom and pharma. So profit of companies like SBI, ICICI, Axis, Airtel, Sun Pharma, Dr Reddy and Lupin are either depressed or negative. That is making Nifty optically more expensive than reality.
The distress is real, not illusory. So I don’t understand why you say Nifty is “optically more expensive than reality”.
And the distress is not cyclical either. Pharma and Telecom are non cyclical sectors, in Banking the distress is far more than what a normal cyclical downturn warrants. It is clear that the rise of Nifty has so far not been mirrored in earnings. And we don’t know about the future.
Hi,
A novice investor here. Found an interesting video which makes the case that we cannot compare Nifty P/E from two different times (without accounting for interest rates)
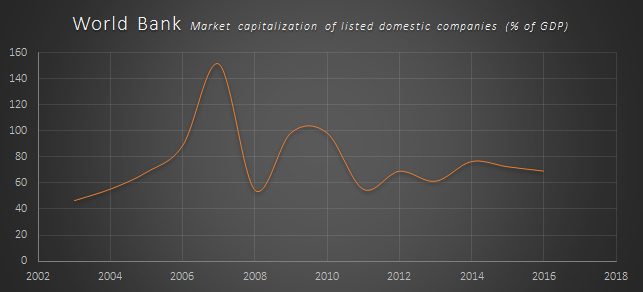
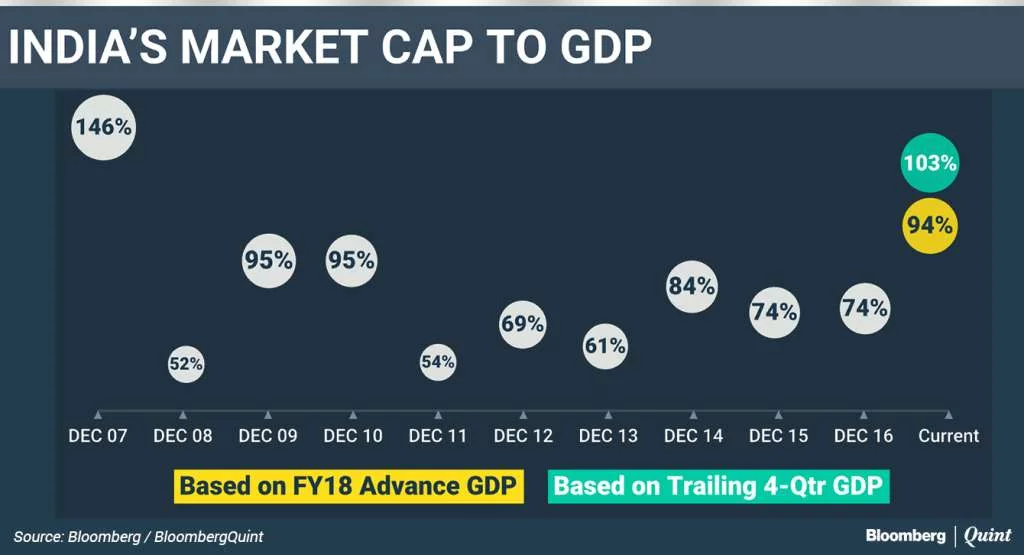
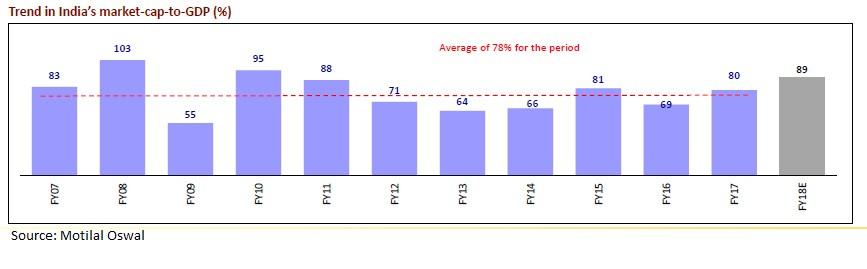
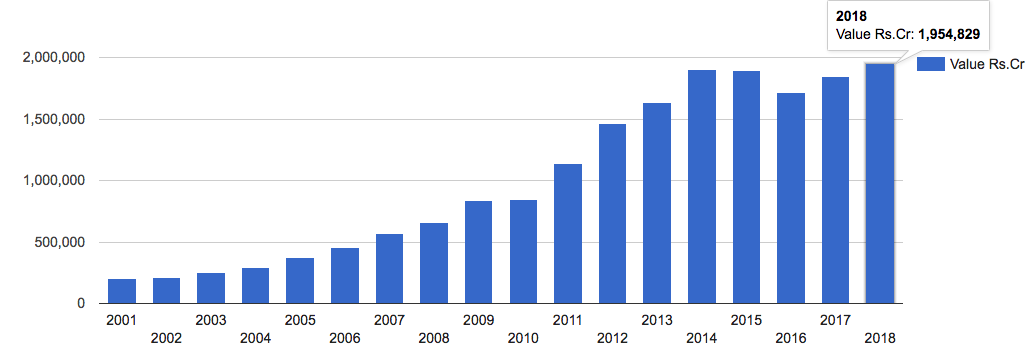
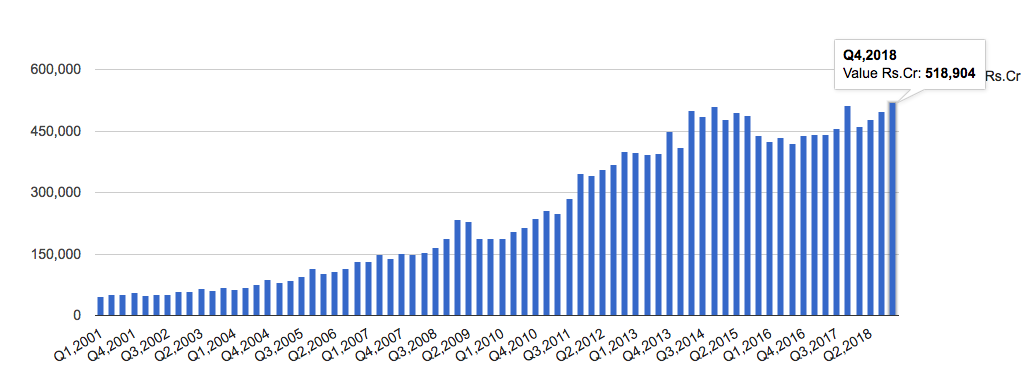
Instead suggests Mcap to GDP as a better indicator for market overvaluation
I have been following this ratio but I have been unable to compute it myself from the data which I have found. But a couple of sources give the following data. The important point to note is that the trend on this is also high (my hypothesis). Not that the PE levels are in 99th %ile these days. But from an index perspective all roads lead to Rome. Personally I am treading with caution.
In a country like India where GDP consists of the growth from unlisted and unorganised space, unless we know the figures of how much do the unlisted and listed space contribute to GDP respectively, it would be difficult to use M.Cap to GDP as a gauge to judge the expensiveness of the market.
Do such figures exist ?
While it works good in US, guess even buffett would have not relied on this ratio so much had he been actively investing in India.
Q4, FY18 exports as well is at a all-time high. It is quite possible that the rupee is aiding the recovery, along with the commodity prices. This is just one small piece of the earnings puzzle since it concerns only commodities and only exports at that.
We believe that India’s price-to-equity multiple is at about 12 times normalised earnings versus the headline multiple of 18 times. - Morgan Stanley, Ridham Desai
Since it is the season of quotes by Mr Buffett and Mr Munger. Here is WB’s take on Beta.
Constructed by a nerdy-sounding priesthood using esoteric terms such as beta, gamma, sigma and the like, history based models tend to look impressive. Too often, though, investors forget to examine the assumptions behind the symbols. Our advice: Beware of geeks bearing formulas