
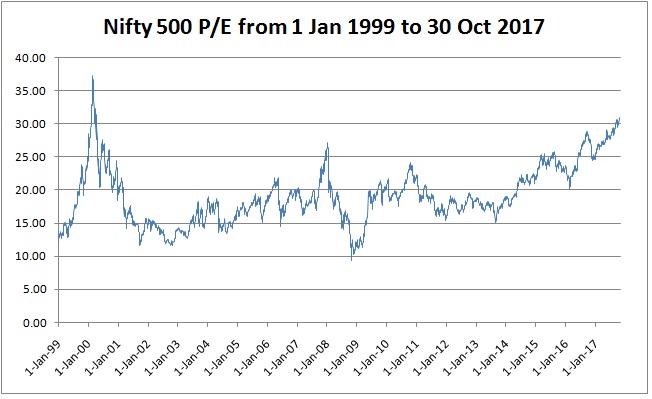
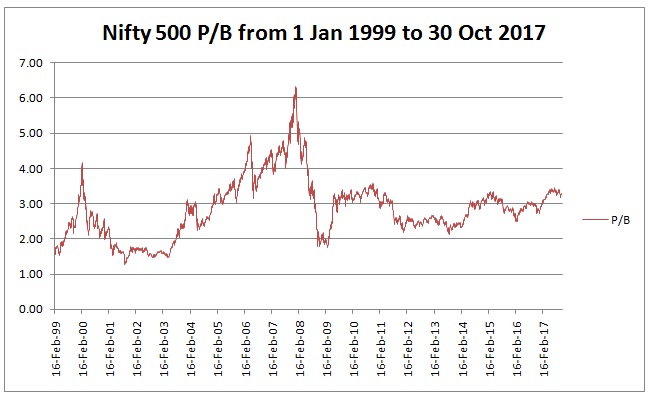
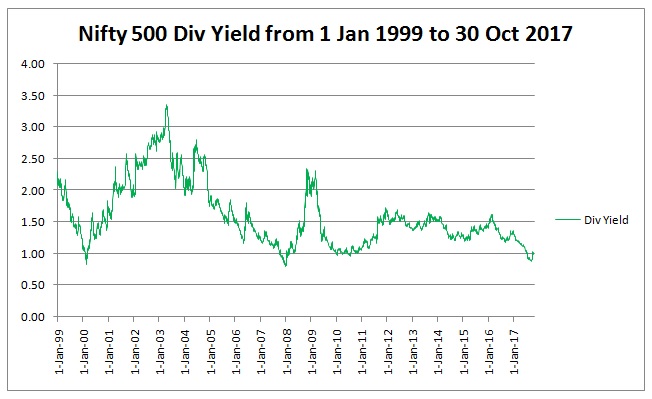
Just to expand the scope of our discussions here, herewith uploading the historical PE, PB and Dividend Yield charts of Nifty 500. Nifty 500 represents more than 95% of the free float capitalization of NSE and I personally think that its a better barometer of investor sentiment than Nifty 50 or other small indicators as there is very low probability of a single stock or a group of stocks distorting the data due to large sample size.
All data has been downloaded from NSE website and chart has been prepared by me in Excel.
Opinions of all fellow boarders highly welcome.