
Isn’t this what SIP is designed exactly for?
Sir Good Point. SIP is designed for people who cannot invest time understanding investing in detail or follow every development with a company they invest in. Not their fault, they have to invest time understanding other stuff more important to them.
It is not designed for many of us who spend hours a day seriously learning investing.
If that was not the case, let’s all just SIP 
But that aside, SIP is still a good idea but if started with a fair value stock and with the plan to keep adding as long as available at upto fair value.
I have a list of 100 stocks. All I need is 2-3 of them to come into the fair value range when the sentiment is negative with no fundamental change in the business.
3 Likes
People that think they can predict the short-term movement of the stock market — or listen to other people who talk about timing the market — they are making a big mistake - Warren Buffett
We try to focus on the value of businesses, not convoluted economic forecasts or intricate market-timing techniques - Charlie Munger
Far more money has been lost by investors preparing for corrections, or trying to anticipate corrections, than has been lost in corrections themselves - Peter Lynch
Let’s say it clearly: No one knows where the market is going-experts or novices, soothsayers or astrologers. That’s the simple truth — Fortune
To summarize, buy when you have money, sell when you need money!
1 Like
“In the final chapter of the ‘Intelligent Investor’ Ben Graham forcefully rejected the dagger thesis; “Confronted with a challenge to distill the secret of sound investment into three words, we venture the motto, Margin of Safety.” Forty two years after reading that, I still think those are the right three words.” Warren Buffett. (Source).
I feel everything is good for a price. Even someone with almost impenetrable moat like Walmart did not give positive return for a decade from its 2000 high.
1 Like
For every such example, there is a counter example. I bought Gruh in wife’s portfolio in December, 2014. All her money was in liquid funds till that time and I convinced her that Gruh is a stock we can keep for 10 years. Over 10 years, it will do better than FDs at least. We bought 20% in her portfolio and it went up to 400 where we sold. Now its 500 plus. Let’s say it corrects 50% and goes to 250. Even then it will be above the price where I bought and that when Gruh was very expensive in Dec, 2014. And if your counter argument is that at 500, Gruh is at the price where no returns will come for next decade, then one brokerage tracking the stock - Motilal Oswal - has put its fair value at 450. So either one can wait for 10% correction of start buying in SIP now.
1 Like
@valuestudent excellent thought process sir, you have, in a brief answer, expounded, what we have to look for and how we have to react in different market scenarios. I feel proud to be a part of this excellent community.
1 Like
It all depends on the thought process through which one invests, I guess. When I started investing 12 years back, I tried all sorts of things. Buying on dips, buying on the basis of technical indicators, buying beaten stocks with good fundamentals, doing SIP in stocks etc.
One strategy that has the stood the test of time and I now exclusively use is like this : I have seen every two to three years there is a panic event in the market. It has happened in March 2009, December 2011, August 2013, February 2016. When that event occurs, I liquidate my liquid funds and collect all the idle cash I have and deploy all of it within one month, except for August 2013 which I missed because there was some issue with SBI demat migrating from Motilal Oswal to SBI and my trading account with MO was not linked to SBI demat.
Now how do we know we are at the bottom. The funniest thing happens here. I use CNBC as a contra indicator, When even the most bullish analysts there ask you to sit on cash and avoid catching a falling knife, I find thats the time to enter the market. This process never let me catch Avanti Feeds or Kitex but it has given me Finolex Industries @ Rs. 48, Yes Bank @ Rs. 250 (pre-split) and GIC Housing @ Rs. 68. If you think I am bragging about it, remember this process also made me buy KSK Energy @ Rs. 36 and I have suffered a total loss of capital. It was such a high conviction buy that I allocated twice my average capital.  . But the winners have more than enough compensated for the losers.
Till 2014, I was under the impression that I am a pretty good fundamental investor. Then I started visiting valuepickr forum and found limitation of my mental bandwidth. Some of guys here are far far more smarter than me. So I feel my strategy is okay for an average person like me.
So when I sell, my selling strategy is like : when market is at a high and my stock’s PE crosses 35-40, I start liquidating my holdings and shift to liquid/ultra short fund.
Any suggestion to tweak this strategy to generate higher returns is highly welcome.
11 Likes
The only strategy is to find good businesses. Taking your own example, the pre-split peak price of Yes Bank was 500 (last peak before it fell to 250). You bought at 250. A SIP investor who started investing at the worst possible time - 6 months before the 500 peak and 6 months after the 500 peak - would have averaged around 350 or 400. What made money for such investor and you as well is that Yes Bank went up 4 times from its previous peak (unlike KSK where everyone would have lost). So a perfect timer like you made 7 times. A worst case SIPper got 5 times - without the anxiety of sitting out and without depending on the luck of being able to time the market well.
3 Likes
Yeah, very true. It also taught me two more things. One, high debt is universally bad, no exception. Two, more than 95% of turnaround stories are just that, stories only.
And one more thing, buying or at least trying to buy near the bottom, even when I fail, provide me a sense of achievement which I would lack doing the SIP even when the financial returns are similar.
You are absolutely right. here are some of the negatives I see at the moment
- Biggest negative is the lack of earnings growth. Earnings is what makes stocks valuable in the long run. I have spent an enormous amount of time trying to evaluate aggregate earnings growth just to reconfirm if the earnings growth is indeed missing. Depending on which companies you exclude from your aggregation, aggregate earnings growth looks different but overall, earnings are growing at single digit rate. We need earnings to grow at least 15%.
- Primary market is showing signs of froth. Historically primary market (IPOs, FPOs, QIP etc) has peaked when secondary market has peaked. IPOs are being priced aggressively and still getting oversubscribed. Not all is bad though. companies going public are still quality companies (well, most of it). I will get worried when bad companies are able to raise humongous amount of money at high valuation (remember reliance power?).
- Volatility is low. This can be good or bad depending on your perspective. A low volatility is a sign of stability or it can also be sign of complacency. I think it is a little bit of both. A clam before the storm. On the other hand, a low volatility is also a sign of difference of opinion which is good for the market. If everyone is bullish or everyone is bearish, market will swing widely above or below fair value. A difference of opinion causes market to trade close to fair value.
- Banks are saddled with bad loans. NPA issue is widely known and until recently limited to PSU banks. Now some private banks are also showing signs of distress. If NPA crisis escalates, it can cause an all-out credit freeze something that happened in US in 2008. However our central bankers have learned from their counterparts so they will contain the situation.
- Credit growth is weak. Banks are flush with money but there is very low demand for credit as businesses are working through their overcapacity and not building fresh capacity. Banks are also reluctant to lend due to their weak balance sheet.
- Capex growth is weak. consumption is driving GDP growth. However, consumption is one-trick-pony. We can not consume if we do not produce. and to produce we need infrastructure and assets. both are not getting added at a sufficient rate to keep the GDP growth at its potential.
- Government is on a fiscal consolidation track. This can also be a good and a bad thing. When government is holding back its spending, several businesses that depend on government do not do well. On that other hand, government is also the least efficient spender.
- Global markets (especially US) are already on a multiyear bull market which can end. This is pure speculation but still a possibility.
- Interest rates appears to have bottomed out in 2017. further reduction in interest rates is unlikely. Inflation also appears to have bottomed out.
As a long term investor, we cannot be a perma-bear. My experience is bears become even more bearish when markets drop as their thesis is being validated. Whereas they should be switching from bears to bulls as markets go down. As markets go up in the long run, I think being a perma-bull will serve investors better than being a perma-bear.
33 Likes
Wow!! Truly impressive, sir. My initial thought at addressing the post to you was if we shake you a bit, you will drop some more unique perspective and ideas. Fully validated. 
1 Like
Dear Yogesh
Very well put. Excellent Analysis.
Just to get a little more insight into your throught process on what might happen
in the coming days, I have listed a few of my questions. Hope you could share your views.
-
lack of earnings growth.
- What are the causes?
- What will cause a turnaround?
-
signs of froth in primary market.
Agree; seen similar euporia in 1992 (India) and 1999 (US). -
Volatility is low.
It is a new parameter, which is not widely popular 10 years back.
Is it the “Fake News” of financial word? -
Banks are saddled with bad loans.
Recapilization would declog the situation.
As it is a zero sum game, who will be the losers? -
Credit growth is weak.
Recapitilization would bring the turn around. -
Capex growth is weak.
Why? - Is it because of lack of credit? or any other factors? -
fiscal consolidation on track.
Infrastructure spending announcement recently; how would it affect? -
Global markets
Euro area seems to be more volatile than US; your views? -
Interest rates
Will it raise slowly or rapidly?
How high?
2 Likes
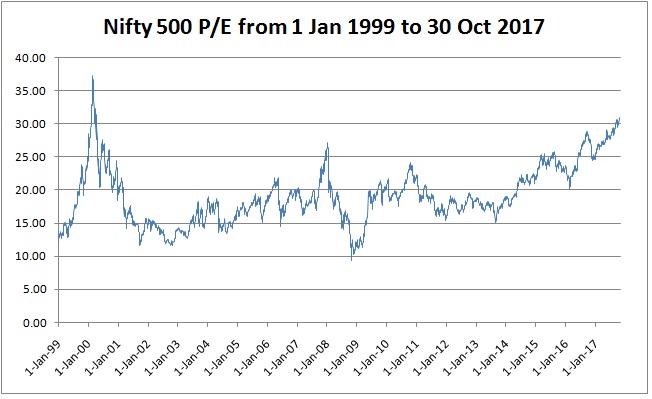
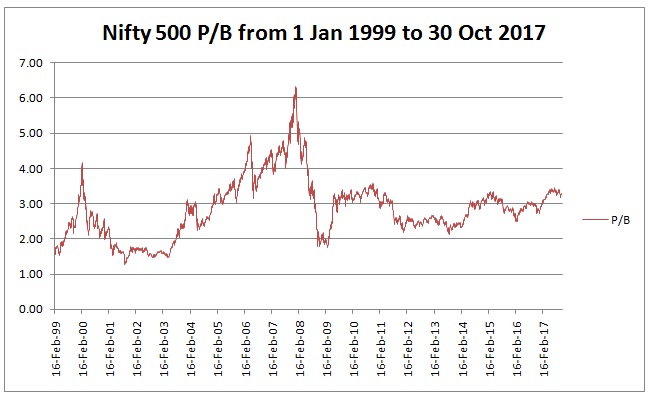
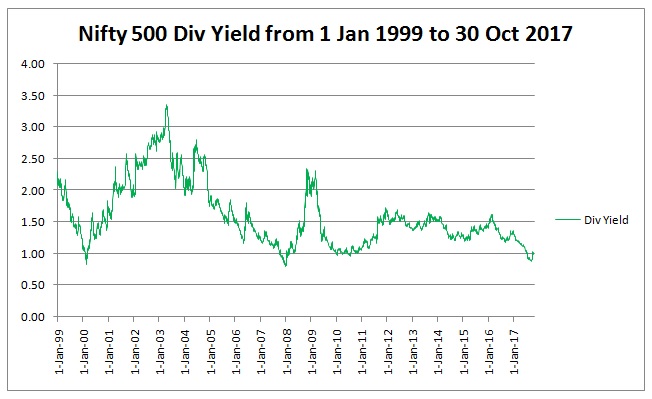
Just to expand the scope of our discussions here, herewith uploading the historical PE, PB and Dividend Yield charts of Nifty 500. Nifty 500 represents more than 95% of the free float capitalization of NSE and I personally think that its a better barometer of investor sentiment than Nifty 50 or other small indicators as there is very low probability of a single stock or a group of stocks distorting the data due to large sample size.
All data has been downloaded from NSE website and chart has been prepared by me in Excel.
Opinions of all fellow boarders highly welcome.
12 Likes
If you can, add earnings to the PE graph, it would provide alot of info.
Earnings are the denominator in the PE graph. As earnings rise, price also rises. I have provided the PE graph to show the relative valuation of the market, whether investors are bulllish or bearish. I dont think stand alone earnings graph here would be of much use though you can calculate it by : Index Value/PE at any point of time.
An earnings graph in conjunction with PE graph would reveal period when returns came from multiples expansion, from earning expansion, and also reveals periods when earnings growth coincided with multiples contraction.
Doesn’t happen always.
3 Likes
AFAIR the PE numbers on Nifty used to have standalone earnings not consolidated so please check for that. If these are standalone earnings then this chart is irrelevant.
I presume it’s consolidated, but no way to be sure as found no information regarding this at nse website. @Yogesh_s may be able to guide us further and let’s know what is the divergence between consolidated and stand alone ones, but back of the envelope calculation says it shouldn’t be more than 10 percent.
Even when it’s stand alone earnings or consolidated, there would be no change in dividend yield.
These numbers appear to be for standalone financials. The difference between standalone and consolidate could be substantial (20 to 30%). But, we should reach the same conclusions whether we measure the trend of standalone earnings consistently or consolidated earnings. I think that the differences would arise if there has been a structural shift in firms preferring to get consolidated, etc. It may be harsh to say that the inferences based on standalone earnings are irrelevant.
1 Like
Hi,
If the PE data in NSE site is based on standalone financials, a better metric to assess the valuation will be PB ratio. If PB ratio is considered markets are still not expensive. At 2008 peak PB ratio touched a high of 7.99, where as now its only 3.2