
Though above article is in reference to S&P one can take some general concept wrt indian markets too.
Disclosure: I don’t take NIFTY PE too seriously rather as one of the guidline
Dear @diffsoft,
Your computation was very helpful.
After nov 19, did you publish your computation of nifty PE? Do you have computation after FY20 results and would you mind publishing it here?
No I haven’t because I just felt that Bloomberg was good enough, now that the discrepancy was reduced.
I can do that, except I was afraid it would commit me to doing it every quarter, with not much interest. But will put up FY 20 soon
Thanks!!
5 Likes
-
Attached is the Nifty PE computed as on 31 July 2020, with earnings until FY 20. Subsequently Nifty constituent has changed with Vedanta moving out and HDFC Life moving in. Nifty PE Q1 FY21 for valuepickr.xlsx (51.5 KB)
-
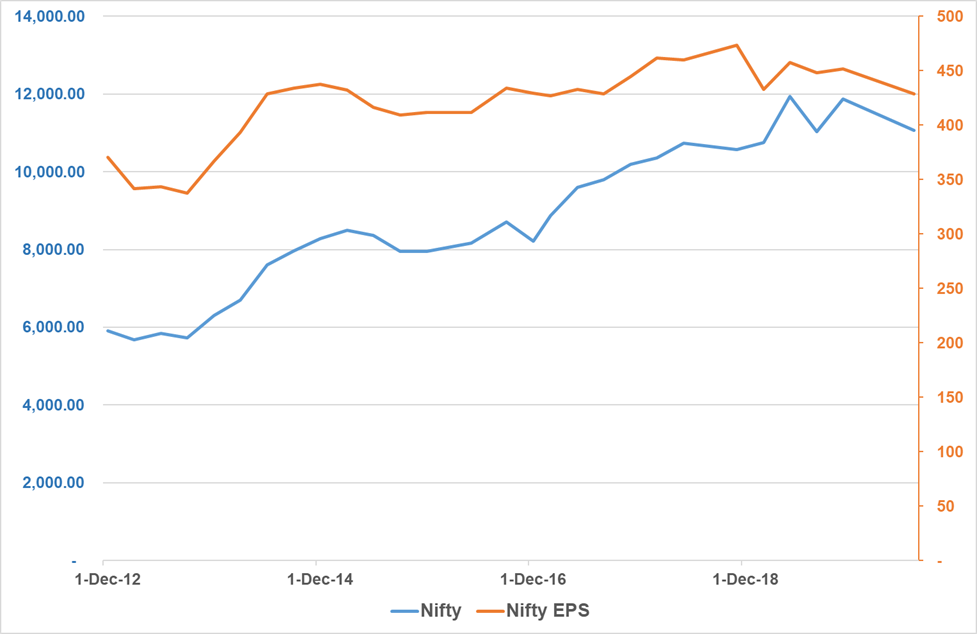
The Nifty PE / EPS look like this:
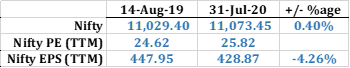
- And the long term picture looks like this. Since Dec 2012, Nifty grew 8.6 % pa, its EPS grew by only 1.9% pa. One may conclude that it’s not earnings but low interest rates that’s been driving Nifty valuations.
Feel free to ask any questions.
Edit: Uploaded the correct file
12 Likes
You may want to look at the notes in the Excel file.
Reported PAT figures as per “Profits attributed to owners of the company” for consolidated, PAT for standalone.
I suppose this means consolidated, except quarters where only standalone numbers are available?
That’s correct. In the process I realized that (a) I uploaded the older file, and (b) my notes are not clear. So it’s “Reported PAT figures as per “Profits attributed to owners of the company” for consolidated else PAT for standalone”
3 Likes
A New ratio to look and arrive at the Nifty PE, is expensive or is it time to sell:
3 Likes
@diffsoft I am struggling with Nifty 50 EPS growth yoy for q1fy24. The article below by Economic times quotes Motilal Oswal saying that Nifty earnings for 1QFY24 grew by 32%.
But according to Trendlyne.com the Nifty 50 EPS on 25 Aug 22 was 837.59 and on 25 Aug 23 it is 876.52 which implies an yoy growth of 4.6%.
I could not understand why such a stark difference in the above two calculations?
Any help will be appreciated.
Thanks
Gaurav Agarwal
While good to keep nifty pe as a reference point. The bubble could be in the larger market (i.e. mid, small caps) so that’s good to check too.
Also markets generally are fwd looking and the price can go up before the earnings catch up, so there could be lag effect. Good to compare it with p/b and dividend yield trend as well
@Gaurav_Agarwal I just eye balled the numbers of stocks comprising the Nifty.
Motilal Oswal figures are (haven’t worked them out) quarterly Nifty EPS growth between June 23 and June 22 quarter
Trendlyne Nifty EPS that you see is trailing 12 months, y-o-y. So you may be comparing the wrong figures; i.e. quarterly figures y-o-y and yearly figures (and I think both numbers are correct). Now if you want to compare Trendlyne with Motilal, look at Trendlyne EPS on the day when you are sure all results for the previous quarter would have been declared and work out the EPS
Bloomberg (which I believe to be the most accurate) shows Nifty EPS as 855.75
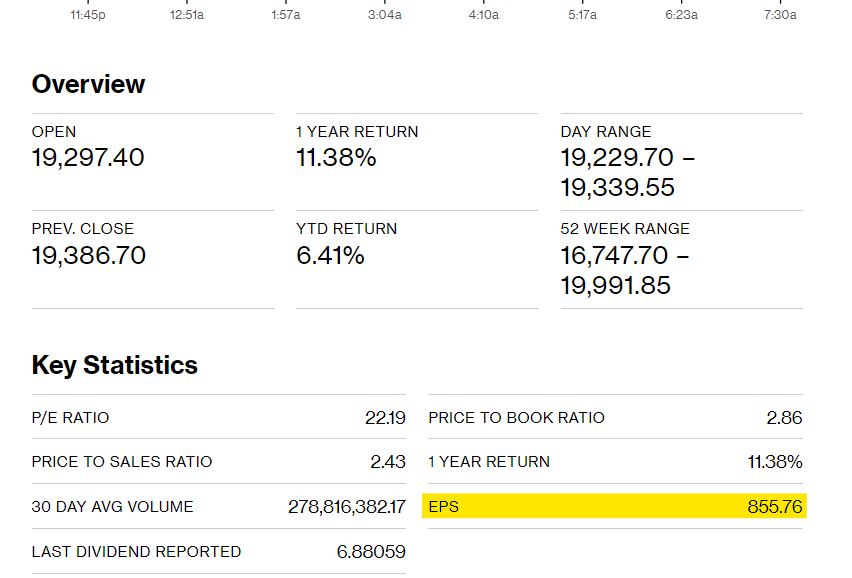
Hope this is helpful
P.S: Edited to correct for wrong terminology
4 Likes
Accrording to Trendlyne Nifty EPS on 15-Jul-23 is 816.55 and on 25-Aug-23 it is 876.52 which is 7.3% growth q-o-q still no match for 32% growth mentioned by Motilal Oswal.
Let’s take some illustrative numbers
Company A had FY 23 EPS as 100, trailing 12 month EPS ending June 23 as 108. Let’s assume its EPS number every quarter is 25 for every quarter except for the June 23 quarter, which is 33.
There fore, EPS growth for the quarter ending June 23 is 33/25, which is a 32% growth (so Motial says 32%), but EPS for FY 23 was 100 and EPS for 12 months ending June 23 was 108, an 8% growth (as shown by Trendlyne).
7 Likes
I got your point. I believe your calculations were of immense value to the community. I would request you to reconsider you decision of not doing them.
It will add great value to the community if redo it for the past by quarter and give us some depth into nifty EPS calculations.
Thanks
Gaurav Agarwal
No positions in Nifty 50 in any form as of today.
Thank you @Gaurav_Agarwal for your kind kudos and holding my work in high regard - makes me feel useful ![]() .
.
Like I mentioned earlier (Nifty PE after all earnings have been declared - #164 by diffsoft) , Bloomberg gives these figures and now so does Trendlyne. So it can be easily sourced for anyone who wants to.
The excel spread sheets can be replicated by anyone who wants to take it from here; and I can help supplying the figures. Very very sadly I have to prioritise my time, so I cannot commit.
Hope you understand!
5 Likes