
Thanks Saru27,
.Saved lot of time for many. Any mention of their inhaler drug Salmeterol in AR?
Started looking deeper into Neuland recently, and as always, the quality of analysis on Valuepickr threads never ceases to amaze. Found amazing amount of details in @FaizMemon’s and @suru27’s posts on AGM’18 and AR20 notes… saves hours and hours of reading!
Though as Faiz mentioned in his post that real estate project is a distraction for management since in its not a part of the core business. However, given that the project is in a key commercial zone of Hyderabad, wanted to dig deeper to find out more and also to evaluate the size of the potential real-estate gains, even though it may be a one-time gain, if any. Also, apologies upfront, since this is not about the core business. Sharing my findings and observations below
-
Project Details : Nanakramguda, Gachibowli, Hyderabad
Address: Plot No. # 4, Sy. No. # 115/35 of Nanakramguda Village, Serilingampally Mandal, Rangareddy District, Telangana state. Plot Area: 5 Acres -
Original Development Proposal
Built up area of 1,74,291.19 Sq.m.
OR 1875373.20 SqFt (1.875 Mn sq ft)
Environmental clearance has been obtained vide order no. SEIAA / S / RRD – 151 / 2015 dated 03-10-2016
So the original plan was to develop about 1.8 million sq ft of commercial space. However, this was later revised as shown below -
Updated Development Proposal
Built up area proposed to be increased to 2,27,308.43 Sq.m
OR 2445838.70 SqFt (2.445 Mn Sq Ft)
Parking space for 2000 cars and 2600 bikes
Total 94,517.05 Sq.m. (71.2 % of total floor area) of Parking area will be provided -
Revised plan involves construction of IT/ITES as per following configuration
a. Block 1 - 7 Stilt floors + 17 upper floors + mumty
b. Block 2 - 7 Stilt floors + 12 upper floors + mumty
c. 2 Common basements -
Project timeline to be 38 Months, starting from the time approvals are received and construction starts
-
Above details and more can be found in the document at the following link. Its a proposal for environment clearance, so contains lots of details
http://environmentclearance.nic.in/writereaddata/FormB/EC/EIA_EMP/240120185CZ25WPYAnnexure-documentofEIAEMP.pdf -
So, given the project and its dimensions, what is the gain for Neuland for it? Lets look at that now. Neuland has an agreement with Phoenix group, a real-estate company from South India.
-
They have a JDA (Joint Development Agreement and a subsequent SDA (Supplementary Development Agreement), as per which the gains will be split as follows
a. Neuland entitled to fixed leasable / saleable area of 0.33 million sqft if the project is developed with total leasable / saleable area of 1.7 Mn sq ft (19.41% of total built-up areas)
b. Neuland will be entitled to an additional share of 23.2% of leasable / saleable area achieved over and above the 1.7 Mn sqft. So if the new development plan is approved, Neuland’s additional share will be 1,73,034 sq ft, bringing its total share to 503034 sq ft. or 20.56% of total project built up area
I tried to search further to see if the revised plan was approved, but as of today, the Telangana RERA website has been down, so could not verify that. So as of now, lets assume, the new plan was cleared. -
Subsequently, the 2 parties signed a SDA. As per the SDA, company could request developer to arrange for sale of a part of its share, and the company requested the developer to arrange for the sale of 0.12 mn sqft out of company’s share. To comply, the developer nominated Star Bio Products LLP and Premier IT Developers to acquire the 0.12 mn sqft out of company’s share on terms that shall be agreed to between developers nominees and the company
-
Link to details shared above can be found in document below
https://www.neulandlabs.com/wp-content/uploads/2017/10/Update-on-Nanakramguda-Project-21-05-17.pdf -
So from 8 & 9 above, it appears that Neuland has planned to retain 383034 sqft of its share of built up area, while selling 1,20,000 sqft to the developer’s nominated firms at the terms to be agreed between them. [Assuming 2.4 Mn sq ft of development).
-
Not sure of the current prices of commercial real-estate in that area, but knowing that this could be well in region of 7000 - 8000 per sq ft (likely more), it could mean substantial gains for neuland, compared to its current PAT.
-
However, for data triangulation, I also checked the AR FY19, and found something peculiar there (Page 114, Note 35). Text extracts reproduced below
“Further, in accordance with the terms of the Arrangement, the Company is entitled to a fixed leasable / saleable area
of a minimum 3.38 lacs sq .ft, out of which the Company has agreed to transfer 1.20 lacs sq. ft from it’s own share at D0.02 per sq. ft to the Developer nominees on completion of the construction work and has received advance of Rs 2,028 towards the proposed transfer as at March 31, 2019.”
“The Developer has resumed the construction work, based on receipt of approvals and clearances from the concerned authorities.”
“The management, on the basis of its assessment of the end use of its share in the proposed project has classified the entire value of land and balance of capital work-in-progress as an investment property as at March 31,2019”
“Management expects the fair value of investment property under construction is reliably measurable when construction is complete, accordingly management has determined that it shall measure the fair value of investment property under construction at the earliest of either when construction is completed or when its fair value becomes reliably measurable”
From these notes, its clear that
-
1.2 lakh sq ft of property was given back to the developer at just Rs 0.02 per sq ft!! Just why?? Not clear at all.
-
Neuland is still likely to gain the 3.8 lakh of the remaining share of development. Can other boarders from around the hyderabad area put an approximate value to this?
-
Also, I am not an accounting expert, so not sure how will this be reflected in the financial statements (as and when it happens). Will it show up on P&L as one-time gain? Or any other way?
DISCLOSURE: Not invested, but keeping a watch
19 Likes
There is a lot of froth building up in this small cap. For the first time retail investors are crowding out the institutional investors. Case in point this is the retail shareholding data from Mar 2020. Retail shareholders were 22% of the total outstanding share capital.

(Source: bseindia.com)
This is the data for June 2020. Retail shareholders are now 26% of the total shareholding. So a 4% of the company’s shares have changed hands during three months and the price has gone up by 70%!
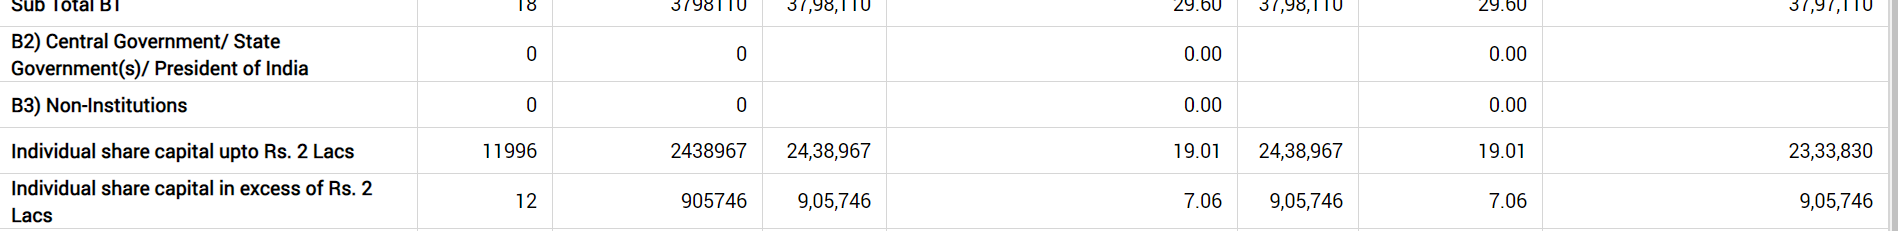
(Source: bseindia.com)
There has been no change in institutional shareholding in this company but i fail to understand whether retail shareholders are confident enough to understand the intricacies of the CMS business model.
I like the business and the management but there are chances that company under performs in the short term and retail shareholders might bail (let’s see if retail investors will stick by the position).
This data just tells me there is a lot of optimism being built in the position.
Disclosure: Exited
7 Likes
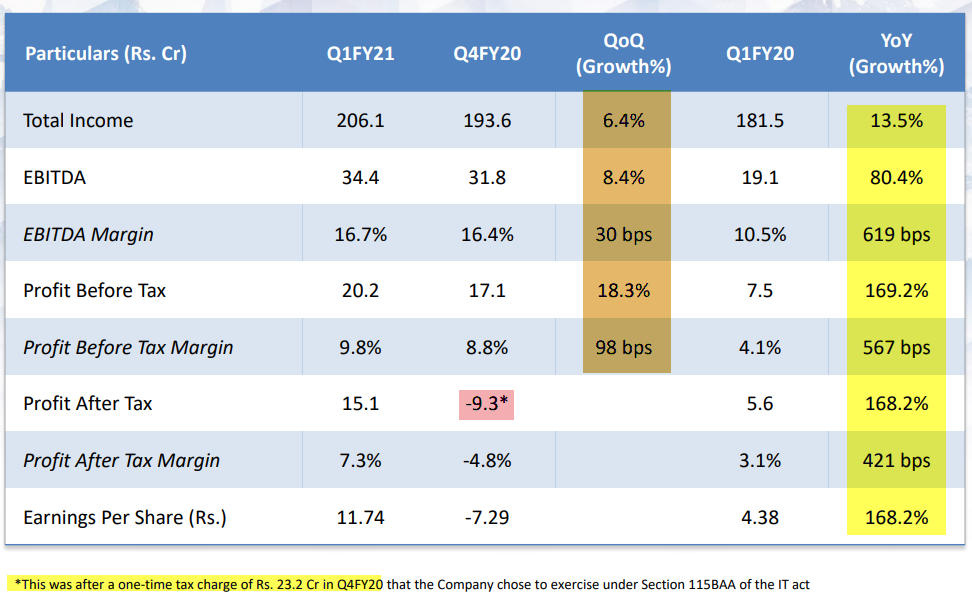
Results:
Presentation:
Quick Notes:
-
Revenue increased by 13.5% from Rs.181.5 crore in Q1FY20 to Rs. 206.1 crore in Q1FY21 (
growth in both GDS and CMS businesses) -
two positives that are playing out - CMS growth is due to both Existing products and development products! - my note
-
EBITDA margin increased from 10.5% in Q1FY20 to 16.7% in Q1FY21
-
Increase in PBT margins by 567 bps & PAT margins by 421 bps
If someone attended the conf call please do share the notes, once i get a chance to go through the call, will share mine…

7 Likes
Neuland Q1 FY21 Concall Highlights:
-Good with regulatory compliance, considering the entrance into complex molecules.
-Margins are sustainable.
-Operating leverage is going to go up, which would increase EBITDA Margins and ROCE going forward.
-Current capacity utlization (70-75%)
-Unit 3 has the lowest utilization ,Unit -1 has max.
-Targeting ROCE of 16-17% .
-Raw material dependence reduced from 45% to 22% due to backward integration and local integration .
-Unit -III for CMS backward integration.
-Blockbuster drug in commercial phase may add significant revenue.
-Targeting 20-22% of EBITDA.
-A lot projects to get commercial in CMS segment.
-Improving margins in prime segment by cost reduction.
-Peptides projects are yet to commercialize, waiting for clarity.
-3 Peptides are under development in GDS business, will file DMFs in next two years.
-Total capex would be 70-80 crs this year, which includes 45 crs of Opex.
-Unit III is ramping up, will start to add revenue.
-Current asset turnover ratio is 2.48, capex would be inline with this ratio.
13 Likes
Thank you @Rohit_Dubey for the notes. I got a chance to listen in, One point worth noting from the conf call was on the topic of backward integration for APIs- the mgmt. comments were that they don’t plan to backward integrate (for newbies - make the raw material (RM) are the intermediate needed to produce the molecule that Neuland needs to produce as the final product) for every single item they need.
Rationale:
- There are a few companies in Japan, US, Europe, China who are efficient players in a particular space who have invested in the infrastructure, have a deep knowledge of making those RM/intermediate molecules that Neuland needs. it would not be the best use of our resources to make it in house when its available at a better rate with time and money saved from sourcing from these players. ( read: would need to invest in infrastructure, get ppl specialized in this area, ramp up time, etc. and still not be able to produce at a lower cost necessarily)
- They plan to locally source and integrate with their supply chain and thus in the bigger scheme of things, reduce the dependence on Chinese suppliers. historically they have been around 45-50% dependent on the Chinese players for the RM. Now they are in mid-twenties from Chinese dependence perspective and they plan to target higher single digits-lower double digits in the longer run.
7 Likes
Thanks for correction ,wanted to write RM dependency reduced on china from 45 to 20-22%.
I find placing links of this website as high quality spamming. Folks promoting regular data as some kind of research. At best these are copy paste jobs of public available data to increase website traffic.
8 Likes
Putting up some notes I made regarding Neuland. These are based on reading latest AR, last 3 concalls and also Q1FY21 investor presentation.
General Summary
Business
Neuland Laboratories is a company undergoing transformation from being a bulk API manufacturer to switching towards more value-added products: specialty (low volume high complexity) generics API manufacturing as well as CRAMS [custom synthesis for innovator molecules] (they are involved in all the 5 stages of a molecule’s life-cycle: Stage 1,2,3 of clinical trials, Development Phase and Commercial Phase). They intend to improve margin on the bulk-API (they call it Prime API) side by cutting costs by improving operations. They also intend to manufacture complex chemistries such as peptides. Some of these will enhance their specialty API business.
The highest growth business for the company is the CRAMS business. It grew by 100% last year. CRAMS contributes 20-25% of business for Neuland right now. Eventually Neuland wants it to contribute 33% of revenues. They want to grow the company at 15-20% per annum maintaining EBITDA margins of 20%. Neuland margins dipped a bit in 2018-19 due to less fungible capacity at their unit 1 and unit 2 (there were too many orders for unit 1 and not enough for unit 2 and this led to a sub-optimal utilization of the factories, including the CRAMS side of the business which suffered. However management seems to have learned their lesson and as far as I can tell, they do claim that plant capacities are more fungible now. In 2021, Unit 3 capacities are coming online. This is a 50% Capacity addition over and above unit 1 and 2. As per management guidance of 15-20% growth, this is definitely going to be enough for 2 years and they only need to do maintenance capex now. Company has had an immaculate USFDA track record over 20 years because they think about compliance actively and work towards ensuring plant compliance.
Management
Management is quite conservative. Several times, the analysts have tried to get the management to commit to high growth rates overall, but management has continually guided conservatively for a 15-20% growth rate. Analysts have requested management to guide for revenue addition due to new capex. Management has chosen to not provide that and instead expertly added that new capacities at the new unit are similar to other 2 existing units. Analysts tried to get the management to commit to CRAMS business growth. Management has not given any growth commitments and has constantly guided for lumpy, volatile order book execution (both QoQ and YoY). Instead of harping too much on Anti-china sentiment, management has been very prudent/cautious about it. They have talked about multi-sourcing, ensuring continuity of supply chain and business operations. Management continued to deploy capital even during slowdown to take advantage of the opportunity which has been presented by the pandemic. Management learns lessons from failures and improves capital allocation decisions. For example: derisking the supply chain post the Levetiracetam China issue (got stocked out which caused severe financial stress). Management does not blindly follow backward integration, they understand the concept of value addition and strategic backward integration.
Valuation
Many valuation measures exist. Due a 1-time tax hit in Q4-2020 (write down of deferred tax assets), the tax rate for Q4 was 154% instead of 25% and hence eps was -7. If we assume normalized earnings (25% tax rate), the TTM P/E ratio of the company is around 26-27. This is high, but for a company with a stable and growing CRAMS business (a sub-industry which has great tailwinds), this is by no means terrible or severely over-valued.
Clientele
Company gets most of its revenues from the USA and then from Japan and Europe. It has all sized biotech companies as clients from japan and mostly mid and small sized biotech companies from the USA. Teva is one of the famous clients for Neuland.
Products
Probably the most famous product is API for ciprofloxacin. Recently the company has started manufacturing peptide chemistry which is considered to be complex.
Major molecules manufactured:
Specialty APIs: Peptides (Linaclotide, Liraglutide, and Semaglutide), Sterile APIs,
Prime APIs: Levetiracetam, Mirtazapine and Labetalol
Proof Based hierarchy of knowledge
On CMS (CRAMS)
[Q1FY21 concall]: Company started showing split of revenue for commercialized molecules versus those under development (experimenting stage). The QoQ results show high volatility. We should look at CRAMS numbers in an annualized manner [proof]. The product portfolio has a diverse mix in terms of market size of opportunities. Molecules that give 5cr a year stable commercial revenue versus those which give 50-60 cr. There can be a few blockbuster ones which give 100cr+ of revenue but this diversity will always be there [proof]
[Q1FY21 investor presentation] CMS Revenue has been growing steadily since last 9 quarters. It grew from 92cr (FY19) to 189 cr (FY20). [proof]
On GDS
[Q1FY21 concall]: Prime growth driven by Mirtazapine and Labetalol. Many products contributed well in the specialty segment. [proof]. One of the complex (specialty) product manufacturing that the company is undertaking is Sterile APIs (page 5). One molecule is already commercialized [proof]. Strategy: Prime API business segment strategy is to add new customers to increase Neuland’s market share across the global market. Specialty API segment, focus is on technology, patents, supplying sterile API, complex APIs, don’t expect too much competition [proof]. 3 peptides (Linaclotide, Liraglutide, and Semaglutide) are under development and management expects to file DMF in 2 years [proof, proof2]. The primary RM for the peptides are amino acids. Company buys them from Companies in Japan, China and India. Complex ones are made in-house (backward integration) [proof].
On general Financials
[Q1FY21 concall]: EBITDA margins are recovering. Achieved EBITDA margins of 17% in Q1 [proof]. Margins achieved are sustainable (modulo unseen one-offs) [proof]. Company guides towards 20% EBITDA margins in the medium term on the back of improving product mix, cost optimization for Prime APIs, operating leverage [proof]. Capacity Utilization of 70-75% today [proof]. ROCE was very low in 2018/19. Expect it to improve to 16%+ in coming years. As new capacities are utilized [proof]. Company will fund maintenance capex through internal accruals. For new capacity expansion company looks for a payback period of 36-48 months (25-33% returns) [proof]. For very specialized projects, Neuland would ask customers for an advance so they don’t need to fund the capex entirely by themselves [proof].
On products-mix
[Q1FY21 concall]: Management is actively working to move the portfolio mix towards value added segments [Proof].
On Business Growth
[Q1FY21 concall]: Growth in Q1-FY21 was driven by all business verticals: Prime, Specialty, CMS [proof]. Growth has been a bit lumpy the last 5 years, specially due to a smaller base of company and also high margin businesses. Much broader base now. Company guides for 20% growth as a target in the next 3-5 years going forward [proof]. Management is expecting a lot of projects to get commercialized in the next 2 years in the CMS front. Going forward, the numbers in this quarter will function as a good base, and the growth will come on top of this [proof]. Pharma companies looking to de-risk supply chain. The resurgence of European API players is not detrimental for neuland or indian API players Neuland competes on chemistry and technical competence not cost of labor or capital [proof].
On FDA Compliance
[Q1FY21 concall]: Company has an immaculate USFDA compliance record due to a culture of putting compliance and safety as #1 priority. Have a healthy level of paranoia [proof].
On the China issues
[Q1FY21 concall]: Neither prices of inputs or outputs of the company have been affected by China disruption. The supply of raw materials has been disrupted a bit. [Proof]. Been hearing from customers about increased focus on India due to China issues, but haven’t seen any impact on Neuland business yet [proof]. In one of the financial years, due to China issues, the company got stocked out on Levetiracetam causing huge financial impact. Company learned its lessons, made strategic moves towards derisking the supply chain (local suppliers + backward integration for critical CMS inputs in Unit 3). Reduced China dependence for RM from 50% 4 years ago to 20-25% now. Plan to bring it down to < 15% in next 1-2 years [proof].
PS: This proof based evidence gathering is a very laborious process. I went through Q1FY21 a few times to gather the proof based statements. Plan to do that for earlier concalls and other artifacts too at some point in the future.
48 Likes
Nicely summarized Sahil.
Adding to your summary, Deuterated compounds can also be critical for the company, because it’s a recurring business for them.
2 Likes
A very good blog about CDMO companies in India:
Important takeaways for Neuland Labs:
- Neuland MarketCap/Sales is lowest at around 1.6.
- Neuland has low Sales momentum (2.75x in 10 years).
- Operating margins grew from 8% to 18% between 2009 and 2017. Then they fell in 2018 and 2019 (due to issues mentioned in my previous post) and started improving again in 2020. They are at 13% right now.
- Material costs (as % of sales) have some down from high of 64% (in FY14) to 50% in FY20.
- Neuland’s subdued margins can be explained: they are heavily investing in building team. Employee costs have increased from 8% to 16% of sales.
- Delta Net block in last 5 years is highest for Neuland. Net block has gone from 123 cr to 653 cr (5x) in 5 years. Most of this capex is funded by debt and not internal accruals.
- A primary reason for Neuland ROCE being low (8% in FY20 and 4% in FY19) is the very low fixed asset turns. From a high of 4x in FY 14,15,16 it is now down to 1.2x in FY20. If Neuland is able to repeat its feat in 2015 then the current sales can increase by 4X without adding Re1 to fixed assets.
- Cash conversion cycle is aligned with rest of industry and much more than Syngene which is market leader in Cash conversion cycle.
Overall, my understanding is that Neuland has leveraged debt to increase their net block 5x in last 5 years. That. coupled with supply chain disruptions in FY18,19 lowered their ROCE (R decreased while CE increased). If Neuland can get to even 75% of peak fixed asset turns (3x), then sales have the potential to increase 3x without any capacity expansion in next 2-3 years. If margins improve as well to 20%, then neuland profits can increase 4x to 5x to 457.8cr in FY23. A lot of ifs and buts. All this uncertainty is what has kept the valuation low, imo.
Disc: Have a small tracking position, planning to invest more in upcoming days.
14 Likes
-
Increase in net block by 5x consists lot of intangible assets (good will) so tangible assets not increased by 5x.
-
5years back CDMO contribution may be insignificant. But now CDMO is significant, in general CDMO asset turnovers are very less. So its not correct to presume asset turns to reach previous peak levels.
5 Likes
Hi Ravindra,
Thanks for adding your thoughts. They are very useful.
Thanks for catching this. If we compared the net tangible assets in FY15 end to FY20 (Net tangible assets + CWIP) (since this tangible assets will come online in next 1-2 years), this number is roughly 3x (122cr to 360 cr).
As per management guidance, CDMO will only be 33% of the revenue stream. This is why the multiplication by 75%. Of course one can also model for a more conservative asset turns by multiplying by a different number. I agree that in general it is difficult to predict whether this would turn out to be 1, 2 or 3.
3 Likes
Hi,
In my pursuit of preparing a structured knowledge base of neuland, I have prepared a topic-wise summary of FY20 Annual Report. I have categorized by Type of Attribute (business updates, business characteristics, Balance sheet, cash flow statement etc) and the actual Attribute (PBT, Margin etc).
Even Summaries of Annual reports are large. So I won’t copy paste it here. Please find it at the google sheets link here:
Although I have read last 3 years of AR, summarizing them in a neat format is cumbersome. I’ve only finished for FY20 right now. Plan to add FY19 and FY18 at the least, over next few months.
 If anyone wants to copy or clone, please feel free to.
23 Likes
Neuland Q2 FY21 income at Rs.242.0 crore; up 29.6%
*EBITDA margins improve by 350 bps
Interim Dividend Rs 2 per share declared.
1 Like
Bumper results from Neuland Q2FY21.
Phenomenal! H1-21 EPS of 29 vs entire FY-20 EPS of 13
Stock up 6% today. Has defied the trend this results season where companies with stellar results haven’t seen price move as much (like Laurus).
After Q2 results, it’s at ~42 TTM PE. Even at a relatively moderate H2 estimate of 20 EPS, it’ll be at a mind-blowing 50 EPS for FY21. At current PE, can easily go upto 2000 by fiscal end
1 Like
We should not go by EPS for neuland. There was a one-off in March 2020 Quarter (deferred tax assets). Track the PBT which has been increasing steadily. Here is a pic which i’m borrowing from Sajal Kapoor sir, who tweets frequently about pharma companies. All credits to him (also linking to his tweet below):
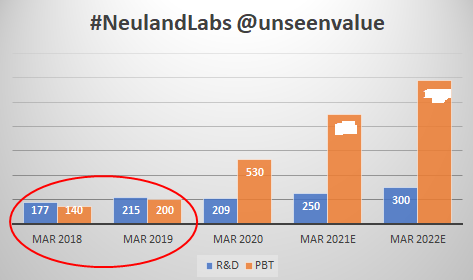
Disc: Invested from lower levels. I’m sharing someone else’s work as is, this post is not a recommendation. Investors should do their own due diligence.
Link: https://twitter.com/unseenvalue/status/1323433965412257792
5 Likes
Yes, do follow him and saw this tweet this morning. Thanks for the clarification. Also, all thanks to him and Punit Bansal that I got introduced to firms like Neuland and Suven.
Disc: invested, not a recommendation
3 Likes
key highlights of the Conference Call
Business Updates:
• GDS and CMS segment both have contribute well.
• Unit 3 will be commercialized in 2 quarter of FY 2021
• Growth was led by Levofloxacin and Levetiracetam
• CMS business was the key driver for growth. Good progress from CMS
CAPEX:
• Expectation of 90cr this year and 60-70cr is done
• No further updates on CAPEX but there will be need
CMS:
• Growth driven by increase in commercial projects which done well. Baseline project done well
• CMS business could be volatile. Overall growth is positive
What makes Neuland uniue in CMS
• Technical capability, where Neuland creates niche.
• Co. works more with biotech company which are big and small size company
• This built strong relationship with customer.
• Working with US Biotech, and Japan.
• Company is ramping up more in generic pipeline.
• Company is gaining market share in GDS business.
• Major performance of today is reflection is the employee and leadership.
• Strong focus remains on organization front.
Industry Outlook:
• API segment is still in nascent stage with huge growth opportunities present.
• Still remain the heart of pharma.
Company niche:
• Many molecules are under commercial stage.
• Neuland has focused more on technology, and good manufacturing strategy.
• 25% of supply come from China and management expect to decrease the share to 10%.
• Supply chain would be key lookout. Nearby customer will be more in focused as well.
• Strategy going forward should be supply chain to get shorten, manufacturing capabilities.
Europe API expansion:
• API scalability in API market is in talks for the last 20 years
• But management wont take that lightly.
• Players of Europe should not compete heavily. They can be winner in 1 or 2 molecule but company will be tough in terms of cost structure as well
Near term focus:
• Robust business plan. Focus to capitalize Unit 3.
• Plans to deploy more capital in unit 3 to fulfill the needs.
Debt or Equity Infusion:
• No needs of equity infusion.
• No need of additional debt
• No Inorganic growth expansion plans
Project Pipeline:
• Teams have been focused more on late life cycle project.
• Added more project on late stage in the last few quarter.
• Focus now remains to increase last stage project
• Also adding early stage project as well in order to continue stability
GDS Market:
• Large part of GDS comes from export market.
• Financial number are skewed towards the certain geographic, mainly because of focus on increasing penetration
• Largest market now are US, Japan, Europe. But this may change as well.
Competitor losing market share and increase in demand:
• Less pricing pressure.
• Europe is dependent on lot of raw material from China. Hence shifting the customer
Low margin in GDS business:
• Margin are product dependent on. There are certain product whose margin of GDS product are more than CMS but product diversification leads decrease in margin (inclusive of commodity type product).• Company do product by product analysis. Little part of margin expansion is there. With scalability of Unit 3 margins can even increase well, coupling with decrease in cost structure.
Market share:
• Some products 70-75% world market share and in some 10%. Hence overall market share vary.
• They are sticking to their portfolio.
• Trend of integrated pharma cos. are looking into API source in substitution for in house manufacturing which is increasing demand
• Pricing pressure was not that much but they are cautious, they are seeing reasonable increase in market share.
• Mgmt is focusing on cost reduction to remain in the market ahead.
Shift from China:
• Customers are dropping the China.
• There are certain products where china was the leader or the primary source but now co. is seeing that business coming back.
• Company is looking for many molecules opportunity with available expansion to grab this share,Raw material: Year ago faced huge challenge in sourcing raw material from China. However company is optimizing the cost and looking for alternate source of looking from India and other country.
This resulted in raw material cost remained stable, and gross margin remain on hold.
Capacity Utilization- Average utilization of around 65%.
• Already deploy 55 crores on capacity.
• Goal is to keep utilization less than 70% to manage the uncertainty and unseen demand.
9 Likes