
No idea but this is pretty much the norm here. When it falls it falls roughly 20-30%. Last fall it went up to 35%. It has oscillated between 6-8 P/E and I think it will continue to do so as long as disclosure levels remain poor.
1 Like
Old case not paying the dues to employee
https://indiankanoon.org/doc/124282300/
in lite of the above case when a company is not satisfying internal stack holders how one can expect to be fare to retail investors
I may be total wrong in my interpretation … M/s Dujodwala Resins & Terpenes Pvt. Ltd is related party belong to the group
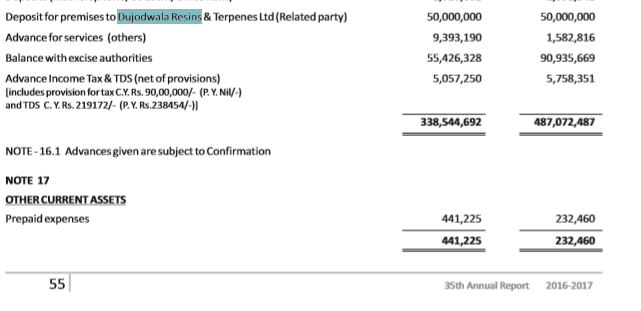
The company is not proper records of assets and inventory BIG BIG REG FLAG from last couple of years
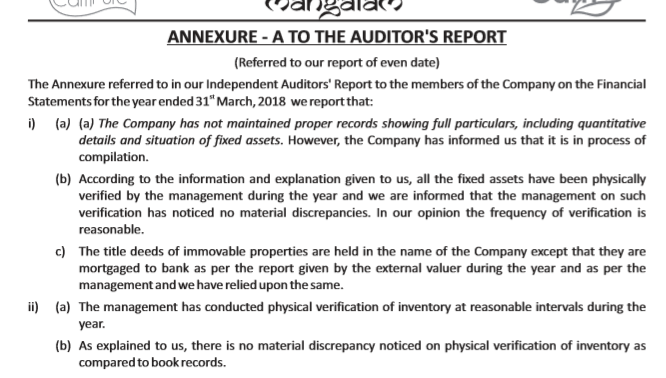
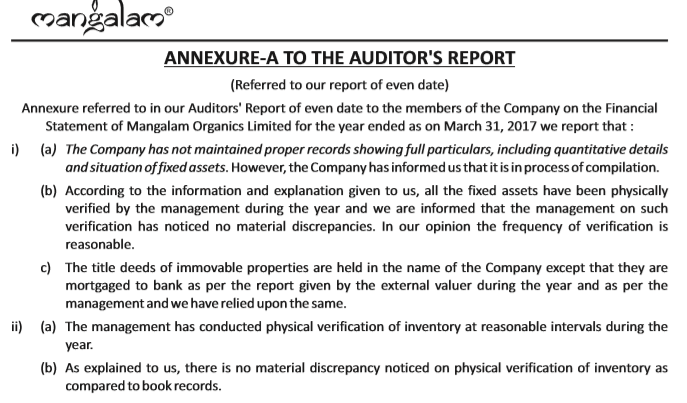
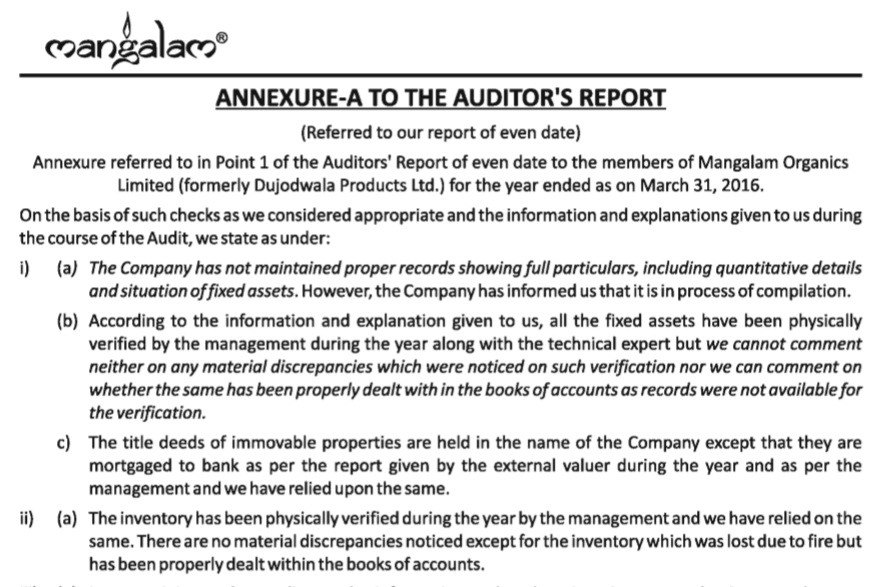
lazy REPORTING AND MOSTLLY annual report copy paste except numbers
TAX and DEATH are inevitable but company has lots of pendency legal amounts PAYABLE which May hunt it in FUTURE and will hammer very heavily
Disc; Not holding and i am not sebi approved analyst This is not any Buy sell recommendation
14 Likes
The stock is clearly in the grip of operators who are keen to take it to lower levels while accumulating. The Co. has just had the most incredible year. Looking ahead, with expansion coming on stream shortly & Camphor pricing holding firm, the performance in the current year is is only going to get better. The operator is clearly working on the psychology of the retail investors who do not buy on lower circuits.
I have personally started accumulating again & intend to add if the stock goes lower. Operators play this game to make money. At some point, the trend will reverse & the stock will start hitting upper circuits & again retail will not sell! Investors who stay invested or better still, add at current levels could end up doing very well for themselves, but do remember to return the shares to the operator at upper levels!!
15 Likes
There has to be a reason for this stock to fall almost 35% despite posting good q4 results and that too with the seasonality in the business the qoq comparison is not the right metric to consider a point which has been elaborated upon by @phreakv6 and others but can this be only due to the myopic view being taken by some shareholders who possibly are sitting on gains after the run up seen in last 2 years …promoters have bought at 510-520 levels just prior to results … but still this is not prividing support …makes me wonder if the underlying theme or structural story has seen some issues ( data doesn’t indicate so ) …so the only argument is Mr market not pricing this fairly ??
Disclosure - started investing in this downturn and accumlating …
1 Like
1 Rs dividend offer can be the reason, peanut distribution will not attract big money. Also the company is rising from shades, very difficult to make up mind if it is a winner or a spinner. Wait and watch for now seems bottoming out… If falls further will find support at 350 only.
1 Like
Mangalam continues to fall like a pack of cards even after blockbuster results and corrected over 35% from its high after result. Worry is it is falling with volume which means some big investor/s selling? Can seniors share their thoughts here. Are we missing something fundamental here?
If management is confident of their future business and are walking the talk, I would hope they should buy their stock from the market. They bought at 510 and I see no reason they cannot buy now when the price is down 25% from their last purchase price. Would give a big booster to share holders as well. Many thanks
Disc: Invested
2 Likes
3 Likes
@phreakv6. Great analysis! What clearly comes out is that Q4 performance is very good, with just a 12% decline in sales in Q4 over Q3, which over the last 5 years was more in the range of 50%.
I guess what has justifiably disappointed the investors is the low dividend of Rs. 1/-. Here, one needs to understand that the Co. has almost doubled its sales to 425 crs from 244 crs. It also means that its working capital requirements will also go up accordingly, with higher inventories, higher debtors, etc. etc. In addition, the Co. has invested almost 25 crs in the year on expansion with very negligible increase in debt. This has probably led to some sort of liquidity issues.
A smarter mgt. would have funded expansion with term loans and increased borrowings to align with growth in sales. This would have enabled them to give a hefty dividend, more in line with its financial performance. The good news is that the Co.'s performance is on track, & with the expansion coming on stream shortly, one could reasonably expect a 15-25% growth in sales in 19-20, so one could reasonably expect atleast a similar growth in the EPS for the year.
Also, a smarter mgt. would also have stepped in & bought more shares when the price fell. After all they saw merit in buying a decent chunk @ Rs. 511, not so too long ago. Mgt. reluctance to be more transparent is not helping matters here.
13 Likes
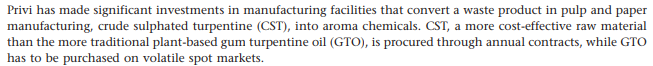
Interesting development happening in the aroma chemical industry:
Source: https://s1.q4cdn.com/293822657/files/doc_financials/annual_reports/2018/Website-Fairfax-India-2018-Shareholders-Letter.pdf
Ayush shared it during his IIC 2019 presentation
Not sure how much of GTO would Privi be consuming as raw material. Such development may decrease demand for GTO and also it’s price. With falling raw material prices, final commodity product camphor price may also fall. However, falling GTO prices may benefit MOL by expanding margins in its value added FMCG products.
Lots of ‘may’ in above few sentences. I don’t have anything to prove it with numbers and whether it can benefit or hurt MOL. Just thought to share it here so that folks are aware of the developments and brainstorm the possible impact.
Disc: invested
6 Likes
Related party transactions disclosure - https://www.bseindia.com/xml-data/corpfiling/AttachLive/2a05903d-a463-4812-9f23-1fa050685ef6.pdf
What can be inferred from this.
Nothing much that wasn’t already known. The promoters took hefty salary increases last year. The rent deposit used to be 5 Cr last couple of years. Looks like they have reduced it to 1.5 Cr, which is not bad. Maybe they reduced the back-door takeout since they are taking more through the front-door now 
5 Likes
The only thing I would ask all to be aware about the sustainability of the margins.
3 Likes
Mangalam Organics Credit Rating agency report. Mangalam Organics Rating Rationale.pdf (172.7 KB)
4 Likes
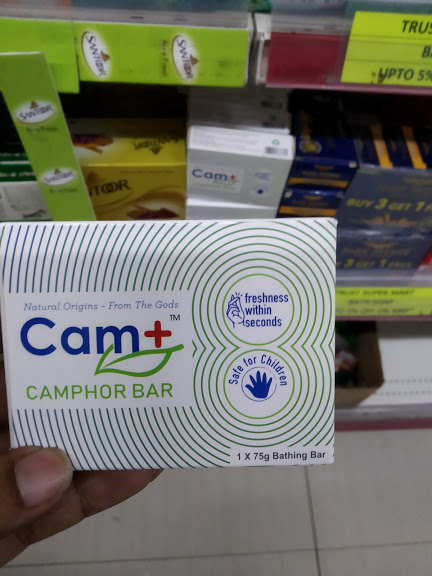
CamPure Cones is the most successful product by the company so far as per Amazon reviews.
It has 610 reviews which is very high. Typically successful products like Jockey Innerwear has that kind of reviews.
170 of those 610 reviews have come just in the current quarter, while we had only 30 in Q1 of last year. This turns out to be 6x growth in customer reviews in Amazon. You can see similar kind of growth on other retail products they are producing too. Actual sales growth would be much higher as repeat buyers can’t re-write reviews. Also once number of reviews reach a huge number like 500+ I don’t think people are encouraged to write reviews as it is a discovered product already. So # of customer reviews may not be a good parameter to track going forward.
Other observations include the kicker sales of the products in Q3. I was under the impression CamPure Cones are not seasonal products
Assuming x% have written reviews out of all the buyers in Q1, revenues from Amazon alone would be (170 * 470 + 30 * 368 + 20 * 221 + 60 * 638) * (100 / x) = 13364000 / x
If I assume x = 0.1, it works out to 13.36 crores of Amazon sales.
For last year Q1, you get (30 * 470 + 5 * 368 + 0 + 10 * 638) * (100 / 0.1) = 2.23 crores.
To give you a perspective, Q1FY19 sales were 88 crores.
Note: Numbers are approximate
| Amazon Reviews | Cones | Sticks | Spray | Tablets | Total Sales (cr) | |
|---|---|---|---|---|---|---|
| Q1FY20 | 170 | 30 | 20 | 60 | ?? | |
| Q4FY19 | 100 | 30 | 20 | 60 | 106 | |
| Q3FY19 | 130 | 50 | 20 | 90 | 121 | |
| Q2FY19 | 70 | 10 | 20 | 109 | ||
| Q1FY19 | 30 | 5 | 10 | 88 | ||
| Q4FY18 | 30 | 5 | 10 | 56 | ||
| Q3FY18 | 40 | 5 | 10 | 78 | ||
| Q2FY18 | 20 | 10 | 71 | |||
| Q1FY18 | 5 | 1 | 35 | |||
| Q4FY17 | 5 | 45 | ||||
| Q3FY17 | 5 | 40 | ||||
| Q2FY17 | 5 | 46 | ||||
| Q1FY17 | 0 | 46 |
Demand side of commodity business: I have tried contacting some dealers to check if there is any drop in the local market. They were quoting b/w 750/kg to 850/kg. Top brands according to most of them are Mangalam, Kanchi, Saptagir (and whatever brand that guy produces).
However, they say that the market isn’t seeing the same kind of heat they saw recently and are waiting for the festive season for some action. So I don’t think the commodity business would give you much growth in Q1.
Supply side and raw material costs, couldn’t do much research lately on this part. It would be appreciated if anyone can help.
Discl: Invested
9 Likes
@lingalarahul7 - Good work digging up the numbers. I am seeing strong traction for the Cone product too going by the distribution of reviews. Its hard to come to a conclusion on the contribution of these things to the business though. Supply-side as of March/April, imports are near zero and exports are still up.
Nice to see CRISIL upgrade ratings of both Short-term and Long-term up by a notch at a time when credit agencies are withdrawing or rapidly downgrading ratings all over the place and market is having liquidity issues. Another interesting thing I noticed in the ratings is that new Capacity will come online by Oct 2019. Remains to be see how margins work out after capacities come online.
7 Likes
Export of 29142922 SYNTHETIC CAMPHOR from India
| Year | Amount in INR Lacs | Qty in 1000 KGS / MT | Average Realisation |
|---|---|---|---|
| 2015-2016 | 681.65 | 118.09 | 577.2292319 |
| 2016-2017 | 648.37 | 108.18 | 599.3436864 |
| 2017-2018 | 2752.61 | 455.85 | 603.8411758 |
| 2018-2019 | 16366.20 | 1811.99 | 903.2169052 |
| April 2019 | 1,126.74 | 120.95 | 931.575031 |
Average export realisations are in the 850-950 range which is very healthy for exporters.
Import of 29142922 SYNTHETIC CAMPHOR to India
| Year | Amount in INR Lacs | Qty in 1000 KGS / MT | Average Realisation |
|---|---|---|---|
| 2015-2016 | 6,252.53 | 2,986.78 | 209.340159 |
| 2016-2017 | 6,343.78 | 2,932.61 | 216.3185695 |
| 2017-2018 | 5,228.59 | 1,637.06 | 319.3890267 |
| 2018-2019 | 1,856.00 | 342.01 | 542.6741908 |
Overall macro scenario looks optimistic for the industry. The company too has been moving in the right directions with the buyback + token dividend + fmcg foray. Key things to watch out for:
(1) Price trends
(2) They need to continue to show patience for the FMCG division. Starting an Instagram or Amazon campaign is easy - key is to keep the hard work going even without immediate results.
(3) Annual Report - it’ll be interesting to see if they provide segment wise numbers. Also, more clarity on business performance by the management would help gauge if our analysis is in the right track.
6 Likes
From where did you get this data?
Thanks