Most investors on valuepickr would agree they would be resonably happy with 25% CAGR. Recently I was going through all the indexes NSE has, I came across a index named nifty growth sector 15 index. In last 5 years it gave a returns of 18.15% , in same period nifty50 gave 11.91%. Since inception its returns is 25.18%, in same period nifty50 gave 15.68%
The methodology followed is as follows:
Sector Selection:
Sectors are selected based on P/E and P/B values of IISL sector indices, which are compared to Nifty 50. The yearly avg. P/E and avg. P/B values are compared with Nifty 50’s yearly avg. P/E and avg. P/B values and if, out of the 4 observations, sector that have higher P/E and P/B in 3 out of 4 observations are shortlisted.
For the purpose of clarity, for 2 years period, there will be 4 observations (i.e. 2 yearly avg. P/E numbers and 2 avg. P/B numbers for each index). Out of 4 observations, sectors that have higher P/E and P/B in 3 out of 4 observations are selected.
Stock Selection:
Securities having derivatives available on them, from sectors for base period (i.e. July-December 2008) are identified.
The securities are then ranked as per Free float market capitalization and top 50% of the securities are carried forward for further scrutiny.
The securities identified in above steps are then ranked by EPS growth frequency.
Any security which had negative EPS for base review period is not considered.
Top 15 companies are selected as base composition.
Sector review is carried out once in 2 years whereas, stock selection is reviewed semi-annually.
Top Properties of this index I see is :
Avoids Cyclicals: Sectors currenly selected are IT, CONSUMER GOODS, AUTOMOBILE, PHARMA. It avoids all cyclical sectors like ENERGY, CONSTRUCTION, CEMENT & CEMENT PRODUCTS, METALS, TELECOM which NIFTY50 has.
Concentrated Portfollio : Warren Buffet’s always believed in having concentrated portfolio. Here its only 15 stocks in 4 sectors, a perfect eaxmple of such portfolio.
Low Beta: This is a very low beta fund which has a very less drawdown compared to nifty50 which can give you confidence to leverage. There is a common misconception in investing world that low beta means low risk and hence low returns . However researches have proved low beta indexes/funds in long run outperforms high beta indexes/funds
Dividend Yield: It has slightly higher dividend yield than nifty50, ie 1.5% compared to nifty50’s 1.22%
Large Caps : As a valuepikr we always tend to pick from midcaps and smallcaps. However RJ always says large caps will give higher returns than small caps, RJ’s claim is actually true as since inception nifty midcap 50 gave 10.5% where nifty 50 gave 12.5% in the same period
Counter-arguments or Suggestions to improve on this methodology are welcome.
Thanks Ishan for digging in the indices & pointing this out.
I have read & re-read the methodology used for sector & stock selection. But, still, I am unable to understand that why sectors with higher P/E & P/BV values, compared to those of Nifty 50., are selected.
What makes this methodology give better returns ? As we will be buying out securities that are trading at a premium.
Generally if you see cyclical sectors have lower PE compared to evergreen sectors. If you see most cyclical sectors have single digit PE during downturns and at upturn of the cycle their PE expand but still fails to reach the PE levels of evergreen sectors. So by this methodolgy we are primarily eliminating cyclical sectors.
Secondly lets talk what PE is, PE is an indication of market’s sentiments of a company’s future prospects. Low PE sector means market at that point is not much hopeful of the sector’s future. If you see stocks like Bosch or Asian Paints had always been trading at premium PE yet continued to grow without undergrowing major corrections. Why is it so? It’s because market’s hope continued to be correct. As an individual investors many times we are tempted to buy stocks at low PE meaning we are more hopeful of its future than the market. And buying at high PE means the market is extremely hopeful of its future and we are just agreeing with the market by buying it at a premium.
For thsese companies it is highly unlikely you will get them at single digit PE, because market understands its future prospects very well. This philosophy gave better returns because historically market has been more often correct than a novice individual investor. We buy Low PE stocks with the hope of seeing a PE expansion to exit at higher PE which has actually happened lot lesser on average whereas market’s belief of high PE stocks continue to perform irrespective of high PE has come true more often. For example it may be so India Motor Parts is trading at lot lesser PE than Bosch, but can you have as much conviction of it continuity of growth as you can have for Bosch?
So my learning from this is we should look for low PE stocks only if we are sure and can have a very very strong conviction that we understand company’s future prospects better than what the market does. We can get rid of mentality of judging a company solely by PE/PB by not comparing PE of a company in one sector with PE of company in other sector but by giving precedence to growth prospects especially for such well known large caps.
Another thing I realised is for such well known large caps, PE tells me about entry point and exit point of a stock and not for stock selection. So we can use Premium PE based methodology for sector selection and EPS growth rate based methodology for stock selection and low PE based methodology to enter into those selected stocks.
PS: As a valuepickr I have always been picking from midcap and smallcap stocks with the hope of spotting a multibagger which many good investors also do. But whenever I saw some interview of RJ he mentioned largecaps would give better returns than midcaps or smallcaps, intially I was like how is it possible, but when I started looking into stocks in largecap index and found that it is actually not totally incorrect.
Launch date of this index is May 22, 2014 with a base date of January 01, 2009. Index is fairly new and past performance can be a result of hindsight bias. Base date is also close the financial crisis bottom so since-inception returns is a result of base effect. This index is better than Nifty 50 which only proves that Nifty 50 consists of lot of junk (cyclicals, leveraged, PSUs with no profit objective etc). No wonder value pickers focus on mid and small caps.
Having said that I believe in this methodology (of constructing a concentrated portfolio of only large caps) and I have been following a strategy of picking 10 companies from Nifty 50 to build my portfolio. Here is a link to my portfolio
This portfolio has given me 20% return over 10 years (without hindsight bias or base effect and tested through market cycles)
You are currect, I overlooked the launch date, this is a backtested results not the actual results, would like to see how it performs if backtested on 30 years historical data. For last 7.5 years all the four sectors here IT, CONSUMER GOODS, AUTOMOBILE, PHARMA continued to do good and that sector selection step has become a kind of no operation step and this is the first time in 2016, IT and PHARMA are struggling and to some extent AUTOMOBILE as well.
Secondly it started the backtesting from trough of 2008 recession. So obviously returns will be higher . If you have managed to get 20% in last 10 years obviously your portfolio performed lot better than this as Nifty in last 10 years gave only 9.7%
With large caps, I think a contrarian approach works better than a momentum approach. Just my observation and experience. I think this is because large caps are well researched and monitored so their valuations don’t go out of wack most of the time. There is only a small window of opportunity with a momentum approach compared to contrarian approach.
Contrarian approach basically means buying low PE stocks which are not in fansy whereas a momentum approach means high PE stocks which market currently loves. It depends on how big the cycle is and how long are you palnning to hold.
But as I said, I would agree with you on this as I am not looking for a short term capital gain , thats why i mentioned we can use this,
I believe contrarian approach holds or not depends on the period of holding (depending on how sooner you expect the inflection point to arrive) more than the market cap of the stock.
If you check few PMS managers’ style, Porinju primarily picks amongst beaten down small and micro caps with a contrarian view whereas someone like Basanth Maheshwari picks sector leaders irrespective of PE it’s trading at.
I haven’t run a backtesting stategy to find whose works better, but aparantly methodologies are debatable. In stock market there is no golden rule which works for ever, if one particular methodology is found to work very well then so many people start adopting it, that it looses its edge after few years.
Fantastic find, thanks very much for posting. Is there any way to buy this index? Any ETF? You can buy individual stocks in the index but then it would be hard to keep track when the index is changed. Any thoughts? Thanks!
For Large Caps Contrarian approach is successful, over 3 to 5 year period. I have extensively back-tested it for most constituents of Nifty 50.
This thought process found its seed in a blog-post I read, where the writer showed how most Nifty Scrips swing over 30% each year.
If a system of investment be designed to SIP in suitable scrips, after a 20% correction, then over the long term it will only prove profitable.
A well diversified set should reduce the risk of backlash due to shady managements like the recent case of Yes Bank, or years of sideways grind due to over-valutaion on good companies like HuL.
For poor growth companies deeper correction level could be set. Like, there is no hurry to buy a Tata Steel or Ongc at anywhere less than 50% correction.
This should do wonders over the long run.
I intend to compare returns from this approach only with that of FDs or your run of the mill MF or Gold over the long run.
It is my opinion that share prices of good businesses often stagnate, because the market participants factor future growth in current price. Excel rules. However, when the real world results fall short they recalibrate their targets, which is when the prices start correcting, sometimes sharply.
Therefore, simply buying an Index in the name of growth may give several years of sub-par performance. More importantly, there is no dire need to take this path, when there are some intuitive ways around it.
Can someone let me know who manages these Indexes? I mean that which stocks should be a part of it and which not? Is it managed by the exchange or someone else? Who are those managers? Are they from good institutes and experience and how often they change jobs, what is their background…etc… these are some of the thoughts coming to me when I think of trusting my money with Indexes…I am not aware so pls let me know.
Also, is it not better to buy Growth Mutual Funds. Even if we pay expense ratio, we are aware that well educated and experience managers are running the funds?
I have gone through this thread since it mentioned Low beta stock index at the beginning.
I am also looking for some strategy where in an investor can minimize the drawdowns when markets correct. Hence I am interested in knowing if Low Beta stocks can minimize drawdowns. I will be satisfied if the individual stock level drawdowns are limited to 25% to 30% if Market corrects by more than this.
I am talking only about market risk or systematic risk and not stock specific risk.
Can Low Beta investing minimize drawdowns to some extent? If there is any research on this, I might be interested.
If you have put money in realty and can take it out , this is a good time .
Real Estate Vs Index in Short Term
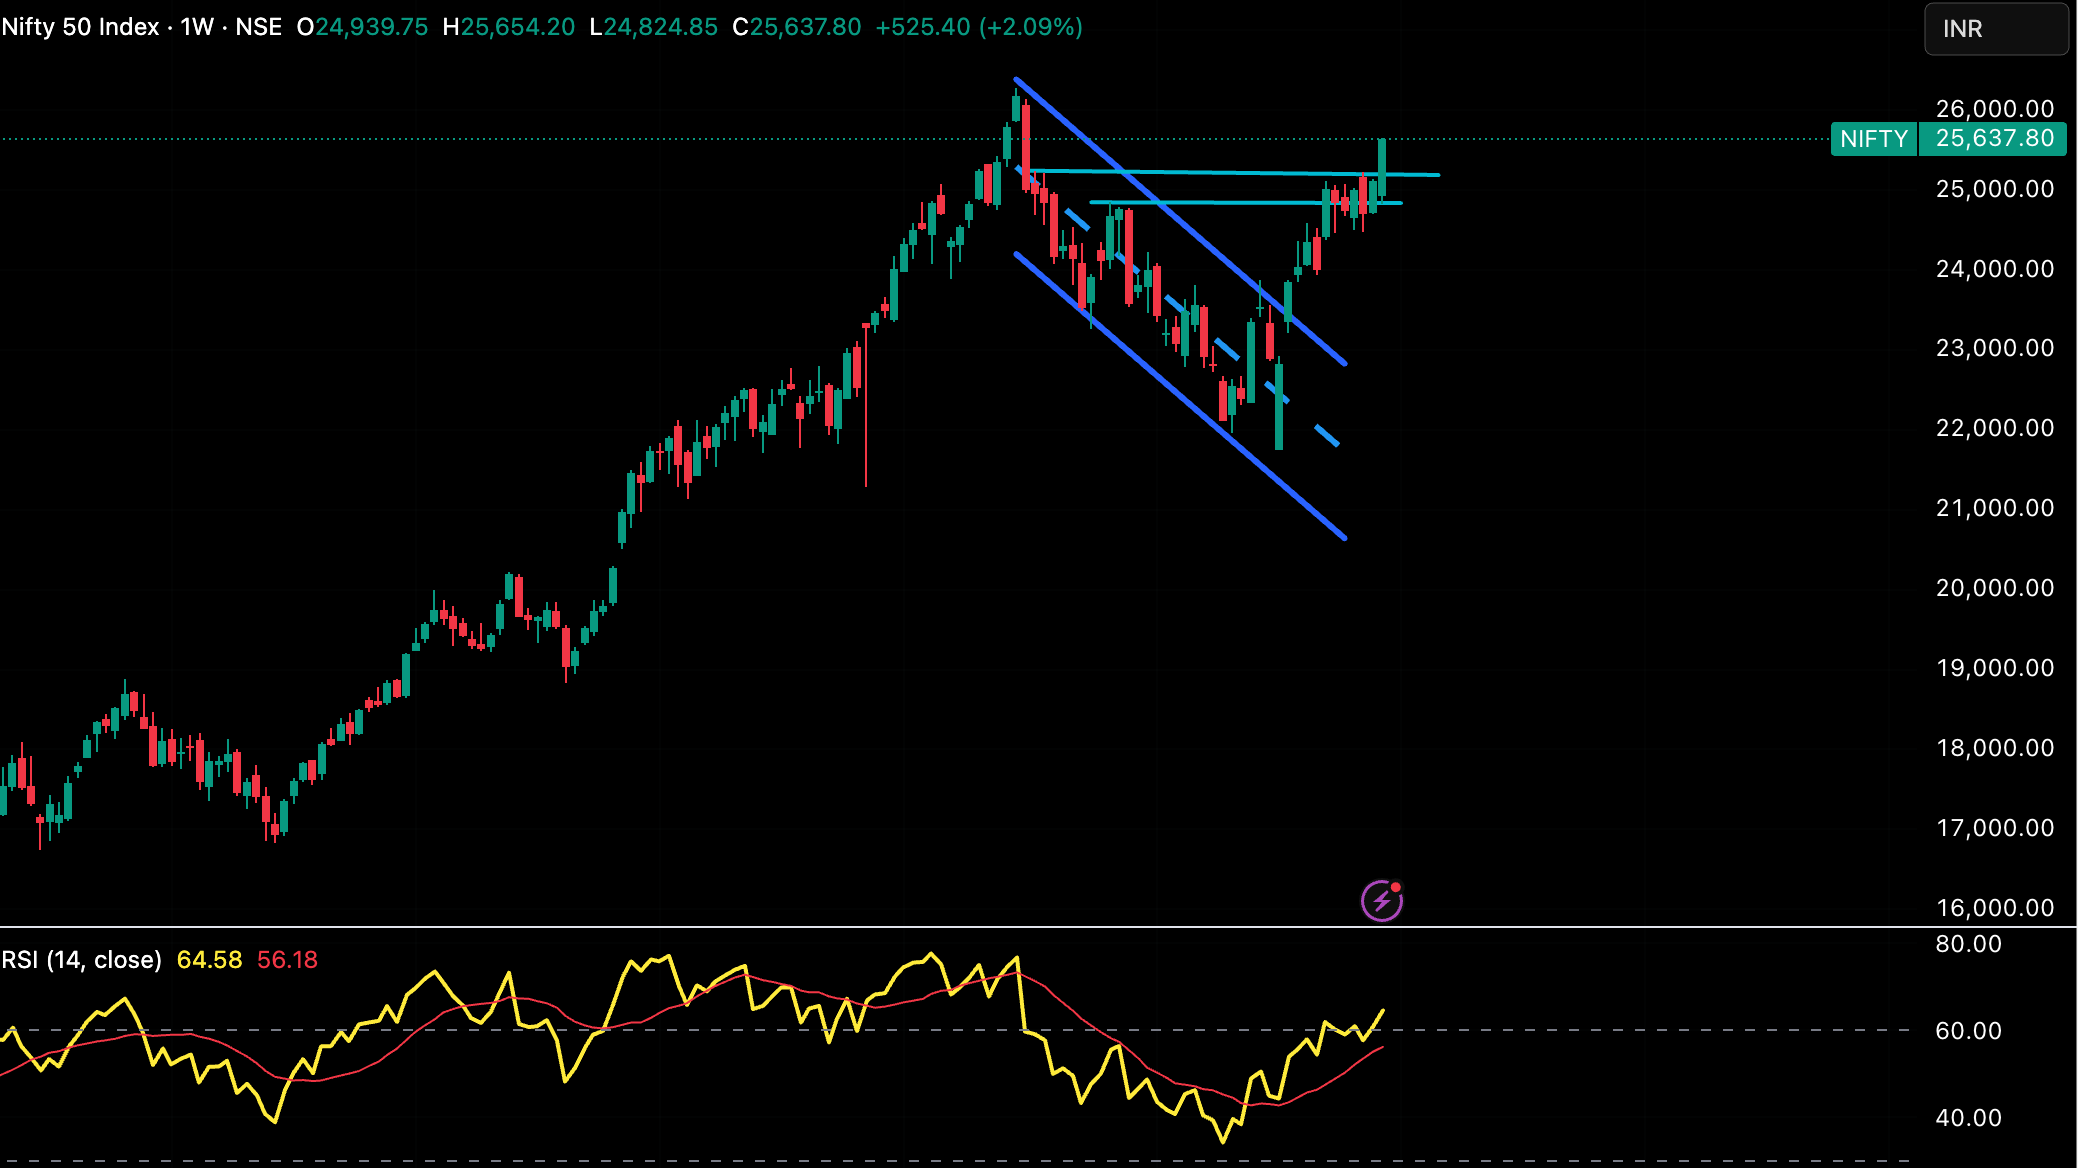
Realty is in final leg of its recent bull run and it is tired whereas equity is going to start a very fresh bullish move after resting between October to April.
In July , we will start getting Q 1 results .
Wars and tarrifs stories would be old .
Monsoon play will be in full swing .
RBI liquidity injection would start showing its impact .
And all these factors can give 10-20% move in Nifty and 30-40% move in selective stocks .