Capacity utilization has increased from 42% in 2010 to 46.15% in 2016 indicating robust demand for its products. The March17 AR is not out yet.
The %prodn in PET bottles has also increased substantially since 2010 adding to the margins.
Post demonetization and 500 mtr bans it would be interesting to see the the numbers of both cap utilization and % prdn in PET bottles and evaluate the impact.
It is important to note that Shiv Sena dominates the Thane Municipal Corporation with 67 seats in 2017 which have increased from 54 in the previous election.
This company is always the earliest to post its result every quarter even before the IT companies announce their results. I think it is habit of a good management. Anways the results are normal, no improvement.
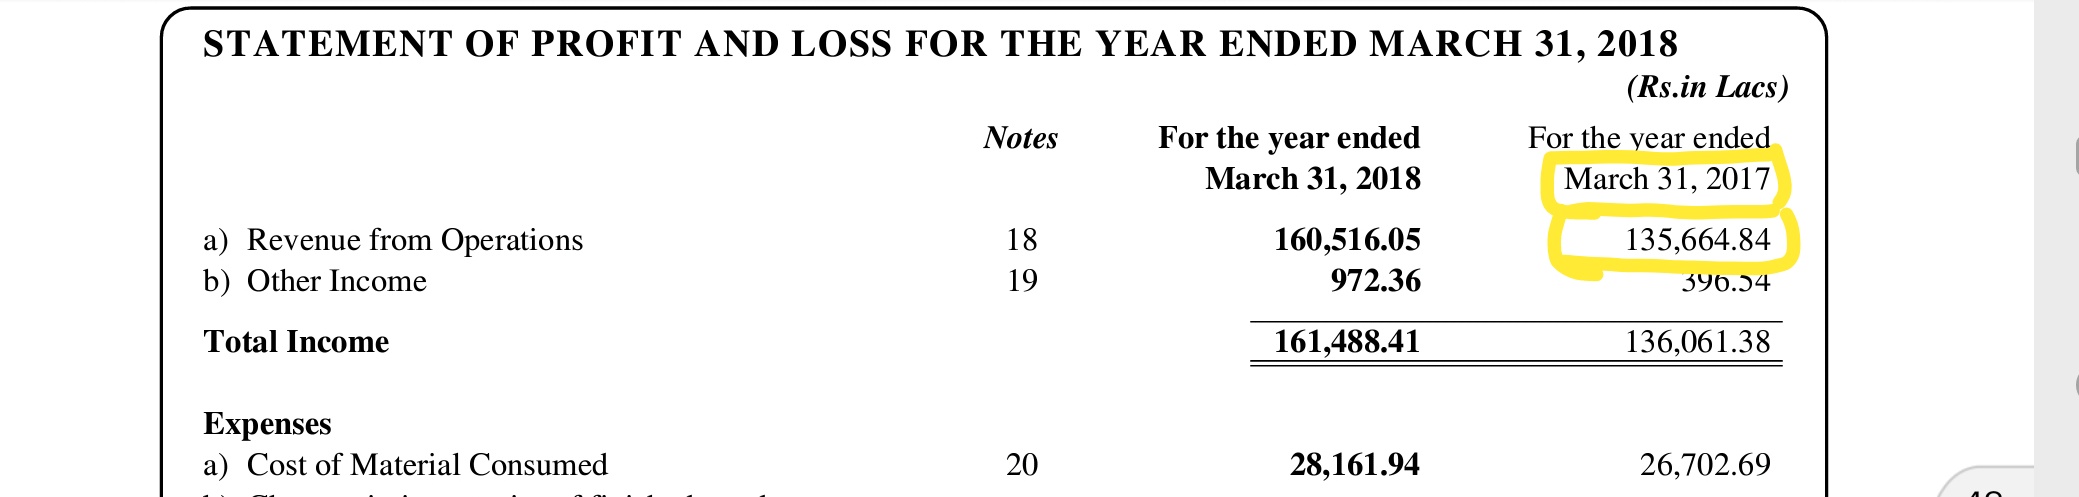
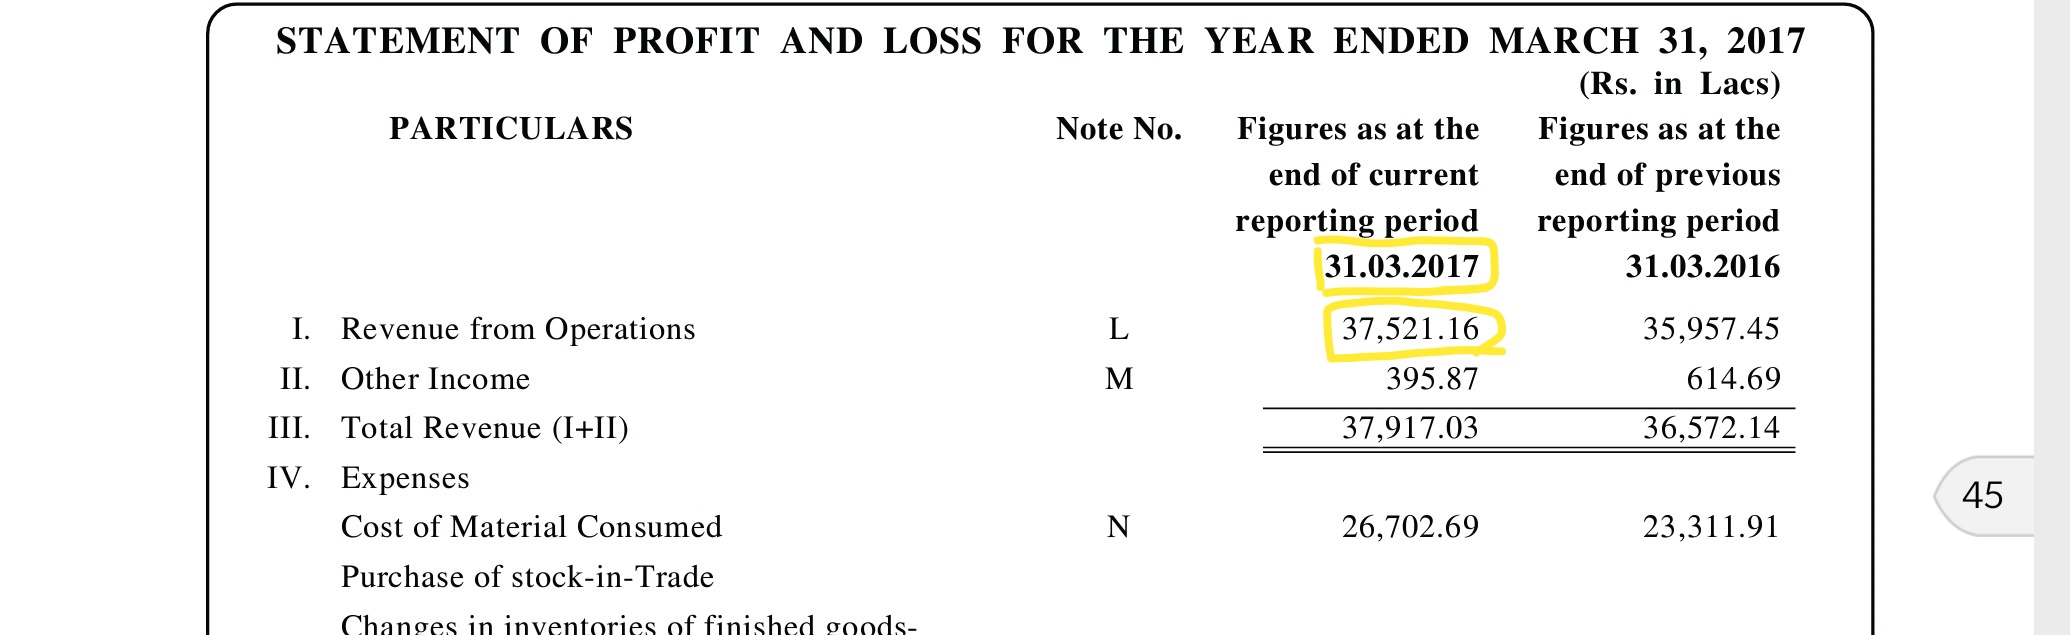
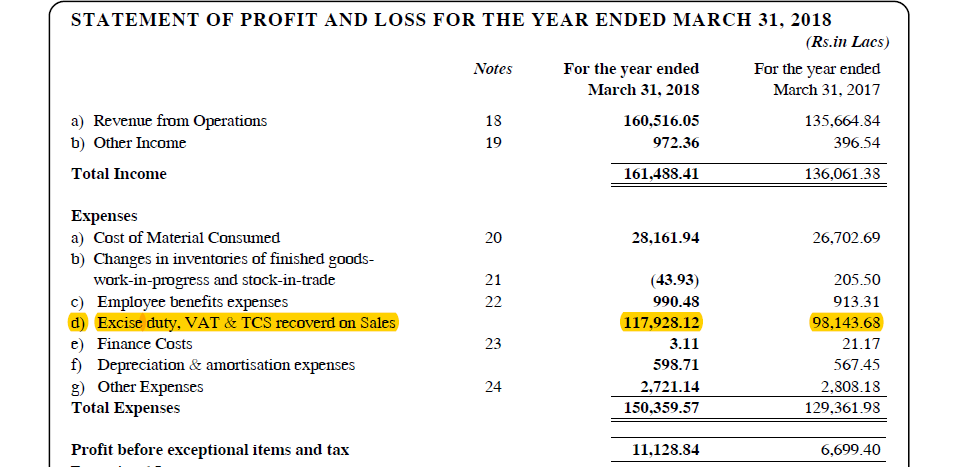
What is wrong with this sales figures in there annual report?? Or something is beyond my understanding?Can somebody explain please why sales in 2017 is different for AR 17 and AR 18?
Prices are depressed for a lot of small and midcaps. However, as far as GM is concerned it looks more like a consolidation to me than a downtrend in prices. The main raw material for GMB is rectified spirit which is basically ethanol - a derivative of sugar manufacturing process. The operating margins of GM breweries are volatile but overall its a good business even with the RM volatility with an average ROE of 22% over the past 12 years. Sugar prices are expected to remain muted for sometime and I think margins may further improve in the future.
The co however doesn’t seem to believe in sharing and has instead done a lot of property & other financial investments. There are some other corporate governance flags as well but overall its a decent business available at what i think is an attractive valuation.
As per the news articles in your earlier posts, molasses prices have fallen drastically. Then why the raw material cost has gone up in Q2 result, for similar sales revenue ?
Is the data for the number of cases shipped per quarter available anywhere?
The Q2FY2018 EPS of 10.63 is on fully diluted basis, adjusting for bonus shares. So in that sense is about 25% higher than Q2FY2017 EPS of 10.7. Is this correct?
When this post was initiated the stock P/E was around 5. In between it went upto 20+. Industry average as per moneycontrol is around 54 and the top 5 liquor companies are in the range 15-50+. Given these, what should be a reasonable P/E that one can assign to GM Breweries? Currently it trades around 10-11 P/E on a annualized basis, it seems.
I dont think cases shipped per quarter data is available. However demand for liquor in general is increasing in Mumbai and country liquor occupies a major share of it
Yes
Dont know about this but its attractively priced in my view
GM runs a blending and bottling plant. They purchase rectified spirit from distilleries & other suppliers and sell it after blending & bottling it. I think in india you can produce ethanol only from molasses.
Dont compare H1FY18 to H1FY19. Compare Q1FY19 to Q2FY19. For similar sales revenue COGS has increased. I read its due to higher PET coke prices affecting plastic bottle cost. Looks like this overcame the effect of lower molasses price.
On a lighter note, the pricing attractiveness seems to only increase with time.