
Managed to do some ground work on this - essentially looking at the non lending segments within the financialization theme.
I always like to look at the complete industry value chain for a start and identify some basic categories before looking at specific companies. Reason being this gives me a 20,000 ft view of the industry growth rate, basic economics and dynamics, where the profit pools are currently and how they are likely to evolve.
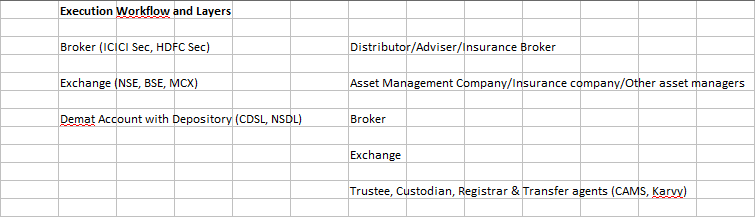
Here’s a representation of how the segments are stacked up (on the lines of how a technology guy would try to represent the architecture of any solution) -
Now to size each of the categories -
-
Depositories - NDSL and CDSL combined revenue of 380 Cr and PAT of 165 Cr. No wonder the industry structure is consolidated here since the profit pool is limited and is not large enough to entice a new entrant. It is likely to stay that way for a long time since the key value addition here is reliability and efficiency in exchange for a hygienic price.
-
Exchanges - NSE and BSE combined revenue of 3400 Cr and PAT of 1340 Cr. Obviously a very profitable segment but then will continue to be consolidated for the same reasons mentioned above. The upfront regulatory and technology costs are too high and it will not be easy to take market share away from incumbents
-
Broking (including prop trading) - Adding up the turnover numbers of NSE and BSE, Cash turnover is approx 83,00,000 Cr which translates to an ADTO (Average Daily Turnover of approx 32,000 Cr). In the F&O segment combined the turnover is a notional 1649 lakh Cr but this is the size of the position. The underlying premium number would approx be in the range of 14.5 lakh Cr per annum. Working with these numbers, the size of the broking segment is likely to be in the range of 16,000 Cr per annum as of 2018, PAT is likely to be in the range of 4000 - 4500 Cr.
This segment has a big enough profit pool and does not have high entry costs, hence most of the new entrants have been into this segment. One should also expect to see more disruption here since the layer closest to the customer which offers the easiest profit pool should get attacked more. Industry structure as expected is an oligopoly with the top 5 brokers accounting for < 50% of the market, most of these brokers are backed by banks which serve as cheap customer acquisition channels for them.
-
Asset Management - MF AUM of 21,00,000 Cr as of March 2018, segment revenue of approx 18,000 Cr and PAT in the range of 5000 Cr once you scope in for the PMS and AIF segment as well. Once again the profit pool is large enough for new players to consider entering, however not all AMC’s are profitable since cost structure (other than distribution costs) are the same irrespective of what the AUM is. We have a long tail of players here which are getting consolidated at a healthy rate. Top 5 AMC’s (once again most of them backed by banks/large corporate houses) account for > 50% of the AUM
-
Wealth Management - Approx 8,00,000 Cr of AUA with revenue base of approx 8000 Cr and PAT of 2500 Cr. This has traditionally been the most dis aggregated segment since entry costs are next to nothing. Successful wealth managers will continue to branch out on their own till the pricing becomes such a challenge that this trend reverses. Large players here are once again backed by NBFC’s or Banks. Technology here is a real disuptor and is happening as we speak, once should expect a lot of advisors to become obsolete (especially in the sub HNI segment) since distribution, execution and reporting can all be better done through technology than via employees
-
Insurance - Annual inflow into insurance is approx 4,20,000 Cr. Analyzing this segment is relatively complicated due to the terminology and the actuarial science involved. Due to the underwriting component and the probabilities inbuilt into the business model, this will always be a dicey investment decision - akin to investing in lending entities. Hence my preference is to stay away from this segment till I get a hang of how to look at this
Looking at baseline growth rates -
- FD with Scheduled commercial banks has been growing at 15% between 2004 and 2018. This encompasses a complete cycle of boom, recession, rate hikes and rate cuts. This is baseline growth rate for the financial economy in India - 15% on the face of it is a very healthy growth rate
- MF AUM and Wealth management AUA has grown at 22%+ over the same period
- Inflows into Insurance appears to be growing in the 12-13% range from households
Long story short, the baseline growth rate for any of these segment is likely to outpace the GDP growth rate over the medium term. One could argue that banks will grow at a similar rate but other than insurance segment, none of the other segment have balance sheet risk involved. These are essentially low asset intensive, high ROE and highly scalable businesses. The only segment where the baseline is likely to be lower than this is in the depository segment since maximum throughput is likely to come from the bigger customers who already have demat accounts in place, while the depository will make a % fee per transaction, I cannot see too many non linear equations here which can deliver industry beating growth rate for a depository.
The biggest risks I see are -
- Regulatory risk (which also acts as a strong entry barrier)
- Market Risk (when markets go into bear mode this affects the real business of these segments, something you do not see in other sectors)
- Constant threat of new entrants in some segments (because they are highly profitable and capital requirements are not high)
- Threat of technology led disruption (especially in wealth management)
For the time being we do not have too many listed companies in all these segments, my sense is over the next 3-5 years this will emerge as a large sub sector within financials.
Source for all the numbers quoted here - Triangulation from data in the public domain from the RBI and AMFI, revenue and PAT numbers from the respective annual reports and other company specific publications.